Posts Tagged ‘admin’

Improve haproxy logging with custom log-format for better readiability

Friday, April 12th, 2024

Haproxy logging is a very big topic, worthy of many articles, but unfortunately not enough is written on the topic, perhaps for the reason haproxy is free software and most people who use it doesn't follow the philosophy of free software sharing but want to keep, the acquired knowledge on the topic for their own and if possible in the capitalist world most of us live to use it for a Load Balancer haproxy consultancy, consultancy fee or in their daily job as system administrators (web and middleware) or cloud specialist etc. 🙂

Having a good haproxy logging is very important as you need to debug issues with backend machines or some other devices throwing traffic to the HA Proxy.
Thus it is important to build a haproxy logging in a way that it provides most important information and the information is as simple as possible, so everyone can understand what is in without much effort and same time it contains enough debug information, to help you if you want to use the output logs with Graylog filters or process data with some monitoring advanced tool as Prometheus etc.

In our effort to optimize the way haproxy logs via a configured handler that sends the haproxy output to logging handler configured to log through rsyslog, we have done some experiments with logging arguments and came up with few variants, that we liked. In that article the idea is I share this set of logging  parameters with hope to help some other guy that starts with haproxy to build a good logging readable and easy to process with scripts log output from haproxy.

The criterias for a decent haproxy logging used are:

1. Log should be simple but not dumb
2. Should be concrete (and not too much complicated)
3. Should be easy to read for the novice and advanced sysadmin

Before starting, have to say that building the logging format seems tedious task but to make it fit your preference could take a lot of time, especially as logging parameters naming is hard to remember, thus the haproxy logging documentation log-format description table comes really handy:

Haproxy log-format paremeters ASCII table
 

 Please refer to the table for log-format defined variables :
 

+---+------+-----------------------------------------------+-------------+
| R | var  | field name (8.2.2 and 8.2.3 for description)  | type        |
+---+------+-----------------------------------------------+-------------+
|   | %o   | special variable, apply flags on all next var |             |
+---+------+-----------------------------------------------+-------------+
|   | %B   | bytes_read           (from server to client)  | numeric     |
| H | %CC  | captured_request_cookie                       | string      |
| H | %CS  | captured_response_cookie                      | string      |
|   | %H   | hostname                                      | string      |
| H | %HM  | HTTP method (ex: POST)                        | string      |
| H | %HP  | HTTP request URI without query string (path)  | string      |
| H | %HQ  | HTTP request URI query string (ex: ?bar=baz)  | string      |
| H | %HU  | HTTP request URI (ex: /foo?bar=baz)           | string      |
| H | %HV  | HTTP version (ex: HTTP/1.0)                   | string      |
|   | %ID  | unique-id                                     | string      |
|   | %ST  | status_code                                   | numeric     |
|   | %T   | gmt_date_time                                 | date        |
|   | %Ta  | Active time of the request (from TR to end)   | numeric     |
|   | %Tc  | Tc                                            | numeric     |
|   | %Td  | Td = Tt - (Tq + Tw + Tc + Tr)                 | numeric     |
|   | %Tl  | local_date_time                               | date        |
|   | %Th  | connection handshake time (SSL, PROXY proto)  | numeric     |
| H | %Ti  | idle time before the HTTP request             | numeric     |
| H | %Tq  | Th + Ti + TR                                  | numeric     |
| H | %TR  | time to receive the full request from 1st byte| numeric     |
| H | %Tr  | Tr (response time)                            | numeric     |
|   | %Ts  | timestamp                                     | numeric     |
|   | %Tt  | Tt                                            | numeric     |
|   | %Tw  | Tw                                            | numeric     |
|   | %U   | bytes_uploaded       (from client to server)  | numeric     |
|   | %ac  | actconn                                       | numeric     |
|   | %b   | backend_name                                  | string      |
|   | %bc  | beconn      (backend concurrent connections)  | numeric     |
|   | %bi  | backend_source_ip       (connecting address)  | IP          |
|   | %bp  | backend_source_port     (connecting address)  | numeric     |
|   | %bq  | backend_queue                                 | numeric     |
|   | %ci  | client_ip                 (accepted address)  | IP          |
|   | %cp  | client_port               (accepted address)  | numeric     |
|   | %f   | frontend_name                                 | string      |
|   | %fc  | feconn     (frontend concurrent connections)  | numeric     |
|   | %fi  | frontend_ip              (accepting address)  | IP          |
|   | %fp  | frontend_port            (accepting address)  | numeric     |
|   | %ft  | frontend_name_transport ('~' suffix for SSL)  | string      |
|   | %lc  | frontend_log_counter                          | numeric     |
|   | %hr  | captured_request_headers default style        | string      |
|   | %hrl | captured_request_headers CLF style            | string list |
|   | %hs  | captured_response_headers default style       | string      |
|   | %hsl | captured_response_headers CLF style           | string list |
|   | %ms  | accept date milliseconds (left-padded with 0) | numeric     |
|   | %pid | PID                                           | numeric     |
| H | %r   | http_request                                  | string      |
|   | %rc  | retries                                       | numeric     |
|   | %rt  | request_counter (HTTP req or TCP session)     | numeric     |
|   | %s   | server_name                                   | string      |
|   | %sc  | srv_conn     (server concurrent connections)  | numeric     |
|   | %si  | server_IP                   (target address)  | IP          |
|   | %sp  | server_port                 (target address)  | numeric     |
|   | %sq  | srv_queue                                     | numeric     |
| S | %sslc| ssl_ciphers (ex: AES-SHA)                     | string      |
| S | %sslv| ssl_version (ex: TLSv1)                       | string      |
|   | %t   | date_time      (with millisecond resolution)  | date        |
| H | %tr  | date_time of HTTP request                     | date        |
| H | %trg | gmt_date_time of start of HTTP request        | date        |
| H | %trl | local_date_time of start of HTTP request      | date        |
|   | %ts  | termination_state                             | string      |
| H | %tsc | termination_state with cookie status          | string      |
+---+------+-----------------------------------------------+-------------+
R = Restrictions : H = mode http only ; S = SSL only


Our custom log-format built in order to fulfill our needs is as this:

log-format %ci:%cp\ %H\ [%t]\ [%f\ %fi:%fp]\ [%b/%s\ %si:%sp]\ %Tw/%Tc/%Tt\ %B\ %ts\ %ac/%fc/%bc/%sc/%sq/%bq


Once you place the log-format as a default for all haproxy frontend / backends or for a custom defined ones, the output you will get when tailing the log is:

# tail -f /var/log/haproxy.log

Apr  5 21:47:19  10.42.73.83:23262 haproxy-fqdn-hostname.com [05/Apr/2024:21:46:23.879] [ft_FRONTEND_NAME 10.46.108.6:61310] [bk_BACKEND_NAME/bk_appserv3 10.75.226.88:61310] 1/0/55250 55 sD 4/2/1/0/0/0
Apr  5 21:48:14  10.42.73.83:57506 haproxy-fqdn-hostname.com [05/Apr/2024:21:47:18.925] [ft_FRONTEND_NAME 10.46.108.6:61310] [bk_BACKEND_NAME//bk_appserv1 10.35.242.134:61310] 1/0/55236 55 sD 4/2/1/0/0/0
Apr  5 21:49:09  10.42.73.83:46520 haproxy-fqdn-hostname.com [05/Apr/2024:21:48:13.956] [ft_FRONTEND_NAME 10.46.108.6:61310] [bk_BACKEND_NAME//bk_appserv2 10.75.226.89:61310] 1/0/55209 55 sD 4/2/1/0/0/0


If you don't care about extra space and logs being filled with more naming, another variant of above log-format, that makes it even more readable even for most novice sys admin or programmer would look like this:

log-format [%t]\ %H\ [IN_IP]\ %ci:%cp\ [FT_NAME]\ %f:%fp\ [FT_IP]\ %fi:%fp\ [BK_NAME]\ [%b/%s:%sp]\ [BK_IP]\ %si:%sp\ [TIME_WAIT]\ {%Tw/%Tc/%Tt}\ [CONN_STATE]\ {%B\ %ts}\ [STATUS]\ [%ac/%fc/%bc/%sc/%sq/%bq]

Once you apply the config test the haproxy.cfg to make sure no syntax errors during copy / paste from this page

haproxy-serv:~# haproxy -c -f /etc/haproxy/haproxy.cfg
Configuration file is valid


Next restart graceously haproxy 

haproxy-serv:~# /usr/sbin/haproxy -D -f /etc/haproxy/haproxy.cfg -p /var/run/haproxy.pid -sf $(cat /var/run/haproxy.pid)


Once you reload haproxy graceously without loosing the established connections in stead of restarting it completely via systemd sysctl restart haproxy:


2024-04-05T21:46:03+02:00 localhost haproxy[1897731]: 193.200.198.195:50714 haproxy-fqdn-hostname.com [05/Apr/2024:21:46:03.012] [FrotnendProd 10.55.0.20:27800] [BackendProd/<NOSRV> -:-] -1/-1/0 0 — 4/1/0/0/0/0
2024-04-05T21:46:03+02:00 localhost haproxy[1897731]: 193.100.193.189:54290 haproxy-fqdn-hostname.com
[05/Apr/2024:21:46:03.056] [FrotnendProd 10.55.0.20:27900] [BackendProd/<NOSRV> -:-] -1/-1/0 0 — 4/4/3/0/0/0
2024-04-05T21:46:03+02:00 localhost haproxy[1897731]: 193.100.193.190:26778 haproxy-fqdn-hostname.com
[05/Apr/2024:21:46:03.134] [FrotnendProd 10.55.0.20:27900] [BackendProd/tsefas02s 10.35.242.134:27900] 1/-1/0 0 CC 4/4/3/0/0/0

Note that in that log localhost haproxy[pid] is written by rsyslog, you can filter it out by modifying rsyslogd configurations

The only problem with this log-format is not everyone wants to have to much repeating information pointer on which field is what, but I personally liked this one as well because using it even though occuping much more space, makes the log much easier to process with perl or python scripting for data visualize and very for programs that does data or even "big data" analysis.

Monitoring network traffic tools to debug network issues in console interactively on Linux

Thursday, December 14th, 2023

transport-layer-fourth-layer-data-transport-diagram


In my last article Debugging and routing network issues on Linux (common approaches), I've given some step by step methology on how to debug a network routing or unreachability issues between network hosts. As the article was mostly targetting a command line tools that can help debugging the network without much interactivity. I've decided to blog of a few other tools that might help the system administrator to debug network issues by using few a bit more interactive tools. Throughout the years of managing multitude of Linux based laptops and servers, as well as being involved in security testing and penetration in the past, these tools has always played an important role and are worthy to be well known and used by any self respecting sys admin or network security expert that has to deal with Linux and *Unix operating systems.
 

1. Debugging what is going on on a network level interactively with iptraf-ng

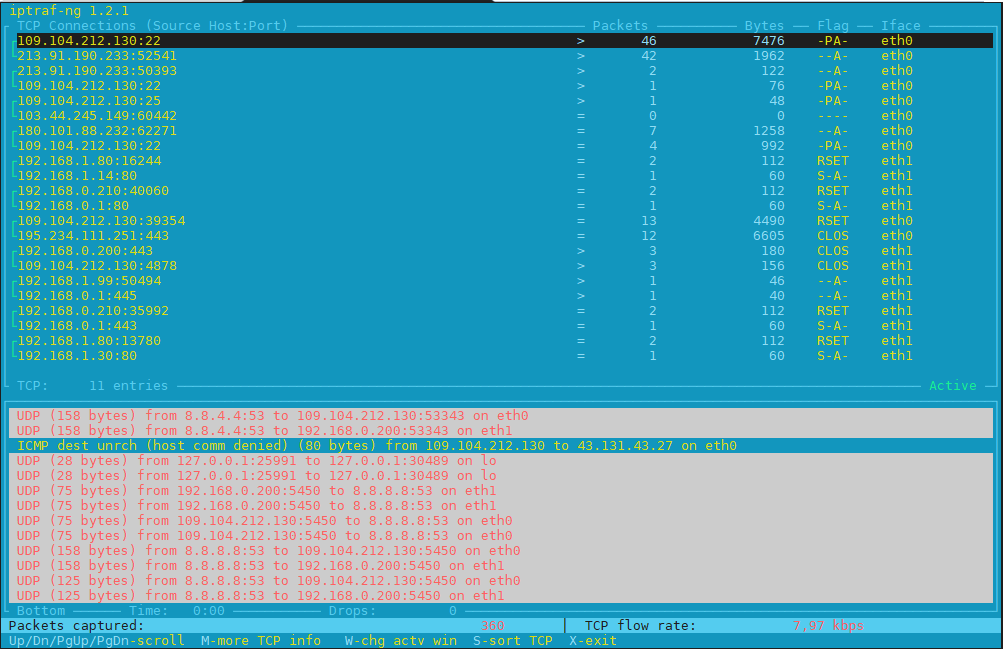
Historically iptraf and today's iptraf is also a great tool one can use to further aid the arsenal debug a network issue or Protocol problem, failure of packets or network interaction issues SYN -> ACK etc. proto interactions and check for Flag states and packets flow.

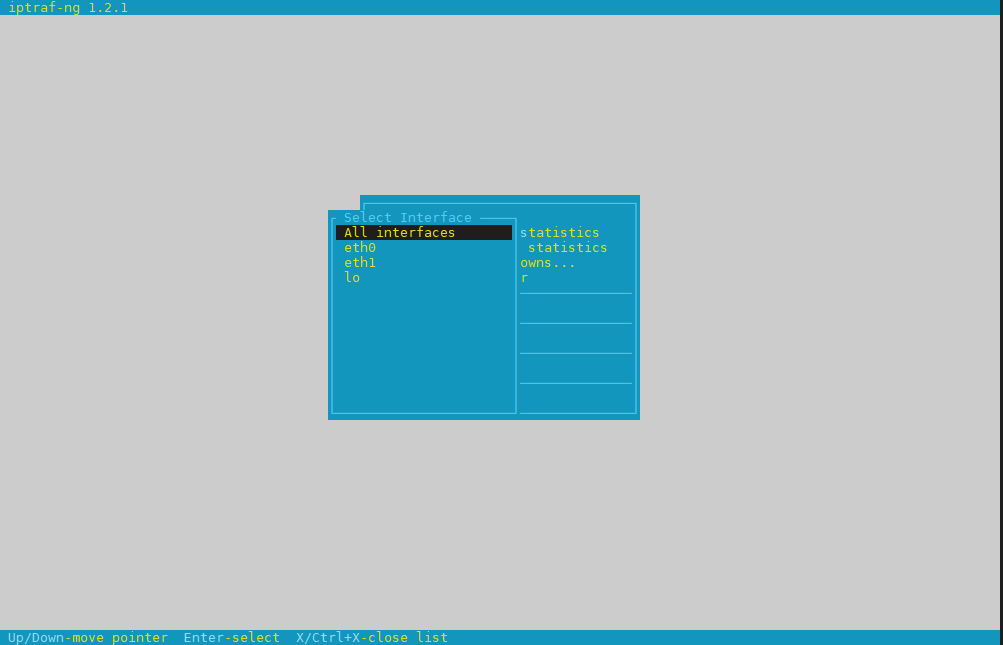
To use iptraf-ng which is a ncurses based tool just install it and launch it and select the interface you would like to debug trafic on.

To install On Debians distros

# apt install iptraf-ng –yes

# iptraf-ng


iptraf-ng-linux-select-interface-screen
 

iptraf-ng-listen-all-interfaces-check-tcp-flags-and-packets


Session-Layer-in-OSI-Model-diagram
 

2. Use hackers old tool sniffit to monitor current ongoing traffic and read plain text messages

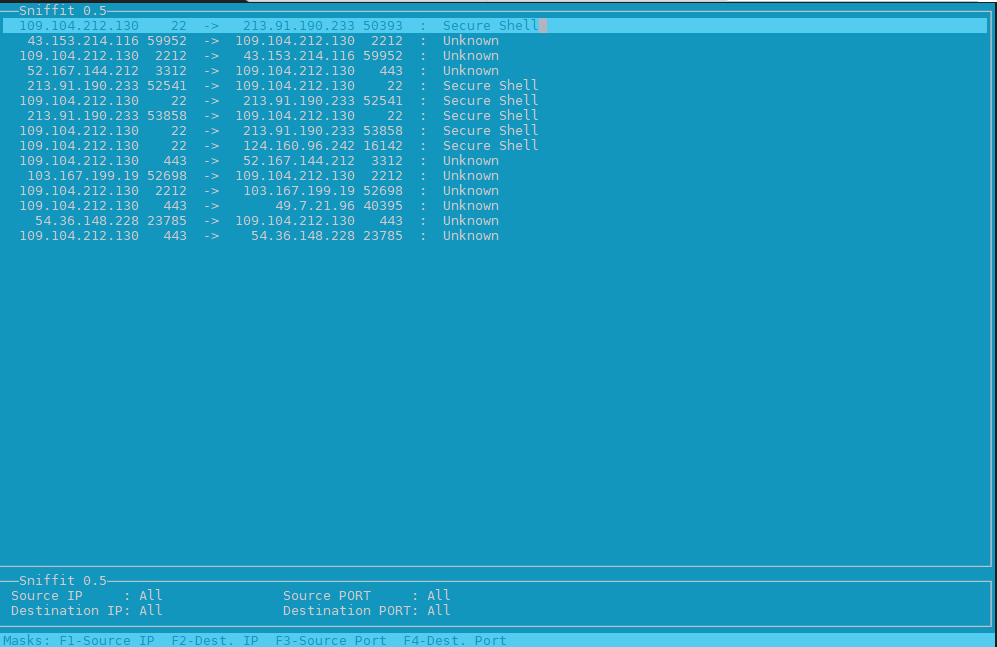
Those older who remember the rise of Linux to the masses, should remember sniffit was a great tool to snoop for traffic on the network.

root@pcfreak:~# apt-cache show sniffit|grep -i description -A 10 -B10
Package: sniffit
Version: 0.5-1
Installed-Size: 139
Maintainer: Joao Eriberto Mota Filho <eriberto@debian.org>
Architecture: amd64
Depends: libc6 (>= 2.14), libncurses6 (>= 6), libpcap0.8 (>= 0.9.8), libtinfo6 (>= 6)
Description-en: packet sniffer and monitoring tool
 Sniffit is a packet sniffer for TCP/UDP/ICMP packets over IPv4. It is able
 to give you a very detailed technical info on these packets, as SEQ, ACK,
 TTL, Window, etc. The packet contents also can be viewed, in different
 formats (hex or plain text, etc.).
 .
 Sniffit is based in libpcap and is useful when learning about computer
 networks and their security.
Description-md5: 973beeeaadf4c31bef683350f1346ee9
Homepage: https://github.com/resurrecting-open-source-projects/sniffit
Tag: interface::text-mode, mail::notification, role::program, scope::utility,
 uitoolkit::ncurses, use::monitor, use::scanning, works-with::mail,
 works-with::network-traffic
Section: net
Priority: optional
Filename: pool/main/s/sniffit/sniffit_0.5-1_amd64.deb
Size: 61796
MD5sum: ea4cc0bc73f9e94d5a3c1ceeaa485ee1
SHA256: 7ec76b62ab508ec55c2ef0ecea952b7d1c55120b37b28fb8bc7c86645a43c485


Sniffit is not installed by default on deb distros, so to give it a try install it

# apt install sniffit –yes
# sniffit


sniffit-linux-check-tcp-traffic-screenshot
 

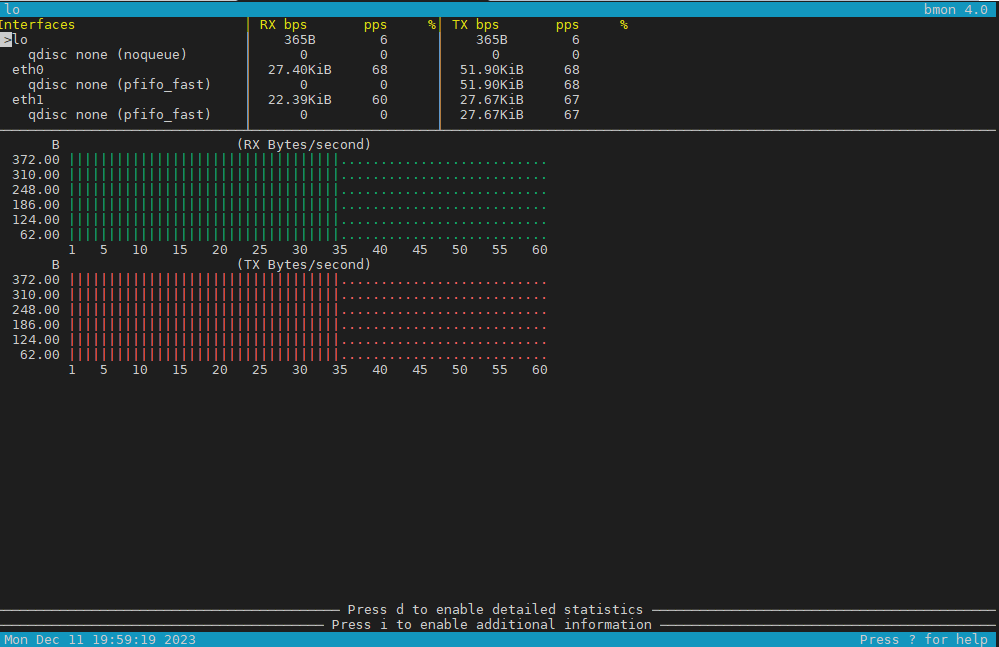
3. Use bmon to monitor bandwidth and any potential traffic losses and check qdisc pfifo
Linux network stack queues


root@pcfreak:~# apt-cache show bmon |grep -i description
Description-en: portable bandwidth monitor and rate estimator
Description-md5: 3288eb0a673978e478042369c7927d3f
root@pcfreak:~# apt-cache show bmon |grep -i description -A 10 -B10
Package: bmon
Version: 1:4.0-7
Installed-Size: 146
Maintainer: Patrick Matthäi <pmatthaei@debian.org>
Architecture: amd64
Depends: libc6 (>= 2.17), libconfuse2 (>= 3.2.1~), libncursesw6 (>= 6), libnl-3-200 (>= 3.2.7), libnl-route-3-200 (>= 3.2.7), libtinfo6 (>= 6)
Description-en: portable bandwidth monitor and rate estimator
 bmon is a commandline bandwidth monitor which supports various output
 methods including an interactive curses interface, lightweight HTML output but
 also simple ASCII output.
 .
 Statistics may be distributed over a network using multicast or unicast and
 collected at some point to generate a summary of statistics for a set of
 nodes.
Description-md5: 3288eb0a673978e478042369c7927d3f
Homepage: http://www.infradead.org/~tgr/bmon/
Tag: implemented-in::c, interface::text-mode, network::scanner,
 role::program, scope::utility, uitoolkit::ncurses, use::monitor,
 works-with::network-traffic
Section: net
Priority: optional
Filename: pool/main/b/bmon/bmon_4.0-7_amd64.deb
Size: 47348
MD5sum: c210f8317eafa22d9e3a8fb8316e0901
SHA256: 21730fc62241aee827f523dd33c458f4a5a7d4a8cf0a6e9266a3e00122d80645


root@pcfreak:~# apt install bmon –yes

root@pcfreak:~# bmon

bmon_monitor_qdisc-network-stack-bandwidth-on-linux

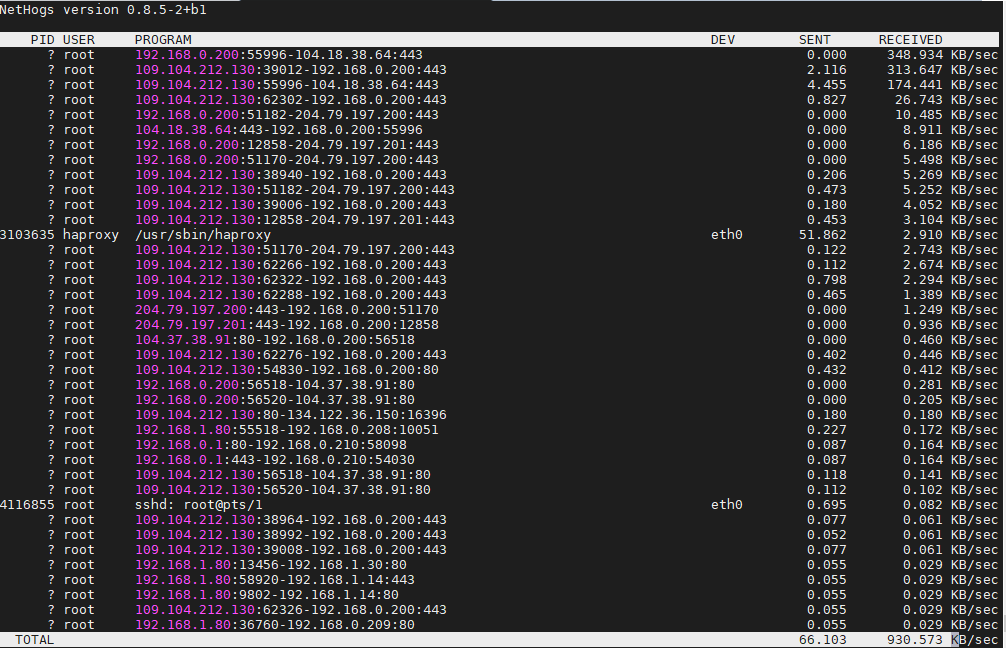
4. Use nethogs net diagnosis text interactive tool

NetHogs is a small 'net top' tool. 
Instead of breaking the traffic down per protocol or per subnet, like most tools do, it groups bandwidth by process.
 

root@pcfreak:~# apt-cache show nethogs|grep -i description -A10 -B10
Package: nethogs
Source: nethogs (0.8.5-2)
Version: 0.8.5-2+b1
Installed-Size: 79
Maintainer: Paulo Roberto Alves de Oliveira (aka kretcheu) <kretcheu@gmail.com>
Architecture: amd64
Depends: libc6 (>= 2.15), libgcc1 (>= 1:3.0), libncurses6 (>= 6), libpcap0.8 (>= 0.9.8), libstdc++6 (>= 5.2), libtinfo6 (>= 6)
Description-en: Net top tool grouping bandwidth per process
 NetHogs is a small 'net top' tool. Instead of breaking the traffic down per
 protocol or per subnet, like most tools do, it groups bandwidth by process.
 NetHogs does not rely on a special kernel module to be loaded.
Description-md5: 04c153c901ad7ca75e53e2ae32565ccd
Homepage: https://github.com/raboof/nethogs
Tag: admin::monitoring, implemented-in::c++, role::program,
 uitoolkit::ncurses, use::monitor, works-with::network-traffic
Section: net
Priority: optional
Filename: pool/main/n/nethogs/nethogs_0.8.5-2+b1_amd64.deb
Size: 30936
MD5sum: 500047d154a1fcde5f6eacaee45148e7
SHA256: 8bc69509f6a8c689bf53925ff35a5df78cf8ad76fff176add4f1530e66eba9dc

root@pcfreak:~# apt install nethogs –yes

# nethogs


nethogs-tool-screenshot-show-user-network--traffic-by-process-name-ID

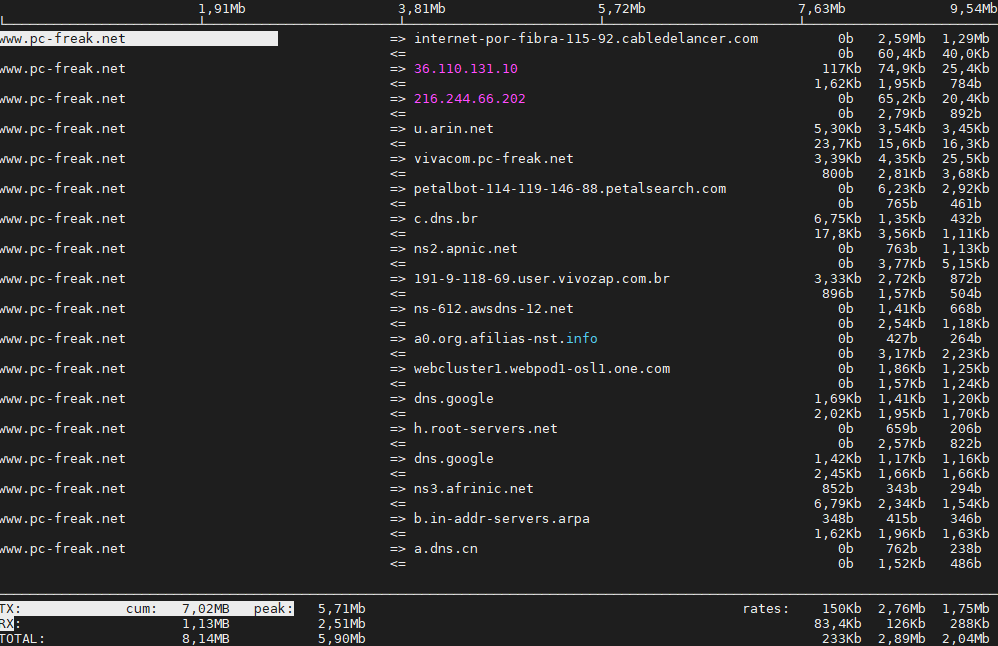
5;.Use iftop –  to display network interface usage


root@pcfreak:~# apt-cache show iftop |grep -i description -A10 -B10
Package: iftop
Version: 1.0~pre4-7
Installed-Size: 97
Maintainer: Markus Koschany <apo@debian.org>
Architecture: amd64
Depends: libc6 (>= 2.29), libncurses6 (>= 6), libpcap0.8 (>= 0.9.8), libtinfo6 (>= 6)
Description-en: displays bandwidth usage information on an network interface
 iftop does for network usage what top(1) does for CPU usage. It listens to
 network traffic on a named interface and displays a table of current bandwidth
 usage by pairs of hosts. Handy for answering the question "Why is my Internet
 link so slow?".
Description-md5: f7e93593aba6acc7b5a331b49f97466f
Homepage: http://www.ex-parrot.com/~pdw/iftop/
Tag: admin::monitoring, implemented-in::c, interface::text-mode,
 role::program, scope::utility, uitoolkit::ncurses, use::monitor,
 works-with::network-traffic
Section: net
Priority: optional
Filename: pool/main/i/iftop/iftop_1.0~pre4-7_amd64.deb
Size: 42044
MD5sum: c9bb9c591b70753880e455f8dc416e0a
SHA256: 0366a4e54f3c65b2bbed6739ae70216b0017e2b7421b416d7c1888e1f1cb98b7


root@pcfreak:~# apt install –yes iftop

iftop-interactive-network-traffic-output-linux-screenshot


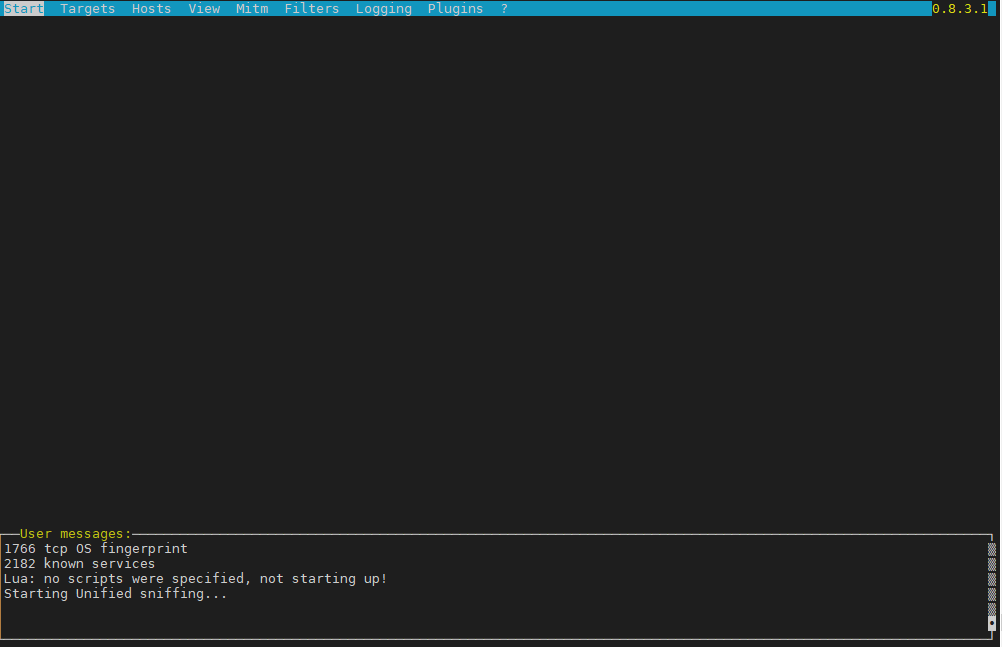
6. Ettercap (tool) to active and passive dissect network protocols for in depth network and host analysis

root@pcfreak:/var/www/images# apt-cache show ettercap-common|grep -i description -A10 -B10
Package: ettercap-common
Source: ettercap
Version: 1:0.8.3.1-3
Installed-Size: 2518
Maintainer: Debian Security Tools <team+pkg-security@tracker.debian.org>
Architecture: amd64
Depends: ethtool, geoip-database, libbsd0 (>= 0.0), libc6 (>= 2.14), libcurl4 (>= 7.16.2), libgeoip1 (>= 1.6.12), libluajit-5.1-2 (>= 2.0.4+dfsg), libnet1 (>= 1.1.6), libpcap0.8 (>= 0.9.8), libpcre3, libssl1.1 (>= 1.1.1), zlib1g (>= 1:1.1.4)
Recommends: ettercap-graphical | ettercap-text-only
Description-en: Multipurpose sniffer/interceptor/logger for switched LAN
 Ettercap supports active and passive dissection of many protocols
 (even encrypted ones) and includes many feature for network and host
 analysis.
 .
 Data injection in an established connection and filtering (substitute
 or drop a packet) on the fly is also possible, keeping the connection
 synchronized.
 .
 Many sniffing modes are implemented, for a powerful and complete
 sniffing suite. It is possible to sniff in four modes: IP Based, MAC Based,
 ARP Based (full-duplex) and PublicARP Based (half-duplex).
 .
 Ettercap also has the ability to detect a switched LAN, and to use OS
 fingerprints (active or passive) to find the geometry of the LAN.
 .
 This package contains the Common support files, configuration files,
 plugins, and documentation.  You must also install either
 ettercap-graphical or ettercap-text-only for the actual GUI-enabled
 or text-only ettercap executable, respectively.
Description-md5: f1d894b138f387661d0f40a8940fb185
Homepage: https://ettercap.github.io/ettercap/
Tag: interface::text-mode, network::scanner, role::app-data, role::program,
 uitoolkit::ncurses, use::scanning
Section: net
Priority: optional
Filename: pool/main/e/ettercap/ettercap-common_0.8.3.1-3_amd64.deb
Size: 734972
MD5sum: 403d87841f8cdd278abf20bce83cb95e
SHA256: 500aee2f07e0fae82489321097aee8a97f9f1970f6e4f8978140550db87e4ba9


root@pcfreak:/ # apt install ettercap-text-only –yes

root@pcfreak:/ # ettercap -C


ettercap-text-interface-unified-sniffing-screenshot-linux

7. iperf and netperf to measure connecitivity speed on Network LAN and between Linux server hosts

iperf and netperf are two very handy tools to measure the speed of a network and various aspects of the bandwidth. It is mostly useful when designing network infrastructure or building networks from scratch.
 

If you never used netperf in the past here is a description from man netperf

NAME
       netperf – a network performance benchmark

SYNOPSIS
       netperf [global options] — [test specific options]

DESCRIPTION
       Netperf  is  a benchmark that can be used to measure various aspects of
       networking performance.  Currently, its focus is on bulk data  transfer
       and  request/response  performance  using  either  TCP  or UDP, and the
       Berkeley Sockets interface. In addition, tests for DLPI, and  Unix  Do‐
       main Sockets, tests for IPv6 may be conditionally compiled-in.


root@freak:~# netperf
MIGRATED TCP STREAM TEST from 0.0.0.0 (0.0.0.0) port 0 AF_INET to localhost () port 0 AF_INET : demo
Recv   Send    Send
Socket Socket  Message  Elapsed
Size   Size    Size     Time     Throughput
bytes  bytes   bytes    secs.    10^6bits/sec

 87380  65536  65536    10.00    17669.96


Testing UDP network throughput using NetPerf

Change the test name from TCP_STREAM to UDP_STREAM. Let’s use 1024 (1MB) as the message size to be sent by the client.
If you receive the following error send_data: data send error: Network is unreachable (errno 101) netperf: send_omni:

send_data failed: Network is unreachable, add option -R 1 to remove the iptable rule that prohibits NetPerf UDP flow.

$ netperf -H 172.31.56.48 -t UDP_STREAM -l 300 — -R 1 -m 1024
MIGRATED UDP STREAM TEST from 0.0.0.0 (0.0.0.0) port 0 AF_INET to 172.31.56.48 () port 0 AF_INET
Socket Message Elapsed Messages
Size Size Time Okay Errors Throughput
bytes bytes secs # # 10^6bits/sec

212992 1024 300.00 9193386 0 251.04
212992 300.00 9131380 249.35

UDP Throughput in a WAN

$ netperf -H HOST -t UDP_STREAM -l 300 — -R 1 -m 1024
MIGRATED UDP STREAM TEST from (null) (0.0.0.0) port 0 AF_INET to (null) () port 0 AF_INET : histogram : spin interval
Socket Message Elapsed Messages
Size Size Time Okay Errors Throughput
bytes bytes secs # # 10^6bits/sec

9216 1024 300.01 35627791 0 972.83
212992 300.01 253099 6.91


Testing TCP throughput using iPerf


Here is a short description of iperf

NAME
       iperf – perform network throughput tests

SYNOPSIS
       iperf -s [options]

       iperf -c server [options]

       iperf -u -s [options]

       iperf -u -c server [options]

DESCRIPTION
       iperf  2  is  a tool for performing network throughput and latency mea‐
       surements. It can test using either TCP or UDP protocols.  It  supports
       both  unidirectional  and  bidirectional traffic. Multiple simultaneous
       traffic streams are also supported. Metrics are displayed to help  iso‐
       late the causes which impact performance. Setting the enhanced (-e) op‐
       tion provides all available metrics.

       The user must establish both a both a server (to discard traffic) and a
       client (to generate traffic) for a test to occur. The client and server
       typically are on different hosts or computers but need not be.


Run iPerf3 as server on the server:

$ iperf3 –server –interval 30
———————————————————–
Server listening on 5201
———————————————————–


Test TCP Throughput in Local LAN


$ iperf3 –client 172.31.56.48 –time 300 –interval 30
Connecting to host 172.31.56.48, port 5201
[ 4] local 172.31.100.5 port 44728 connected to 172.31.56.48 port 5201
[ ID] Interval Transfer Bandwidth Retr Cwnd
[ 4] 0.00-30.00 sec 1.70 GBytes 488 Mbits/sec 138 533 KBytes
[ 4] 30.00-60.00 sec 260 MBytes 72.6 Mbits/sec 19 489 KBytes
[ 4] 60.00-90.00 sec 227 MBytes 63.5 Mbits/sec 15 542 KBytes
[ 4] 90.00-120.00 sec 227 MBytes 63.3 Mbits/sec 13 559 KBytes
[ 4] 120.00-150.00 sec 228 MBytes 63.7 Mbits/sec 16 463 KBytes
[ 4] 150.00-180.00 sec 227 MBytes 63.4 Mbits/sec 13 524 KBytes
[ 4] 180.00-210.00 sec 227 MBytes 63.5 Mbits/sec 14 559 KBytes
[ 4] 210.00-240.00 sec 227 MBytes 63.5 Mbits/sec 14 437 KBytes
[ 4] 240.00-270.00 sec 228 MBytes 63.7 Mbits/sec 14 516 KBytes
[ 4] 270.00-300.00 sec 227 MBytes 63.5 Mbits/sec 14 524 KBytes
– – – – – – – – – – – – – – – – – – – – – – – – –
[ ID] Interval Transfer Bandwidth Retr
[ 4] 0.00-300.00 sec 3.73 GBytes 107 Mbits/sec 270 sender
[ 4] 0.00-300.00 sec 3.73 GBytes 107 Mbits/sec receiver

Test TCP Throughput in a WAN Network

$ iperf3 –client HOST –time 300 –interval 30
Connecting to host HOST, port 5201
[ 5] local 192.168.1.73 port 56756 connected to HOST port 5201
[ ID] Interval Transfer Bitrate
[ 5] 0.00-30.00 sec 21.2 MBytes 5.93 Mbits/sec
[ 5] 30.00-60.00 sec 27.0 MBytes 7.55 Mbits/sec
[ 5] 60.00-90.00 sec 28.6 MBytes 7.99 Mbits/sec
[ 5] 90.00-120.00 sec 28.7 MBytes 8.02 Mbits/sec
[ 5] 120.00-150.00 sec 28.5 MBytes 7.97 Mbits/sec
[ 5] 150.00-180.00 sec 28.6 MBytes 7.99 Mbits/sec
[ 5] 180.00-210.00 sec 28.4 MBytes 7.94 Mbits/sec
[ 5] 210.00-240.00 sec 28.5 MBytes 7.97 Mbits/sec
[ 5] 240.00-270.00 sec 28.6 MBytes 8.00 Mbits/sec
[ 5] 270.00-300.00 sec 27.9 MBytes 7.81 Mbits/sec
– – – – – – – – – – – – – – – – – – – – – – – – –
[ ID] Interval Transfer Bitrate
[ 5] 0.00-300.00 sec 276 MBytes 7.72 Mbits/sec sender
[ 5] 0.00-300.00 sec 276 MBytes 7.71 Mbits/sec receiver


$ iperf3 –client 172.31.56.48 –interval 30 -u -b 100MB
Accepted connection from 172.31.100.5, port 39444
[ 5] local 172.31.56.48 port 5201 connected to 172.31.100.5 port 36436
[ ID] Interval Transfer Bandwidth Jitter Lost/Total Datagrams
[ 5] 0.00-30.00 sec 354 MBytes 98.9 Mbits/sec 0.052 ms 330/41774 (0.79%)
[ 5] 30.00-60.00 sec 355 MBytes 99.2 Mbits/sec 0.047 ms 355/41903 (0.85%)
[ 5] 60.00-90.00 sec 354 MBytes 98.9 Mbits/sec 0.048 ms 446/41905 (1.1%)
[ 5] 90.00-120.00 sec 355 MBytes 99.4 Mbits/sec 0.045 ms 261/41902 (0.62%)
[ 5] 120.00-150.00 sec 354 MBytes 99.1 Mbits/sec 0.048 ms 401/41908 (0.96%)
[ 5] 150.00-180.00 sec 353 MBytes 98.7 Mbits/sec 0.047 ms 530/41902 (1.3%)
[ 5] 180.00-210.00 sec 353 MBytes 98.8 Mbits/sec 0.059 ms 496/41904 (1.2%)
[ 5] 210.00-240.00 sec 354 MBytes 99.0 Mbits/sec 0.052 ms 407/41904 (0.97%)
[ 5] 240.00-270.00 sec 351 MBytes 98.3 Mbits/sec 0.059 ms 725/41903 (1.7%)
[ 5] 270.00-300.00 sec 354 MBytes 99.1 Mbits/sec 0.043 ms 393/41908 (0.94%)
– – – – – – – – – – – – – – – – – – – – – – – – –
[ ID] Interval Transfer Bandwidth Jitter Lost/Total Datagrams
[ 5] 0.00-300.04 sec 3.45 GBytes 98.94 Mbits/sec 0.043 ms 4344/418913 (1%)

UDP Throughput in a WAN

$ iperf3 –client HOST –time 300 -u -b 7.7MB
Accepted connection from 45.29.190.145, port 60634
[ 5] local 172.31.56.48 port 5201 connected to 45.29.190.145 port 52586
[ ID] Interval Transfer Bandwidth Jitter Lost/Total Datagrams
[ 5] 0.00-30.00 sec 27.4 MBytes 7.67 Mbits/sec 0.438 ms 64/19902 (0.32%)
[ 5] 30.00-60.00 sec 27.5 MBytes 7.69 Mbits/sec 0.446 ms 35/19940 (0.18%)
[ 5] 60.00-90.00 sec 27.5 MBytes 7.68 Mbits/sec 0.384 ms 39/19925 (0.2%)
[ 5] 90.00-120.00 sec 27.5 MBytes 7.68 Mbits/sec 0.528 ms 70/19950 (0.35%)
[ 5] 120.00-150.00 sec 27.4 MBytes 7.67 Mbits/sec 0.460 ms 51/19924 (0.26%)
[ 5] 150.00-180.00 sec 27.5 MBytes 7.69 Mbits/sec 0.485 ms 37/19948 (0.19%)
[ 5] 180.00-210.00 sec 27.5 MBytes 7.68 Mbits/sec 0.572 ms 49/19941 (0.25%)
[ 5] 210.00-240.00 sec 26.8 MBytes 7.50 Mbits/sec 0.800 ms 443/19856 (2.2%)
[ 5] 240.00-270.00 sec 27.4 MBytes 7.66 Mbits/sec 0.570 ms 172/20009 (0.86%)
[ 5] 270.00-300.00 sec 25.3 MBytes 7.07 Mbits/sec 0.423 ms 1562/19867 (7.9%)
– – – – – – – – – – – – – – – – – – – – – – – – –
[ ID] Interval Transfer Bandwidth Jitter Lost/Total Datagrams
[ 5] 0.00-300.00 sec 272 MBytes 7.60 Mbits/sec 0.423 ms 2522/199284 (1.3%)
[SUM] 0.0-300.2 sec 31 datagrams received out-of-order


Sum it up what learned


Debugging network issues and snooping on a Local LAN (DMZ) network on a server or home LAN is useful  to debug for various network issues and more importantly track and know abou tsecurity threads such as plain text passowd communication via insecure protocols a failure of proper communication between Linux network nodes at times, or simply to get a better idea on what kind of network is your new purchased dedicated server living in .It can help you also strenghten your security and close up any possible security holes, or even help you start thinking like a security intruder (cracker / hacker) would do. In this article we went through few of my favourite tools I use for many years quite often. These tools are just part of the tons of useful *Unix free tools available to do a network debug. Tools mentioned up are worthy to install on every server you have to administratrate or even your home desktop PCs, these are iptraf, sniffit, iftop, bmon, nethogs, nmon, ettercap, iperf and netperf.
 If you have some other useful tools used on Linux sys admin tasks please share, I'll be glad to know it and put them in my arsenal of used tools.

Enjoy ! 🙂

Check the Type and Model of available installed Memory on Linux / Unix / BSD Server howto

Monday, October 30th, 2023

how-linux-kernel-manages-memory-picture

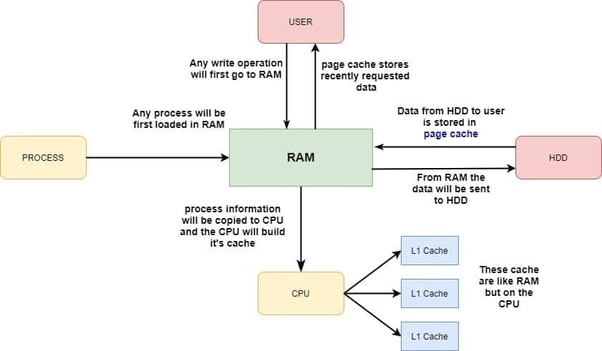
As a system administrator one of the common task, one has to do is Add / Remove or Replace (of Broken or failing Bank of RAM memory) a piece of additional Bank of memory Bank to a Linux / BSD / Unix server.  Lets say you need to fullfil the new RAM purchase and provide some information to the SDM (Service Delivery Manager) of the compnay you're hirder in or you need to place the purchase yourself. Then you  need to know the exact speed and type of RAM currently installed on the server installed.

In this article i'll shortly explain how do I find out ram (SDRAM) information from a via ordinary remote ssh shell session cmd prompt. In short will be shown how can one check RAM speed configured and detected by Linux / Unix kernel ? 
As well as  how to Check the type of memory (if it is DDR / DDR2 / DDR or DDR4) or ECC with no access to Hardware Console.  Please note this article will be definitely boring for the experienced sysadmins but might help to a starter sysadmins to get on board with a well know basic stuff.

There are several approaches, of course easiest one is to use remote hardware access interrace statistics web interface of ILO (on IBM machine) or the IDRAC on (Dell Server) or Fujitsu's servers iRMC. However as not always access to remote Remote hardware management interface is available to admin. Linux comes with few commands that can do the trick, that are available to most Linux distributions straight for the default package repositories.

Since mentioning about ECC a bit up, most old school admins and computer users knows pretty well about DDRs as they have been present over time but ECC is being used over actively on servers perhaps over the last 10 / 15 years and for those not dealt with it below is a short description on what is ECC RAM Memory.

ECC RAM, short for Error Correcting Code Random Access Memory, is a kind of RAM can detect most common kinds of memory errors and correct a subset of them. ECC RAM is common in enterprise deployments and most server-class hardware. Above a certain scale and memory density, single-bit errors which were up to this point are sufficiently statistically unlikely begin to occur with enough frequency that they can no longer be ignored. At certain scales and densities of memory arbitrary memory errors that are literally "one in a million chances" (or more) may in fact occur several times throughout a system's operational life.

Putting some basics, Lets proceed and Check RAM speed and type (line DDR or DDR2 or DDR3 or DDR4) without having to physically go to the the Data Center numbered rack that is containing the server.


Most famous and well known (also mentioned) on few occasions in my previous articles are: dmidecode and lshw

Quickest way to get a quick overview of installed servers memory is with:
 

root@server:~# dmidecode -t memory | grep -E "Speed:|Type:" | sort | uniq -c
      4     Configured Memory Speed: 2133 MT/s
     12     Configured Memory Speed: Unknown
      4     Error Correction Type: Multi-bit ECC
      2     Speed: 2133 MT/s
      2     Speed: 2400 MT/s
     12     Speed: Unknown
     16     Type: DDR4


To get more specifics on the exact type of memory installed on the server, the respective slots that are already taken and the free ones:

root@server:~# dmidecode –type 17 | less

Usually the typical output the command would produce regarding lets say 4 installed Banks of RAM memory on the server will be like:

Handle 0x002B, DMI type 17, 40 bytes
Memory Device
        Array Handle: 0x0029
        Error Information Handle: Not Provided
        Total Width: 72 bits
        Data Width: 64 bits
       
Size: 16 GB
        Form Factor: RIMM
        Set: None
        Locator: CPU1 DIMM A1
        Bank Locator: A1_Node0_Channel0_Dimm1
       
Type: DDR4
        Type Detail: Synchronous
       
Speed: 2400 MT/s
        Manufacturer: Micron
       
Serial Number: 15B36358
        Asset Tag: CPU1 DIMM A1_AssetTag
       
Part Number: 18ASF2G72PDZ-2G3B1 
        Rank: 2
       
Configured Memory Speed: 2133 MT/s
        Minimum Voltage: Unknown
        Maximum Voltage: Unknown
        Configured Voltage: Unknown

Handle 0x002E, DMI type 17, 40 bytes
Memory Device
        Array Handle: 0x0029
        Error Information Handle: Not Provided
        Total Width: Unknown
        Data Width: Unknown
        Size: No Module Installed
        Form Factor: RIMM
        Set: None
        Locator: CPU1 DIMM A2
        Bank Locator: A1_Node0_Channel0_Dimm2
        Type: DDR4
        Type Detail: Synchronous
        Speed: Unknown
        Manufacturer: NO DIMM
        Serial Number: NO DIMM
        Asset Tag: NO DIMM
        Part Number: NO DIMM
        Rank: Unknown
        Configured Memory Speed: Unknown
        Minimum Voltage: Unknown
        Maximum Voltage: Unknown
        Configured Voltage: Unknown


Handle 0x002D, DMI type 17, 40 bytes
Memory Device
        Array Handle: 0x0029
        Error Information Handle: Not Provided
        Total Width: 72 bits
        Data Width: 64 bits
        Size: 16 GB
        Form Factor: RIMM
        Set: None
        Locator: CPU1 DIMM B1
        Bank Locator: A1_Node0_Channel1_Dimm1
        Type: DDR4
        Type Detail: Synchronous
        Speed: 2400 MT/s
        Manufacturer: Micron
        Serial Number: 15B363AF
        Asset Tag: CPU1 DIMM B1_AssetTag
        Part Number: 18ASF2G72PDZ-2G3B1 
        Rank: 2
        Configured Memory Speed: 2133 MT/s
        Minimum Voltage: Unknown
        Maximum Voltage: Unknown
        Configured Voltage: Unknown

Handle 0x0035, DMI type 17, 40 bytes
Memory Device
        Array Handle: 0x0031
        Error Information Handle: Not Provided
        Total Width: 72 bits
        Data Width: 64 bits
        Size: 16 GB
        Form Factor: RIMM
        Set: None
        Locator: CPU1 DIMM D1
        Bank Locator: A1_Node0_Channel3_Dimm1
        Type: DDR4
        Type Detail: Synchronous
        Speed: 2133 MT/s
        Manufacturer: Micron
        Serial Number: 1064B491
        Asset Tag: CPU1 DIMM D1_AssetTag
        Part Number: 36ASF2G72PZ-2G1A2  
        Rank: 2
        Configured Memory Speed: 2133 MT/s
        Minimum Voltage: Unknown
        Maximum Voltage: Unknown
        Configured Voltage: Unknown

Handle 0x0033, DMI type 17, 40 bytes
Memory Device
        Array Handle: 0x0031
        Error Information Handle: Not Provided
        Total Width: 72 bits
        Data Width: 64 bits
        Size: 16 GB
        Form Factor: RIMM
        Set: None
        Locator: CPU1 DIMM C1
        Bank Locator: A1_Node0_Channel2_Dimm1
        Type: DDR4
        Type Detail: Synchronous
        Speed: 2133 MT/s
        Manufacturer: Micron
        Serial Number: 10643A5B
        Asset Tag: CPU1 DIMM C1_AssetTag
        Part Number: 36ASF2G72PZ-2G1A2  
        Rank: 2
        Configured Memory Speed: 2133 MT/s
        Minimum Voltage: Unknown
        Maximum Voltage: Unknown
        Configured Voltage: Unknown


The marked in green are the banks of memory that are plugged in the server. The

field Speed: and Configured Memory Speed: are fields indicating respectively the Maximum speed on which a plugged-in RAM bank can operate and the the actual Speed the Linux kernel has it configured and uses is at.

It is useful for the admin to usually check the complete number of available RAM slots on a server, this can be done with command like:

root@server:~#  dmidecode –type 17 | grep -i Handle | grep 'DMI'|wc -l
16


As you can see at this specific case 16 Memory slots are avaiable (4 are already occupied and working configured on the machine at 2133 Mhz and 12 are empty and can have installed a memory banks in).


Perhaps the most interesting information for the RAM replacement to be ordered is to know the data communication SPEED on which the Memory is working on the server and interacting with Kernel and Processor to find out.

root@server:~#  dmidecode –type 17 | grep -i "speed"|grep -vi unknown
    Speed: 2400 MT/s
    Configured Memory Speed: 2133 MT/s
    Speed: 2400 MT/s
    Configured Memory Speed: 2133 MT/s
    Speed: 2133 MT/s
    Configured Memory Speed: 2133 MT/s
    Speed: 2133 MT/s
    Configured Memory Speed: 2133 MT/s


If you're lazy to remember the exact dmidecode memory type 17 you can use also memory keyword:

root@server:~# dmidecode –type memory | more

For servers that have the lshw command installed, a quick overview of RAM installed and Full slots available for memory placement can be done with:
 

root@server:~#  lshw -short -C memory
H/W path                 Device        Class          Description
=================================================================
/0/0                                   memory         64KiB BIOS
/0/29                                  memory         64GiB System Memory
/0/29/0                                memory         16GiB RIMM DDR4 Synchronous 2400 MHz (0.4 ns)
/0/29/1                                memory         RIMM DDR4 Synchronous [empty]
/0/29/2                                memory         16GiB RIMM DDR4 Synchronous 2400 MHz (0.4 ns)
/0/29/3                                memory         RIMM DDR4 Synchronous [empty]
/0/29/4                                memory         16GiB RIMM DDR4 Synchronous 2133 MHz (0.5 ns)
/0/29/5                                memory         RIMM DDR4 Synchronous [empty]
/0/29/6                                memory         16GiB RIMM DDR4 Synchronous 2133 MHz (0.5 ns)
/0/29/7                                memory         RIMM DDR4 Synchronous [empty]
/0/29/8                                memory         RIMM DDR4 Synchronous [empty]
/0/29/9                                memory         RIMM DDR4 Synchronous [empty]
/0/29/a                                memory         RIMM DDR4 Synchronous [empty]
/0/29/b                                memory         RIMM DDR4 Synchronous [empty]
/0/29/c                                memory         RIMM DDR4 Synchronous [empty]
/0/29/d                                memory         RIMM DDR4 Synchronous [empty]
/0/29/e                                memory         RIMM DDR4 Synchronous [empty]
/0/29/f                                memory         RIMM DDR4 Synchronous [empty]
/0/43                                  memory         768KiB L1 cache
/0/44                                  memory         3MiB L2 cache
/0/45                                  memory         30MiB L3 cache

Now once we know the exact model and RAM Serial and Part number you can google it online and to purchase more of the same RAM Model and Type you need so the installed memory work on the same Megaherzes as the installed ones.
 

How to monitor Haproxy Application server backends with Zabbix userparameter autodiscovery scripts

Friday, May 13th, 2022

zabbix-backend-monitoring-logo

Haproxy is doing quite a good job in High Availability tasks where traffic towards multiple backend servers has to be redirected based on the available one to sent data from the proxy to. 

Lets say haproxy is configured to proxy traffic for App backend machine1 and App backend machine2.

Usually in companies people configure a monitoring like with Icinga or Zabbix / Grafana to keep track on the Application server is always up and running. Sometimes however due to network problems (like burned Network Switch / router or firewall misconfiguration) or even an IP duplicate it might happen that Application server seems to be reporting reachable from some monotoring tool on it but unreachable from  Haproxy server -> App backend machine2 but reachable from App backend machine1. And even though haproxy will automatically switch on the traffic from backend machine2 to App machine1. It is a good idea to monitor and be aware that one of the backends is offline from the Haproxy host.
In this article I'll show you how this is possible by using 2 shell scripts and userparameter keys config through the autodiscovery zabbix legacy feature.
Assumably for the setup to work you will need to have as a minimum a Zabbix server installation of version 5.0 or higher.

1. Create the required  haproxy_discovery.sh  and haproxy_stats.sh scripts 

You will have to install the two scripts under some location for example we can put it for more clearness under /etc/zabbix/scripts

[root@haproxy-server1 ]# mkdir /etc/zabbix/scripts

[root@haproxy-server1 scripts]# vim haproxy_discovery.sh 
#!/bin/bash
#
# Get list of Frontends and Backends from HAPROXY
# Example: ./haproxy_discovery.sh [/var/lib/haproxy/stats] FRONTEND|BACKEND|SERVERS
# First argument is optional and should be used to set location of your HAPROXY socket
# Second argument is should be either FRONTEND, BACKEND or SERVERS, will default to FRONTEND if not set
#
# !! Make sure the user running this script has Read/Write permissions to that socket !!
#
## haproxy.cfg snippet
#  global
#  stats socket /var/lib/haproxy/stats  mode 666 level admin

HAPROXY_SOCK=""/var/run/haproxy/haproxy.sock
[ -n “$1” ] && echo $1 | grep -q ^/ && HAPROXY_SOCK="$(echo $1 | tr -d '\040\011\012\015')"

if [[ “$1” =~ (25[0-5]|2[0-4][0-9]|[01]?[0-9][0-9]?)\.(25[0-5]|2[0-4][0-9]|[01]?[0-9][0-9]?)\.(25[0-5]|2[0-4][0-9]|[01]?[0-9][0-9]?)\.(25[0-5]|2[0-4][0-9]|[01]?[0-9][0-9]?):[0-9]{1,5} ]];
then
    HAPROXY_STATS_IP="$1"
    QUERYING_METHOD="TCP"
fi

QUERYING_METHOD="${QUERYING_METHOD:-SOCKET}"

query_stats() {
    if [[ ${QUERYING_METHOD} == “SOCKET” ]]; then
        echo "show stat" | socat ${HAPROXY_SOCK} stdio 2>/dev/null
    elif [[ ${QUERYING_METHOD} == “TCP” ]]; then
        echo "show stat" | nc ${HAPROXY_STATS_IP//:/ } 2>/dev/null
    fi
}

get_stats() {
        echo "$(query_stats)" | grep -v "^#"
}

[ -n “$2” ] && shift 1
case $1 in
        B*) END="BACKEND" ;;
        F*) END="FRONTEND" ;;
        S*)
                for backend in $(get_stats | grep BACKEND | cut -d, -f1 | uniq); do
                        for server in $(get_stats | grep "^${backend}," | grep -v BACKEND | grep -v FRONTEND | cut -d, -f2); do
                                serverlist="$serverlist,\n"'\t\t{\n\t\t\t"{#BACKEND_NAME}":"'$backend'",\n\t\t\t"{#SERVER_NAME}":"'$server'"}'
                        done
                done
                echo -e '{\n\t"data":[\n’${serverlist#,}’]}'
                exit 0
        ;;
        *) END="FRONTEND" ;;
esac

for frontend in $(get_stats | grep "$END" | cut -d, -f1 | uniq); do
    felist="$felist,\n"'\t\t{\n\t\t\t"{#'${END}'_NAME}":"'$frontend'"}'
done
echo -e '{\n\t"data":[\n’${felist#,}’]}'


[root@haproxy-server1 scripts]# vim haproxy_stats.sh 
#!/bin/bash
set -o pipefail

if [[ “$1” = /* ]]
then
  HAPROXY_SOCKET="$1"
  shift 0
else
  if [[ “$1” =~ (25[0-5]|2[0-4][0-9]|[01]?[0-9][0-9]?)\.(25[0-5]|2[0-4][0-9]|[01]?[0-9][0-9]?)\.(25[0-5]|2[0-4][0-9]|[01]?[0-9][0-9]?)\.(25[0-5]|2[0-4][0-9]|[01]?[0-9][0-9]?):[0-9]{1,5} ]];
  then
    HAPROXY_STATS_IP="$1"
    QUERYING_METHOD="TCP"
    shift 1
  fi
fi

pxname="$1"
svname="$2"
stat="$3"

DEBUG=${DEBUG:-0}
HAPROXY_SOCKET="${HAPROXY_SOCKET:-/var/run/haproxy/haproxy.sock}"
QUERYING_METHOD="${QUERYING_METHOD:-SOCKET}"
CACHE_STATS_FILEPATH="${CACHE_STATS_FILEPATH:-/var/tmp/haproxy_stats.cache}"
CACHE_STATS_EXPIRATION="${CACHE_STATS_EXPIRATION:-1}" # in minutes
CACHE_INFO_FILEPATH="${CACHE_INFO_FILEPATH:-/var/tmp/haproxy_info.cache}" ## unused
CACHE_INFO_EXPIRATION="${CACHE_INFO_EXPIRATION:-1}" # in minutes ## unused
GET_STATS=${GET_STATS:-1} # when you update stats cache outsise of the script
SOCAT_BIN="$(which socat)"
NC_BIN="$(which nc)"
FLOCK_BIN="$(which flock)"
FLOCK_WAIT=15 # maximum number of seconds that "flock" waits for acquiring a lock
FLOCK_SUFFIX='.lock'
CUR_TIMESTAMP="$(date '+%s')"

debug() {
  [ “${DEBUG}” -eq 1 ] && echo "DEBUG: $@" >&2 || true
}

debug "SOCAT_BIN        => $SOCAT_BIN"
debug "NC_BIN           => $NC_BIN"
debug "FLOCK_BIN        => $FLOCK_BIN"
debug "FLOCK_WAIT       => $FLOCK_WAIT seconds"
debug "CACHE_FILEPATH   => $CACHE_FILEPATH"
debug "CACHE_EXPIRATION => $CACHE_EXPIRATION minutes"
debug "HAPROXY_SOCKET   => $HAPROXY_SOCKET"
debug "pxname   => $pxname"
debug "svname   => $svname"
debug "stat     => $stat"

# check if socat is available in path
if [ “$GET_STATS” -eq 1 ] && [[ $QUERYING_METHOD == “SOCKET” && -z “$SOCAT_BIN” ]] || [[ $QUERYING_METHOD == “TCP” &&  -z “$NC_BIN” ]]
then
  echo 'ERROR: cannot find socat binary'
  exit 126
fi

# if we are getting stats:
#   check if we can write to stats cache file, if it exists
#     or cache file path, if it does not exist
#   check if HAPROXY socket is writable
# if we are NOT getting stats:
#   check if we can read the stats cache file
if [ “$GET_STATS” -eq 1 ]
then
  if [ -e “$CACHE_FILEPATH” ] && [ ! -w “$CACHE_FILEPATH” ]
  then
    echo 'ERROR: stats cache file exists, but is not writable'
    exit 126
  elif [ ! -w ${CACHE_FILEPATH%/*} ]
  then
    echo 'ERROR: stats cache file path is not writable'
    exit 126
  fi
  if [[ $QUERYING_METHOD == “SOCKET” && ! -w $HAPROXY_SOCKET ]]
  then
    echo "ERROR: haproxy socket is not writable"
    exit 126
  fi
elif [ ! -r “$CACHE_FILEPATH” ]
then
  echo 'ERROR: cannot read stats cache file'
  exit 126
fi

# index:name:default
MAP="
1:pxname:@
2:svname:@
3:qcur:9999999999
4:qmax:0
5:scur:9999999999
6:smax:0
7:slim:0
8:stot:@
9:bin:9999999999
10:bout:9999999999
11:dreq:9999999999
12:dresp:9999999999
13:ereq:9999999999
14:econ:9999999999
15:eresp:9999999999
16:wretr:9999999999
17:wredis:9999999999
18:status:UNK
19:weight:9999999999
20:act:9999999999
21:bck:9999999999
22:chkfail:9999999999
23:chkdown:9999999999
24:lastchg:9999999999
25:downtime:0
26:qlimit:0
27:pid:@
28:iid:@
29:sid:@
30:throttle:9999999999
31:lbtot:9999999999
32:tracked:9999999999
33:type:9999999999
34:rate:9999999999
35:rate_lim:@
36:rate_max:@
37:check_status:@
38:check_code:@
39:check_duration:9999999999
40:hrsp_1xx:@
41:hrsp_2xx:@
42:hrsp_3xx:@
43:hrsp_4xx:@
44:hrsp_5xx:@
45:hrsp_other:@
46:hanafail:@
47:req_rate:9999999999
48:req_rate_max:@
49:req_tot:9999999999
50:cli_abrt:9999999999
51:srv_abrt:9999999999
52:comp_in:0
53:comp_out:0
54:comp_byp:0
55:comp_rsp:0
56:lastsess:9999999999
57:last_chk:@
58:last_agt:@
59:qtime:0
60:ctime:0
61:rtime:0
62:ttime:0
"

_STAT=$(echo -e "$MAP" | grep :${stat}:)
_INDEX=${_STAT%%:*}
_DEFAULT=${_STAT##*:}

debug "_STAT    => $_STAT"
debug "_INDEX   => $_INDEX"
debug "_DEFAULT => $_DEFAULT"

# check if requested stat is supported
if [ -z “${_STAT}” ]
then
  echo "ERROR: $stat is unsupported"
  exit 127
fi

# method to retrieve data from haproxy stats
# usage:
# query_stats "show stat"
query_stats() {
    if [[ ${QUERYING_METHOD} == “SOCKET” ]]; then
        echo $1 | socat ${HAPROXY_SOCKET} stdio 2>/dev/null
    elif [[ ${QUERYING_METHOD} == “TCP” ]]; then
        echo $1 | nc ${HAPROXY_STATS_IP//:/ } 2>/dev/null
    fi
}

# a generic cache management function, that relies on 'flock'
check_cache() {
  local cache_type="${1}"
  local cache_filepath="${2}"
  local cache_expiration="${3}"  
  local cache_filemtime
  cache_filemtime=$(stat -c '%Y' "${cache_filepath}" 2> /dev/null)
  if [ $((cache_filemtime+60*cache_expiration)) -ge ${CUR_TIMESTAMP} ]
  then
    debug "${cache_type} file found, results are at most ${cache_expiration} minutes stale.."
  elif "${FLOCK_BIN}" –exclusive –wait "${FLOCK_WAIT}" 200
  then
    cache_filemtime=$(stat -c '%Y' "${cache_filepath}" 2> /dev/null)
    if [ $((cache_filemtime+60*cache_expiration)) -ge ${CUR_TIMESTAMP} ]
    then
      debug "${cache_type} file found, results have just been updated by another process.."
    else
      debug "no ${cache_type} file found, querying haproxy"
      query_stats "show ${cache_type}" > "${cache_filepath}"
    fi
  fi 200> "${cache_filepath}${FLOCK_SUFFIX}"
}

# generate stats cache file if needed
get_stats() {
  check_cache 'stat' "${CACHE_STATS_FILEPATH}" ${CACHE_STATS_EXPIRATION}
}

# generate info cache file
## unused at the moment
get_info() {
  check_cache 'info' "${CACHE_INFO_FILEPATH}" ${CACHE_INFO_EXPIRATION}
}

# get requested stat from cache file using INDEX offset defined in MAP
# return default value if stat is ""
get() {
  # $1: pxname/svname
  local _res="$("${FLOCK_BIN}" –shared –wait "${FLOCK_WAIT}" "${CACHE_STATS_FILEPATH}${FLOCK_SUFFIX}" grep $1 "${CACHE_STATS_FILEPATH}")"
  if [ -z “${_res}” ]
  then
    echo "ERROR: bad $pxname/$svname"
    exit 127
  fi
  _res="$(echo $_res | cut -d, -f ${_INDEX})"
  if [ -z “${_res}” ] && [[ “${_DEFAULT}” != “@” ]]
  then
    echo "${_DEFAULT}"  
  else
    echo "${_res}"
  fi
}

# not sure why we'd need to split on backslash
# left commented out as an example to override default get() method
# status() {
#   get "^${pxname},${svnamem}," $stat | cut -d\  -f1
# }

# this allows for overriding default method of getting stats
# name a function by stat name for additional processing, custom returns, etc.
if type get_${stat} >/dev/null 2>&1
then
  debug "found custom query function"
  get_stats && get_${stat}
else
  debug "using default get() method"
  get_stats && get "^${pxname},${svname}," ${stat}
fi


! NB ! Substitute in the script /var/run/haproxy/haproxy.sock with your haproxy socket location

You can download the haproxy_stats.sh here and haproxy_discovery.sh here

2. Create the userparameter_haproxy_backend.conf

[root@haproxy-server1 zabbix_agentd.d]# cat userparameter_haproxy_backend.conf 
#
# Discovery Rule
#

# HAProxy Frontend, Backend and Server Discovery rules
UserParameter=haproxy.list.discovery[*],sudo /etc/zabbix/scripts/haproxy_discovery.sh SERVER
UserParameter=haproxy.stats[*],sudo /etc/zabbix/scripts/haproxy_stats.sh  $2 $3 $4

# support legacy way

UserParameter=haproxy.stat.downtime[*],sudo /etc/zabbix/scripts/haproxy_stats.sh  $2 $3 downtime

UserParameter=haproxy.stat.status[*],sudo /etc/zabbix/scripts/haproxy_stats.sh  $2 $3 status

UserParameter=haproxy.stat.last_chk[*],sudo /etc/zabbix/scripts/haproxy_stats.sh  $2 $3 last_chk


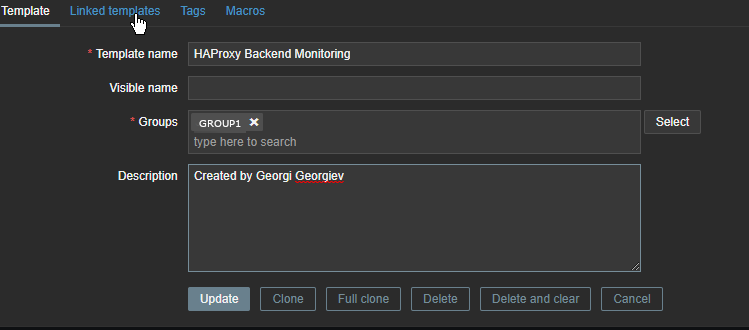
3. Create new simple template for the Application backend Monitoring and link it to monitored host

create-configuration-template-backend-monitoring

create-template-backend-monitoring-macros


Go to Configuration -> Hosts (find the host) and Link the template to it


4. Restart Zabbix-agent, in while check autodiscovery data is in Zabbix Server

[root@haproxy-server1 ]# systemctl restart zabbix-agent


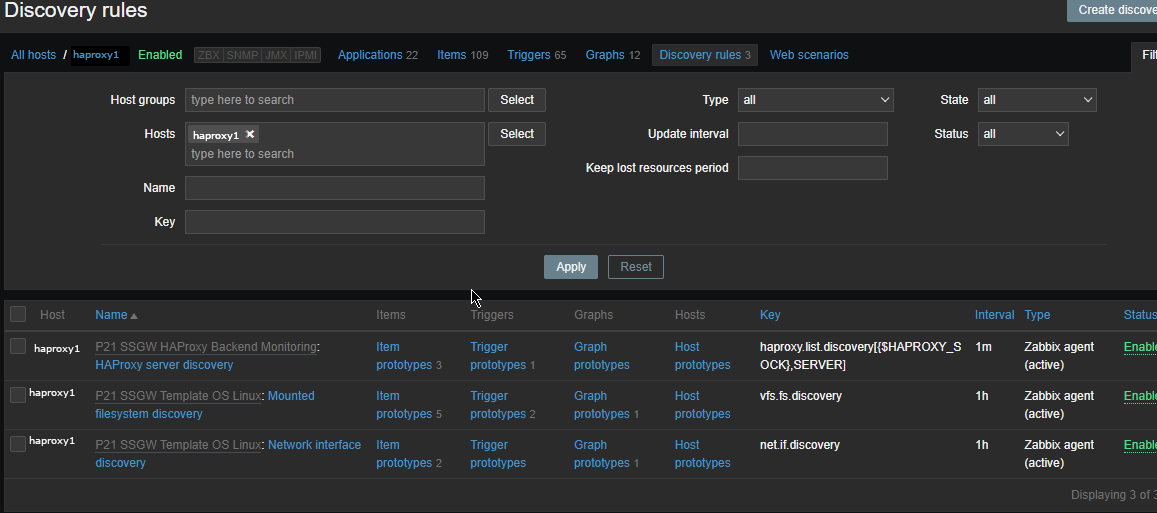
Check in zabbix the userparameter data arrives, it should not be required to add any Items or Triggers as autodiscovery zabbix feature should automatically create in the server what is required for the data regarding backends to be in.

To view data arrives go to Zabbix config menus:

Configuration -> Hosts -> Hosts: (lookup for the haproxy-server1 hostname)

zabbix-discovery_rules-screenshot

The autodiscovery should have automatically created the following prototypes

zabbix-items-monitoring-prototypes
Now if you look inside Latest Data for the Host you should find some information like:

HAProxy Backend [backend1] (3 Items)
        
HAProxy Server [backend-name_APP/server1]: Connection Response
2022-05-13 14:15:04            History
        
HAProxy Server [backend-name/server2]: Downtime (hh:mm:ss)
2022-05-13 14:13:57    20:30:42        History
        
HAProxy Server [bk_name-APP/server1]: Status
2022-05-13 14:14:25    Up (1)        Graph
        ccnrlb01    HAProxy Backend [bk_CCNR_QA_ZVT] (3 Items)
        
HAProxy Server [bk_name-APP3/server1]: Connection Response
2022-05-13 14:15:05            History
        
HAProxy Server [bk_name-APP3/server1]: Downtime (hh:mm:ss)
2022-05-13 14:14:00    20:55:20        History
        
HAProxy Server [bk_name-APP3/server2]: Status
2022-05-13 14:15:08    Up (1)

To make alerting in case if a backend is down which usually you would like only left thing is to configure an Action to deliver alerts to some email address.

How to disable Windows pagefile.sys and hiberfil.sys to temporary or permamently save disk space if space is critically low

Monday, March 28th, 2022

howto-pagefile-hiberfil.sys-remove-reduce-increase-increase-size-windows-logo

Sometimes you have to work with Windows 7 / 8 / 10 PCs  etc. that has a very small partition C:\
drive or othertimes due to whatever the disk got filled up with time and has only few megabytes left
and this totally broke up the windows performance as Windows OS becomes terribly sluggish and even
simple things as opening Internet Browser (Chrome / Firefox / Opera ) or Windows Explorer stones the PC performance.

You might of course try to use something like Spacesniffer tool (a great tool to find lost data space on PC s short description on it is found in my previous article how to
delete temporary Internet Files and Folders to to speed up and free disk space
 ) or use CCleaner to clean up a bit the pc.
Sometimes this is not enough though or it is not possible to do at all the main
partition disk C:\ is anyhow too much low (only 30-50MB are available on HDD) or the Physical or Virtual Machine containing the OS is filled with important data
and you couldn't risk to remove anything including Internet Temporary files, browsing cookies … whatever.

Lets say you are the fate chosen guy as sysadmin to face this uneasy situation and have no easy
way to add disk space from another present free space partition or could not add a new SATA hard drive
SSD drive, what should you do?
 

The solution wipe off pagefile.sys and hiberfil.sys

Usually every Windows installation has a pagefile.sys and hiberfil.sys.

  • pagefile.sys – is the default file that is used as a swap file, immediately once the machine runs out of memory. For Unix / Linux users better understanding pagefile.sys is the equivallent of Linux's swap partition. Of course as the pagefile is in a file and not in separate partition the swapping in Windows is perhaps generally worse than in Linux.
  • hiberfil.sys – is used to store data from the machine on machine Hibernation (for those who use the feature)


Pagefile.sys which depending on the configured RAM memory on the OS could takes up up to 5 – 8 GB, there hanging around doing nothing but just occupying space. Thus a temporary workaround that could free you some space even though it will degrade performance and on servers and production machines this is not a good solution on just user machines, where you temporary need to free space any other important task you can free up space
by seriously reducing the preconfigured default size of pagefile.sys (which usually is 1.5 times the active memory on the OS – hence if you have 4GB you would have a 6Gigabytes of pagefile.sys).

Other possibility especially on laptop and movable devices running Win OS is to disable hiberfil.sys, read below how this is done.


The temporary solution here is to simply free space by either reducing the pagefile.sys or completely disabling it


1. Disable pagefile.sys on Windows XP, Windows 7 / 8 / 10 / 11


The GUI interface to disable pagefile across all NT based Windows OS-es is quite similar, the only difference is newer versions of Windows has slightly more options.


1.1 Disable pagefile on Windows XP


Quickest way is to find pagefile.sys settings from GUI menus

1. Computer (My Computer) – right click mouse
2. Properties (System Preperties will appear)
3. Advanced (tab) 
4. Settings
5. Advanced (tab)
6. Change button

windows-xp-pagefile-disable-screenshot

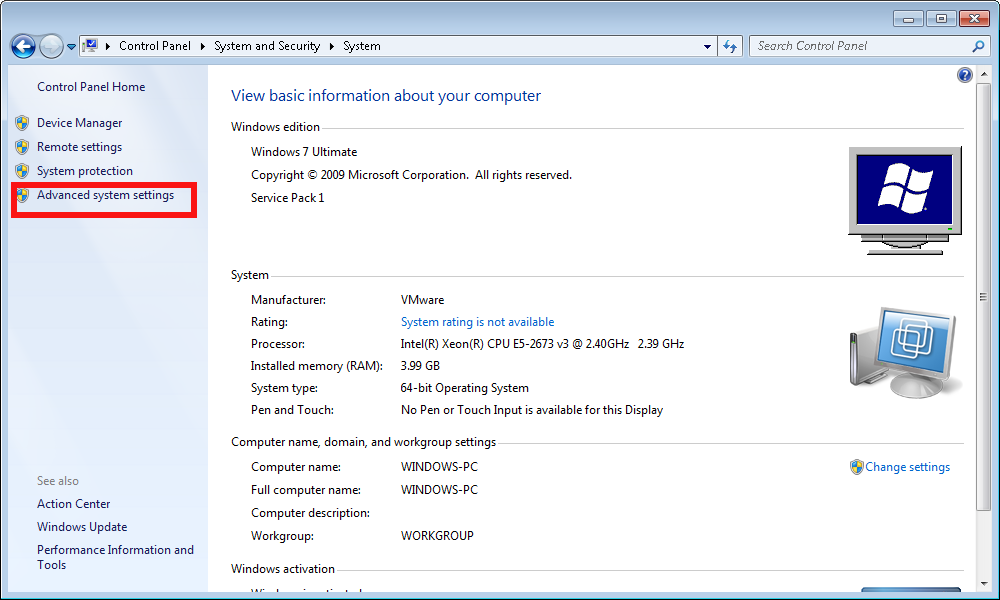
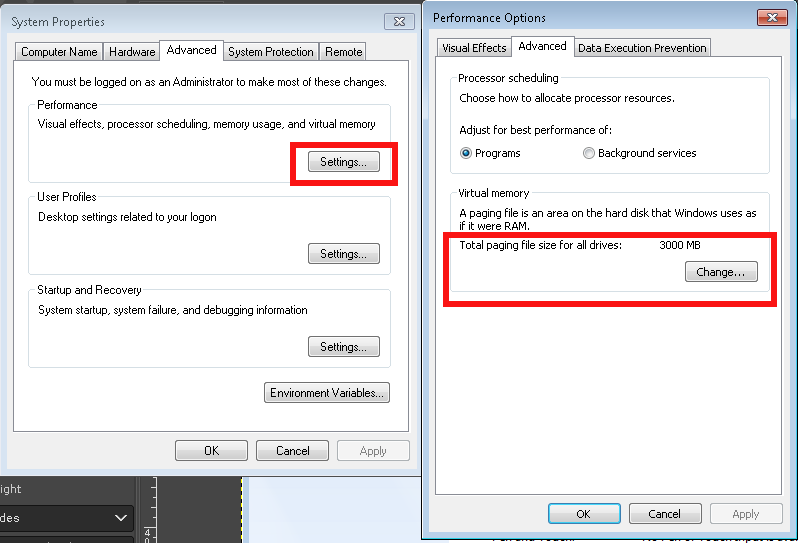
1.2 Disable pagefile on Windows 7


advanced-system-settings-control-panel-system-and-security-screenshot

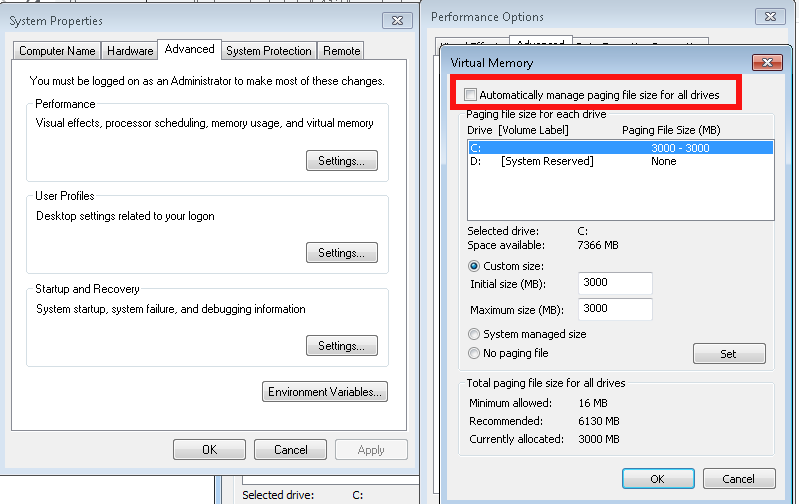
windows-system-properties-screenshot-properties-advanced-change-Virtual-memory-pagefile-screenshot

system-properties-performance-options
 

Once applied you'll be required to reboot the PC

How-to-turn-off-Virtual-Memory-Paging_File-in-Windows-7-restart


1.3 Disable Increase / Decrease pagefile.sys on Windows 10 / Win 11
 

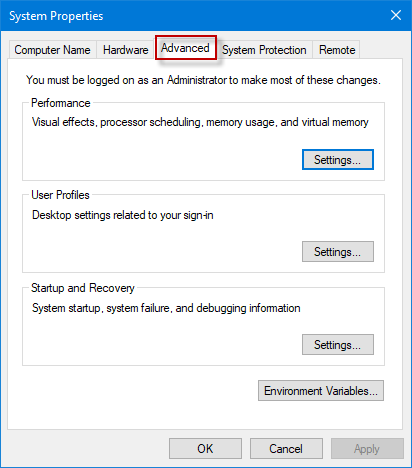
open-system-properties-advanced-win10

win10-performance-options-menu-screenshot

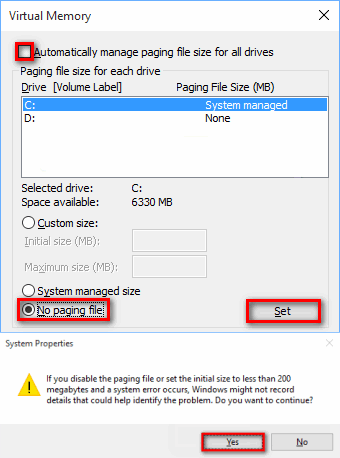
configure-virtual-memory-win-10-screenshot


1.4 Make Windows clear pagefile.sys on shutdown

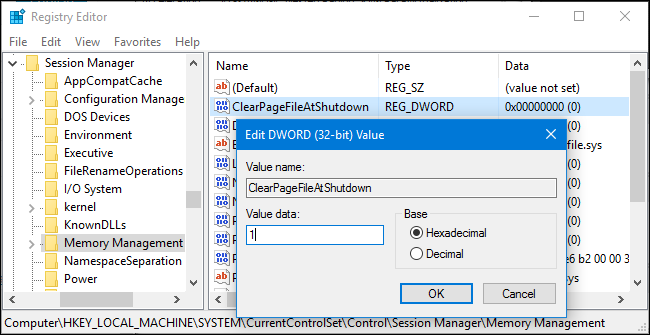
On home PCs it might be useful thing to clear up ( nullify) pagefile.sys on shutdown, that could save you some disk space on every reboot, until file continuously grows to its configured Maximum.

Run

regedit

Modify registry key at location


HKEY_LOCAL_MACHINE\SYSTEM\CurrentControlSet\Control\Session Manager\Memory Management

windows-clean-up-pagefile-sys-file-on-shutdown-or-reboot-registry-editor-value-screenshot

You can apply the value also via a registry file you can get the Enable Clearpagefile at shutdown here .reg.
 

2. Manipulating pagefile.sys size and file delete from command line with wmic tool 

For scripting purposes you might want to use the wmic pagefile which can do increase / decrase or delete the file without GUI, that is very helpful if you have to admin a Windows Domain (Active Directory)
 

[hipo.WINDOWS-PC] ➤ wmic pagefile /?

PAGEFILE – Virtual memory file swapping management.

HINT: BNF for Alias usage.
(<alias> [WMIObject] | [] | [] ) [].

USAGE:

PAGEFILE ASSOC []
PAGEFILE CREATE <assign list>
PAGEFILE DELETE
PAGEFILE GET [] []
PAGEFILE LIST [] []


[hipo.WINDOWS-PC] ➤ wmic pagefile
AllocatedBaseSize  Caption          CurrentUsage  Description      InstallDate                Name             PeakUsage  Status  TempPageFile
4709               C:\pagefile.sys  499           C:\pagefile.sys  20200912061902.938000+180  C:\pagefile.sys  525                FALSE


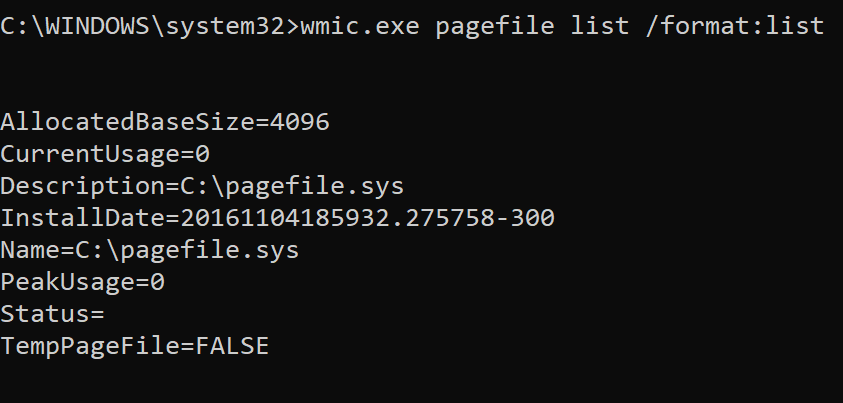
[hipo.WINDOWS-PC] ➤ wmic pagefile list /format:list

AllocatedBaseSize=4709
CurrentUsage=499
Description=C:\pagefile.sys
InstallDate=20200912061902.938000+180
Name=C:\pagefile.sys
PeakUsage=525
Status=
TempPageFile=FALSE

wmic-pagefile-command-line-tool-for-windows-default-output-screenshot


  • To change the Initial Size or Maximum Size of Pagefile use:
     

➤ wmic pagefileset where name="C:\\pagefile.sys" set InitialSize=2048,MaximumSize=2048

  • To move the pagefile / change location of pagefile to less occupied disk drive partition (i.e. D:\ drive)


    Sometimes you might have multiple drives on the PC and some of them might be having multitudes of gigabytes while main drive C:\ could be fully occupied due to initial install bad drive organization, in that case a good work arount to save you space so you can work normally with the server is just to temporary or permanently move pagefile to another drive.

wmic pagefileset where name="D:\\pagefile.sys" set InitialSize=2048,MaximumSize=2048


!! CONSIDER !!! 

That if you have the option to move the pagefile.sys for best performance it is advicable to place the file inside another physical disk, preferrably a Solid State Drive one, SATA disks are too slow and reduced Input / Output disk operations will lead to degraded performance, if there is lack of memory (i.e. pagefile.sys is actively open read and wrote in).
 

  • To delete pagefile.sys 
     

➤ wmic pagefileset where name="C:\\pagefile.sys" delete


If for some reason you prefer to not use wmic but simple del command you can delete pagefile.sys also by:

Removing file default "Hidden" and "system" file attributes – set for security reasons as the file is a system file usually not touched by user. This will save you from "permission denied" errors:
 

➤ attrib -s -h %systemdrive%\pagefile.sys


Delete the file:
 

➤ del /a /q %systemdrive%\pagefile.sys


3. Disable hibernation on Windows 7 / 8 and Win 10 / 11

Disabling hibernation file hiberfil.sys can also free up some space, especially if the hibernation has been actively used before and the file is written with data. Of course, that is more common on notebooks.
Windows hibernation has significantly improved over time though i didn't have very pleasant experience in the past and I prefer to disable it just in case.
 

3.1 Disable Windows 7 / 8 / 10 / 11 hibernation from GUI 

Disable it through:

Control Panel -> All Control Panel Items -> Power Options -> Edit Plan Settings -> Change advanced power settings


 like shown in below screenshot:

Windqows-power-options-Advanced-settings-Allow-Hybrid-sleep-option-menu-screenshot


3.2 Disable Windows 7 / 8 / 10 / 11 hibernation from command line

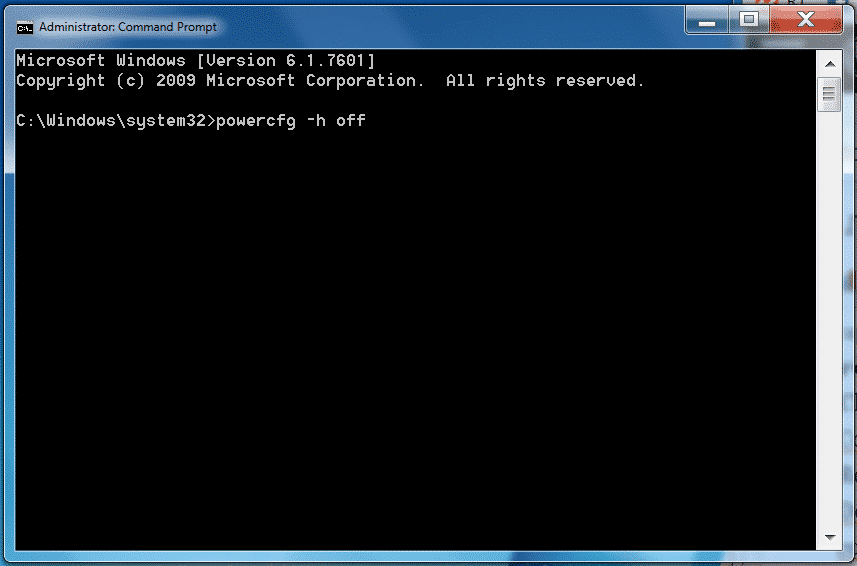
Disable hibernation Is done in the same way through the powercfg.exe command, to disable it
if you're cut of disk space and you want to save space from it:

run as Administrator in Command Line Windows (cmd.exe)
 

powercfg.exe /hibernate off

If you later need to switch on hibernation
 

powercfg.exe /hibernate on


disable-hiberfile-windows-screenshot

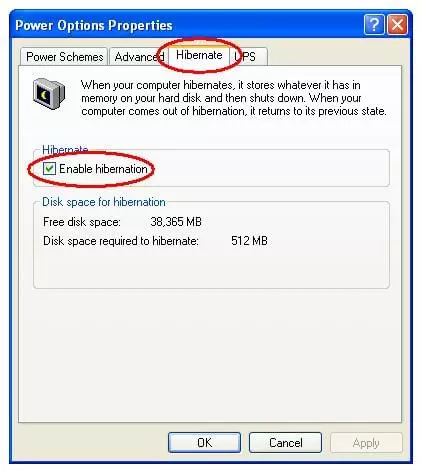
3.3 Disable Windows hibernation on legacy Windows XP

On XP to disable hibernation open

1. Power Options Properties
2. Select Hibernate
3. Select Enable Hibernation to clear the checkbox and disable Hibernation mode. 
4. Select OK to apply the change.

Close the Power Options Properties box. 

enable-disable-hibernate-windows-xp-menu-screenshot

To sum it up

We have learned some basics on Windows swapping and hibernation and i've tried to give some insight on how thiese files if misconfigured could lead to degraded Win OS performance. In any case using SSD as of 2022 to store both files is a best practice for machines that has plenty of memory always try to completely disable / remove the files. It was shown how  to manage pagefile.sys and hiberfil.sys across Windows Operating Systems different versions both from GUI and via command line as well as how you can configure pagefile.sys to be cleared up on pc reboot.
 

Apache disable requests to not log to access.log Logfile through SetEnvIf and dontlog httpd variables

Monday, October 11th, 2021

apache-disable-certain-strings-from-logging-to-access-log-logo

Logging to Apache access.log is mostly useful as this is a great way to keep log on who visited your website and generate periodic statistics with tools such as Webalizer or Astats to keep track on your visitors and generate various statistics as well as see the number of new visitors as well most visited web pages (the pages which mostly are attracting your web visitors), once the log analysis tool generates its statistics, it can help you understand better which Web spiders visit your website the most (as spiders has a predefined) IP addresses, which can give you insight on various web spider site indexation statistics on Google, Yahoo, Bing etc. . Sometimes however either due to bugs in web spiders algorithms or inconsistencies in your website structure, some of the web pages gets double visited records inside the logs, this could happen for example if your website uses to include iframes.

Having web pages accessed once but logged to be accessed twice hence is erroneous and unwanted, and though that usually have to be fixed by the website programmers, if such approach is not easily doable in the moment and the website is running on critical production system, the double logging of request can be omitted thanks to a small Apache log hack with SetEnvIf Apache config directive. Even if there is no double logging inside Apache log happening it could be that some cron job or automated monitoring scripts or tool such as monit is making periodic requests to Apache and this is garbling your Log Statistics results.

In this short article hence I'll explain how to do remove certain strings to not get logged inside /var/log/httpd/access.log.

1. Check SetEnvIf is Loaded on the Webserver
 

On CentOS / RHEL Linux:

# /sbin/apachectl -M |grep -i setenvif
AH00558: httpd: Could not reliably determine the server's fully qualified domain name, using localhost.localdomain. Set the 'ServerName' directive globally to suppress this message
 setenvif_module (shared)


On Debian / Ubuntu Linux:

/usr/sbin/apache2ctl -M |grep -i setenvif
AH00548: NameVirtualHost has no effect and will be removed in the next release /etc/apache2/sites-enabled/000-default.conf:1
 setenvif_module (shared)


2. Using SetEnvIf to omit certain string to get logged inside apache access.log


SetEnvIf could be used either in some certain domain VirtualHost configuration (if website is configured so), or it can be set as a global Apache rule from the /etc/httpd/conf/httpd.conf 

To use SetEnvIf  you have to place it inside a <Directory …></Directory> configuration block, if it has to be enabled only for a Certain Apache configured directory, otherwise you have to place it in the global apache config section.

To be able to use SetEnvIf, only in a certain directories and subdirectories via .htaccess, you will have defined in <Directory>

AllowOverride FileInfo


The general syntax to omit a certain Apache repeating string from keep logging with SetEnvIf is as follows:
 

SetEnvIf Request_URI "^/WebSiteStructureDirectory/ACCESS_LOG_STRING_TO_REMOVE$" dontlog


General syntax for SetEnvIf is as follows:

SetEnvIf attribute regex env-variable

SetEnvIf attribute regex [!]env-variable[=value] [[!]env-variable[=value]] …

Below is the overall possible attributes to pass as described in mod_setenvif official documentation.
 

  • Host
  • User-Agent
  • Referer
  • Accept-Language
  • Remote_Host: the hostname (if available) of the client making the request.
  • Remote_Addr: the IP address of the client making the request.
  • Server_Addr: the IP address of the server on which the request was received (only with versions later than 2.0.43).
  • Request_Method: the name of the method being used (GET, POST, etc.).
  • Request_Protocol: the name and version of the protocol with which the request was made (e.g., "HTTP/0.9", "HTTP/1.1", etc.).
  • Request_URI: the resource requested on the HTTP request line – generally the portion of the URL following the scheme and host portion without the query string.

Next locate inside the configuration the line:

CustomLog /var/log/apache2/access.log combined


To enable filtering of included strings, you'll have to append env=!dontlog to the end of line.


CustomLog /var/log/apache2/access.log combined env=!dontlog


You might be using something as cronolog for log rotation to prevent your WebServer logs to become too big in size and hard to manage, you can append env=!dontlog to it in same way.

If you haven't used cronolog is it is perhaps best to show you the package description.

server:~# apt-cache show cronolog|grep -i description -A10 -B5
Version: 1.6.2+rpk-2
Installed-Size: 63
Maintainer: Debian QA Group <packages@qa.debian.org>
Architecture: amd64
Depends: perl:any, libc6 (>= 2.4)
Description-en: Logfile rotator for web servers
 A simple program that reads log messages from its input and writes
 them to a set of output files, the names of which are constructed
 using template and the current date and time.  The template uses the
 same format specifiers as the Unix date command (which are the same
 as the standard C strftime library function).
 .
 It intended to be used in conjunction with a Web server, such as
 Apache, to split the access log into daily or monthly logs:
 .
   TransferLog "|/usr/bin/cronolog /var/log/apache/%Y/access.%Y.%m.%d.log"
 .
 A cronosplit script is also included, to convert existing
 traditionally-rotated logs into this rotation format.

Description-md5: 4d5734e5e38bc768dcbffccd2547922f
Homepage: http://www.cronolog.org/
Tag: admin::logging, devel::lang:perl, devel::library, implemented-in::c,
 implemented-in::perl, interface::commandline, role::devel-lib,
 role::program, scope::utility, suite::apache, use::organizing,
 works-with::logfile
Section: web
Priority: optional
Filename: pool/main/c/cronolog/cronolog_1.6.2+rpk-2_amd64.deb
Size: 27912
MD5sum: 215a86766cc8d4434cd52432fd4f8fe7

If you're using cronolog to daily rotate the access.log and you need to filter out the strings out of the logs, you might use something like in httpd.conf:


CustomLog "|/usr/bin/cronolog –symlink=/var/log/httpd/access.log /var/log/httpd/access.log_%Y_%m_%d" combined env=!dontlog


3. Disable Apache logging access.log from certain USERAGENT browser
 

You can do much more with SetEnvIf for example you might want to omit logging requests from a UserAgent (browser) to end up in /dev/null (nowhere), e.g. prevent any Website requests originating from Internet Explorer (MSIE) to not be logged.

SetEnvIf User_Agent "(MSIE)" dontlog

CustomLog /var/log/apache2/access.log combined env=!dontlog


4. Disable Apache logging from requests coming from certain FQDN (Fully Qualified Domain Name) localhost 127.0.0.1 or concrete IP / IPv6 address

SetEnvIf Remote_Host "dns.server.com$" dontlog

CustomLog /var/log/apache2/access.log combined env=!dontlog


Of course for this to work, your website should have a functioning DNS servers and Apache should be configured to be able to resolve remote IPs to back resolve to their respective DNS defined Hostnames.

SetEnvIf recognized also perl PCRE Regular Expressions, if you want to filter out of Apache access log requests incoming from multiple subdomains starting with a certain domain hostname.


SetEnvIf Remote_Host "^example" dontlog

– To not log anything coming from localhost.localdomain address ( 127.0.0.1 ) as well as from some concrete IP address :

SetEnvIf Remote_Addr "127\.0\.0\.1" dontlog

SetEnvIf Remote_Addr "192\.168\.1\.180" dontlog

– To disable IPv6 requests that be coming at the log even though you don't happen to use IPv6 at all

SetEnvIf Request_Addr "::1" dontlog

CustomLog /var/log/apache2/access.log combined env=!dontlog


– Note here it is obligatory to escape the dots '.'


5. Disable robots.txt Web Crawlers requests from being logged in access.log

SetEnvIf Request_URI "^/robots\.txt$" dontlog

CustomLog /var/log/apache2/access.log combined env=!dontlog

Using SetEnvIfNoCase to read incoming useragent / Host / file requests case insensitve

The SetEnvIfNoCase is to be used if you want to threat incoming originators strings as case insensitive, this is useful to omit extraordinary regular expression SetEnvIf rules for lower upper case symbols.

SetEnvIFNoCase User-Agent "Slurp/cat" dontlog
SetEnvIFNoCase User-Agent "Ask Jeeves/Teoma" dontlog
SetEnvIFNoCase User-Agent "Googlebot" dontlog
SetEnvIFNoCase User-Agent "bingbot" dontlog
SetEnvIFNoCase Remote_Host "fastsearch.net$" dontlog

Omit from access.log logging some standard web files .css , .js .ico, .gif , .png and Referrals from own domain

Sometimes your own site scripts do refer to stuff on your own domain that just generates junks in the access.log to keep it off.

SetEnvIfNoCase Request_URI "\.(gif)|(jpg)|(png)|(css)|(js)|(ico)|(eot)$" dontlog


SetEnvIfNoCase Referer "www\.myowndomain\.com" dontlog

CustomLog /var/log/apache2/access.log combined env=!dontlog


6. Disable Apache requests in access.log and error.log completely


Sometimes at rare cases the produced Apache logs and error log is really big and you already have the requests logged in another F5 Load Balancer or Haproxy in front of Apache WebServer or alternatively the logging is not interesting at all as the Web Application served written in ( Perl / Python / Ruby ) does handle the logging itself. 
I've earlier described how this is done in a good amount of details in previous article Disable Apache access.log and error.log logging on Debian Linux and FreeBSD

To disable it you will have to comment out CustomLog or set it to together with ErrorLog to /dev/null in apache2.conf / httpd.conf (depending on the distro)
 

CustomLog /dev/null
ErrorLog /dev/null


7. Restart Apache WebServer to load settings
 

An important to mention is in case you have Webserver with multiple complex configurations and there is a specific log patterns to omit from logs it might be a very good idea to:

a. Create /etc/httpd/conf/dontlog.conf / etc/apache2/dontlog.conf
add inside all your custom dontlog configurations
b. Include dontlog.conf from /etc/httpd/conf/httpd.conf / /etc/apache2/apache2.conf

Finally to make the changes take affect, of course you will need to restart Apache webserver depending on the distro and if it is with systemd or System V:

For systemd RPM based distro:

systemctl restart httpd

or for Deb based Debian etc.

systemctl apache2 restart

On old System V scripts systems:

On RedHat / CentOS etc. restart Apache with:
 

/etc/init.d/httpd restart


On Deb based SystemV:
 

/etc/init.d/apache2 restart


What we learned ?
 

We have learned about SetEnvIf how it can be used to prevent certain requests strings getting logged into access.log through dontlog, how to completely stop certain browser based on a useragent from logging to the access.log as well as how to omit from logging certain requests incoming from certain IP addresses / IPv6 or FQDNs and how to stop robots.txt from being logged to httpd log.


Finally we have learned how to completely disable Apache logging if logging is handled by other external application.
 

Change Windows 10 default lock screen image via win registry LockScreenImage key change

Tuesday, September 21st, 2021

fix-lock-screen-missing-change-option-on-windows-10-windows-registry-icon

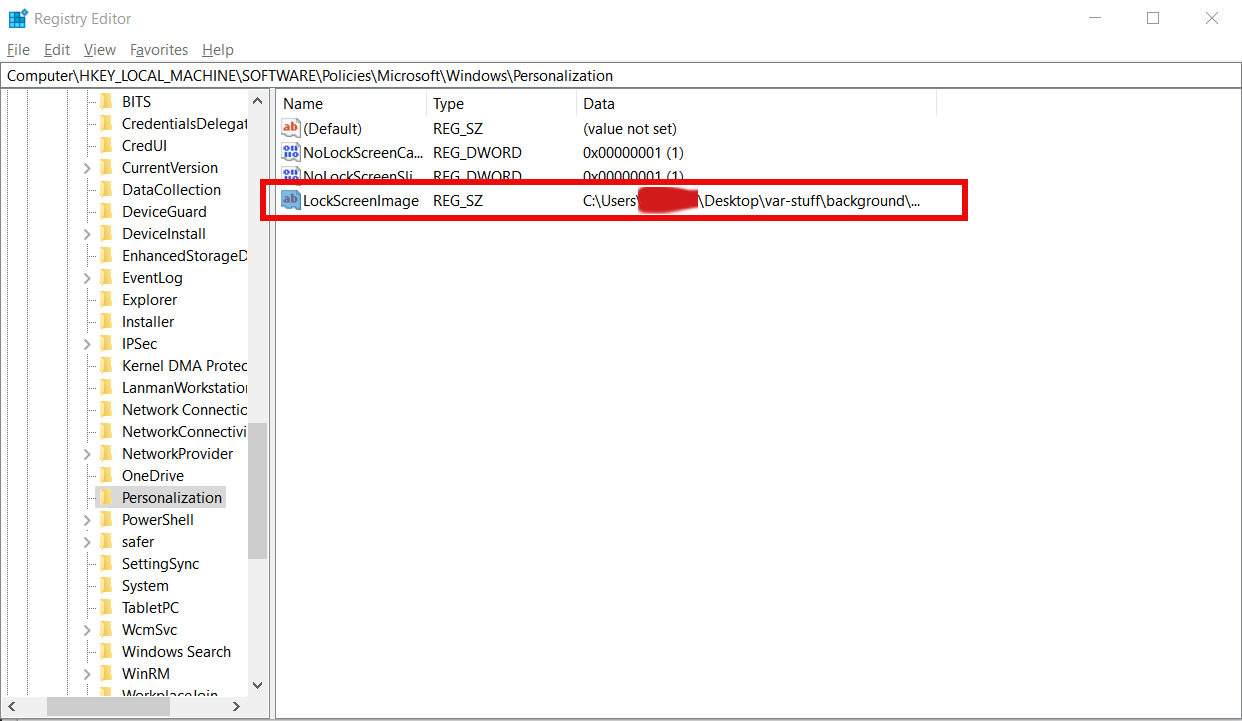
If you do work for a corporation on a Windows machine that is part of Windows Active Directory domain or a Microsoft 365 environment and your Domain admimistrator after some of the scheduled updates. Has enforced a Windows lock screen image change.
You  might be surprised to have some annoying corporation logo picture shown as a default Lock Screen image on your computer on next reoboot. Perhaps for some people it doesn't matter but for as a person who seriously like customizations, and a valuer of
freedom having an enforced picture logo each time I press CTRL + L (To lock my computer) is really annoying.

The logical question hence was how to reverse my desired image as  a default lock screen to enkoy. Some would enjoy some relaxing picture of a Woods, Cave or whatever Natural place landscape. I personally prefer simplicity so I simply use a simple purely black
background.

To do it you'll have anyways to have some kind of superuser access to the computer. At the company I'm epmloyeed, it is possible to temporary request Administrator access this is done via a software installed on the machine. So once I request it I become
Administratof of machine for 20 minutes. In that time I do used a 'Run as Administartor' command prompt cmd.exe and inside Windows registry do the following Registry change.

The first logical thing to do is to try to manually set the picture via:
 

Settings ->  Lock Screen

But unfortunately as you can see in below screenshot, there was no way to change the LockScreen background image.

Windows-settings-lockscreen-screenshot

In Windows Registry Editor

I had to go to registry path


[HKEY_LOCAL_MACHINE\SOFTWARE\Policies\Microsoft\Windows\.]

And from there in create a new "String Value" key
 

"LockScreenImage"


so full registry key path should be equal to:


[HKEY_LOCAL_MACHINE\SOFTWARE\Policies\Microsoft\Windows\Personalization\LockScreenImage]"

The value to set is:

C:\Users\a768839\Desktop\var-stuff\background\Desired-background-picture.jpg

windows-registry-change-lock-screen-background-picture-from-registry-screenshot

If you want to set a black background picture for LockScreen like me you can download my black background picture from here.

That's all press CTRL + L  key combination and the black screen background lock screen picture will appear !

Hopefully the Domain admin, would not soon enforce some policty to update the registry keys or return your old registry database from backup if something crashs out with something strange to break just set configuration.

To test whether the setting will stay permanent after the next scheduled Windows PC update of policies enforced by the Active Directory (AD) sysadmin, run manually from CMD.EXE

C:\> gpupdate /force


The command will download latest policies from Windows Domain, try to lock the screen once again with Control + L, if the background picture is still there most likely the Picture change would stay for a long.
If you get again the corporation preset domain background instead,  you're out of luck and will have to follow the same steps every, now and then after a domani policy update.

Enjoy your new smooth LockScreen Image 🙂


Christ is Risen – Truly He is Risen – Happy Easter !

Tuesday, May 4th, 2021

admin

One more year the Holy Fire has descended and we have been blessed to great Each other with the All Joyful Paschal Greeting !

Христос възкресе! Воистина възкресе! (Hristos vozkrese! Voistina vozkrese!)


Христос Воскресе – Воистину Воскресе! Христос възкресе! Воистина възкресе! (Hristos vozkrese! Voistina vozkrese!)
Христос васкрсе! Ваистину васкрсе! (Hristos vaskrse! Vaistinu vaskrse!)
Χριστὸς ἀνέστη! Ἀληθῶς ἀνέστη! 

Christus ist auferstanden! Er ist wahrhaftig auferstanden!Christ is Risen ! Truly He is Risen !

For complete list of Paschal Greeting as a referrence to get idea how other weird languages sound like and how it is used in the major Eastern Orthodox Churches all around the world check out my previous article Christ is Risen Eastern Orthodox Resurrection Paschal Greeting in Different Languages

Kh

Adding custom user based host IP aliases load custom prepared /etc/hosts from non root user on Linux – Script to allow define IPs that doesn’t have DNS records to user preferred hostname

Wednesday, April 14th, 2021

adding-custom-user-based-host-aliases-etc-hosts-logo-linux

Say you have access to a remote Linux / UNIX / BSD server, i.e. a jump host and you have to remotely access via ssh a bunch of other servers
who have existing IP addresses but the DNS resolver recognized hostnames from /etc/resolv.conf are long and hard to remember by the jump host in /etc/resolv.conf and you do not have a way to include a new alias to /etc/hosts because you don't have superuser admin previleges on the hop station.
To make your life easier you would hence want to add a simplistic host alias to be able to easily do telnet, ssh, curl to some aliased name like s1, s2, s3 … etc.


The question comes then, how can you define the IPs to be resolvable by easily rememberable by using a custom User specific /etc/hosts like definition file? 

Expanding /etc/hosts predefined host resolvable records is pretty simple as most as most UNIX / Linux has the HOSTALIASES environment variable
Hostaliases uses the common technique for translating host names into IP addresses using either getaddrinfo(3) or the obsolete gethostbyname(3). As mentioned in hostname(7), you can set the HOSTALIASES environment variable to point to an alias file, and you've got per-user aliases

create ~/.hosts file

linux:~# vim ~/.hosts

with some content like:
 

g google.com
localhostg 127.0.0.1
s1 server-with-long-host1.fqdn-whatever.com 
s2 server5-with-long-host1.fqdn-whatever.com
s3 server18-with-long-host5.fqdn-whatever.com

linux:~# export HOSTALIASES=$PWD/.hosts

The caveat of hostaliases you should know is this will only works for resolvable IP hostnames.
So if you want to be able to access unresolvable hostnames.
You can use a normal alias for the hostname you want in ~/.bashrc with records like:

alias server-hostname="ssh username@10.10.10.18 -v -o stricthostkeychecking=no -o passwordauthentication=yes -o UserKnownHostsFile=/dev/null"
alias server-hostname1="ssh username@10.10.10.19 -v -o stricthostkeychecking=no -o passwordauthentication=yes -o UserKnownHostsFile=/dev/null"
alias server-hostname2="ssh username@10.10.10.20 -v -o stricthostkeychecking=no -o passwordauthentication=yes -o UserKnownHostsFile=/dev/null"

then to access server-hostname1 simply type it in terminal.

The more elegant solution is to use a bash script like below:

# include below code to your ~/.bashrc
function resolve {
        hostfile=~/.hosts
        if [[ -f “$hostfile” ]]; then
                for arg in $(seq 1 $#); do
                        if [[ “${!arg:0:1}” != “-” ]]; then
                                ip=$(sed -n -e "/^\s*\(\#.*\|\)$/d" -e "/\<${!arg}\>/{s;^\s*\(\S*\)\s*.*$;\1;p;q}" "$hostfile")
                                if [[ -n “$ip” ]]; then
                                        command "${FUNCNAME[1]}" "${@:1:$(($arg-1))}" "$ip" "${@:$(($arg+1)):$#}"
                                        return
                                fi
                        fi
                done
        fi
        command "${FUNCNAME[1]}" "$@"
}

function ping {
        resolve "$@"
}

function traceroute {
        resolve "$@"
}

function ssh {
        resolve "$@"
}

function telnet {
        resolve "$@"
}

function curl {
        resolve "$@"
}

function wget {
        resolve "$@"
}


Now after reloading bash login session $HOME/.bashrc with:

linux:~# source ~/.bashrc

ssh / curl / wget / telnet / traceroute and ping will be possible to the defined ~/.hosts IP addresses just like if it have been defined global wide on System in /etc/hosts.

Enjoy