Recently I've had to help a Priest friend to re-install a Computer with Windows 10 that was messed up, because running for few years and I guess got some malware and viruses and was running really sluggish and not booting every time.
Re-installing Windows is part of the things we as system administrators do for ages, and especially start up Computer geeks used to the in the past. But in the past the experience was much better, as things used to work and the cloud was not messing up with our data and the sys admin has been really the supreme Commander of the Operating System and have the absolute rights to manage the OS, which is not the keys anymore as Windows-es connect to their own cloud to do stuff in the background through many of the multiple Windows undocumented closed services (processes) running in the background of the OS, to leak your data to Microsoft.
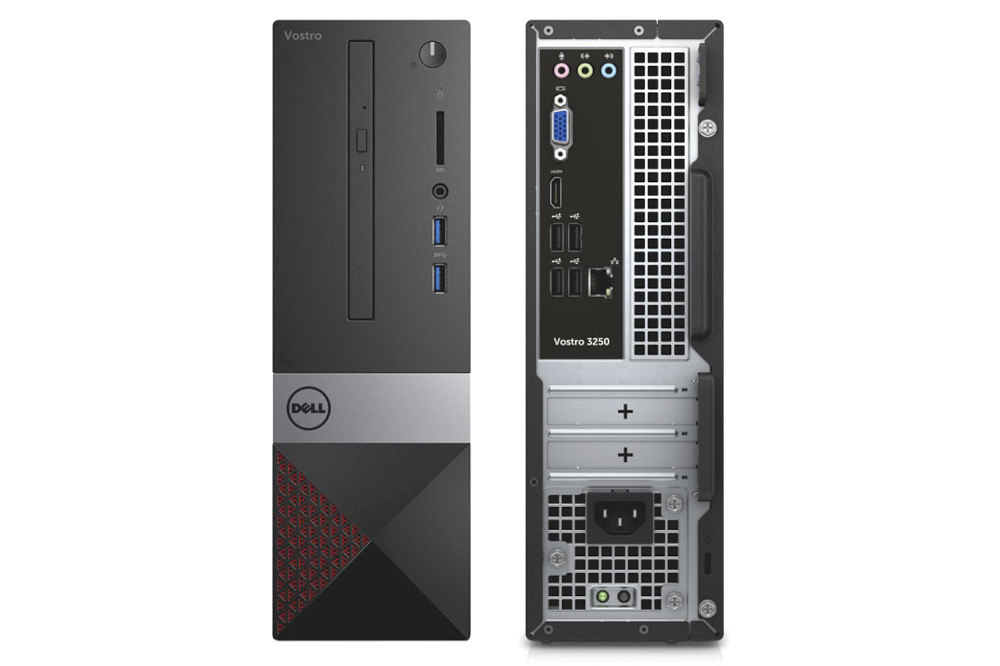
But anyways, enought rant the specific task i had to is to reinstall, the Windows 10 Professional OS which we was running on old Dell Vostro 3250 i5 intell process desktop PC with 1 Terabyte of SATA and 2 x 4 GB Banks of memory.
Before the update I've picked up a second hand 2 banks of DDR L3 memory each 8 Gygabites and updated memory as well as upgraded the conventional SATA disk to 480 GB Kingston SSD to increase the I/O speed that is one of the main reasons besides being Bloated with malware, why this computer was running so sluggish.
For those who did not hear, since the last 4 years, it is a big problem for any old computer who did not exchanged the old SATA disk drive to Solid State Drive, due to some of the Windows Updates. that I guess included additional spying Software on a Windows service level, the computer, even having a legally bought license, from some of the online stores, starts reading rapidly from the hard drive, generating high loads of traffic on both the disk as well as the network, sending your stuff to Microsoft probably for Approval by Bill Gates 🙂
So to work around but not solve, this issue one option is to just enpower the PC with a faster I/O drive as SSD. I also learned it is preatty interesting that nowadays, Microsoft became so invasive, that with Regular Windows Updates and Optional Ones, they change already configured settings from the BIOS.
!!! AND EVEN WORSE SOME OF THE UPDATES COMPLETELY OVERWRITE THE BIOS or UEFI with an executable CHUNKS, that makes you privacy bloated, as you have no way to stop microsoft to mess up with your computer, which is a complete disaster especially for anyone who has a value for his data privacy !!!
It is insane but it is happening the most used Operating System is snooping on everyone and it seems, noone really cares to stop it !
But anyways as the friend of mine has a small business of running a small Photo Shop (that makes pictures for document ID passports), and he paid the Windows OS license and he and his wife who is the main person using the computer has little knowledge on computer and moving to Windows would be hard, especially because they need Micorosoft Word, Excel and Publisher to be on the PC and does not want to migrate from the already known Winblows interface.
After reinstalling, Windows and activating it with the legal serial key from the old PC on the Hardware upgraded PC, the next step was to install standard software on new Windows PCs, I do install such as browsers, Archiver tools (Winrar, 7-Zip), AdBlock Plus (ads blocker) and the rest of Standard software useful to install on new Windows PCs
And of course Microsoft Office 2016, which was also laying on the old computer, to pick up the Micorosoft Professional Plus 2016 old Serial Key used;
a small but very useful, Open Source freeware tool Lazesoft Windows Key Finder that's purpose is to SHOW YOU ON SCREEN Windows OEM key and Office serials on mostly all Windows Versions, Windows Server 2003 / 2008 / 2012 2016 and Desktop versions XP / Vista / 7 / 8 / 10.
Once getting the microsoft key, the next drama was to find Microsoft Office 2016, it seems nowadays, old desktop (non 365 or non-cloud) versions of Win Office are officially not available anymore on Microsoft official download sources, so I had to download a install version from a Torrent (Zamunda), but those who out of Bulgaria could use something like RuTorrent or any local Torrent (if that is not totally prohibited by legislation).
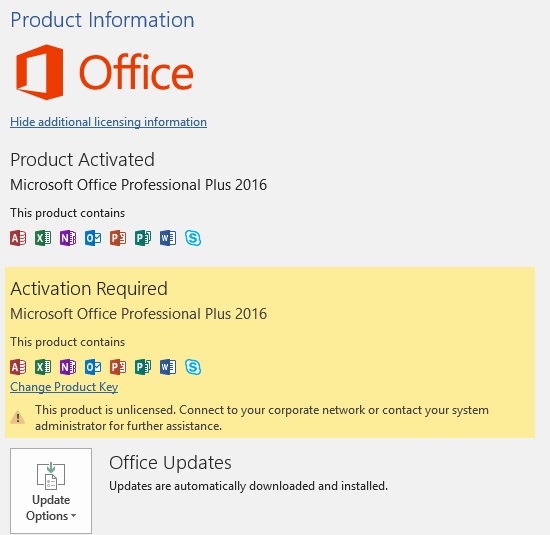
Then once installed the Office, I did not use the Office crack, that with the Torrent but instead tried to activate, normally via the Microsoft Word menus, to fill in the Activation key, there was not possible, as the prompt said, that I had to login to Micorosft account, and that I'm not the system administrator ?!?!
The exact message as you can see on below screenshot was:
"This product is not licensed. Connect to your corporate network or contact your system administrator fur further assistance."
As i'm a console guy and it turned out to be interesting for me how the activation can be achieved via a command line and after few minutes of googling managed to be able to activate the office via the command line (or at least that was the Windows Administrator cmd line said).

C:\Windows\system32>cd "C:\Program Files\Microsoft Office\Office16"
C:\Program Files\Microsoft Office\Office16>cscript ospp.vbs /inpkey:XPNVK-8JYDB-WJJFW3-YJJ8YR-WFG98
Microsoft (R) Windows Script Host Version 5.812
Copyright (C) Microsoft Corporation. All rights reserved.
—Processing————————–
—————————————
ERROR CODE: 0xC004F050
ERROR DESCRIPTION: The Software Licensing Service reported that the product key is invalid.
—————————————
—Exiting—————————–
C:\Program Files\Microsoft Office\Office16>cscript ospp.vbs /inpkey:XQNVK-8JYDB-WJ9W3-YJ8YR-WFG99
Microsoft (R) Windows Script Host Version 5.812
Copyright (C) Microsoft Corporation. All rights reserved.
—Processing————————–
—————————————
<Product key installation successful>
—————————————
—Exiting—————————–
Note that this method does not really works, always I tried with another version of Microsoft Office Plus downloaded from a different source, just for the test to see whether this command line Windows Office activator is universal, but it did not work, as on the other Office Plus release for some reason the ospp.vbs script used in above exaple was missing.
Anyways once logged to the Microsoft account to (easify the surveillance for Microsoft and his Monstrous spy cloud corporation), the activation is possible, but anyways you should still move the cloud in short term to keep the service still up and running, if you still want to be able to use your Winblows 🙂
The other option is to move to Linux kernel based OS but still you have to go for a real fully free GNU / Linux such as Trisquel, Dynebolic, PureOS, Ututu S, Guix, Parabola, Hyperbola or Dragora, and look up for a fully compatible hardware with those ones or otherwise use some mainstream distribution such as Ubuntu and have a Linux kernel with millions of corporate shipped code and non-free firmwares (that are most likely full of back doors to enable some kind of spy or access to your PC).
Tadam, seems we're close to George Orwell's 1984 and Aldous Huxley's Brave New World, but most people still don't know it!
I'm writting this kind of rant article just to bring up your focus to Defend your Digital freedom as much as you can and keep off the non-free stuff as much as you can, if you want to stay at least partially free.


