Posts Tagged ‘system hardware’

How to check how many processor and volume groups IBM AIX eServer have

Monday, July 13th, 2020

how-many-cpus-are-on-commands-Linux-sysadmin-and-user-show-know-AIX-logo
In daily sysadmin duties I have been usually administrating GNU / Linux or FreeBSD servers.
However now in my daily sysadmin jobs I've been added to do some minor sysadmin activities on  a few IBM AIX eServers UNIX machines.

As the eServers were completely unknown to me and I logged in for a first time I needed a way to get idea on what kind of hardware I'm logging in so I wanted to get information about the Central Processing UNIT CPUs on the host.

On Linux I'm used to do a cat /proc/cpuinfo or do dmidecode etc. to get the number of CPUs, however AIX does not have /proc/cpuinfo and has its own way to get information about the system hardware.
As I've red in the IBM AIX's RedBook to get system information on AIX there is the lscfg command.
 

aix:/# lscfg
INSTALLED RESOURCE LIST

The following resources are installed on the machine.
+/- = Added or deleted from Resource List.
*   = Diagnostic support not available.

  Model Architecture: chrp
  Model Implementation: Multiple Processor, PCI bus

+ sys0                                                            System Object
+ sysplanar0                                                      System Planar
* vio0                                                            Virtual I/O Bus
* vscsi3           U8205.E6B.068D6AP-V4-C21-T1                    Virtual SCSI Client Adapter
* vscsi2           U8205.E6B.068D6AP-V4-C20-T1                    Virtual SCSI Client Adapter
* vscsi1           U8205.E6B.068D6AP-V4-C11-T1                    Virtual SCSI Client Adapter
* hdisk1           U8205.E6B.068D6AP-V4-C11-T1-L8100000000000000  Virtual SCSI Disk Drive
* vscsi0           U8205.E6B.068D6AP-V4-C10-T1                    Virtual SCSI Client Adapter
* hdisk0           U8205.E6B.068D6AP-V4-C10-T1-L8100000000000000  Virtual SCSI Disk Drive
* ent3             U8205.E6B.068D6AP-V4-C5-T1                     Virtual I/O Ethernet Adapter (l-lan)
* ent2             U8205.E6B.068D6AP-V4-C4-T1                     Virtual I/O Ethernet Adapter (l-lan)
* ent1             U8205.E6B.068D6AP-V4-C3-T1                     Virtual I/O Ethernet Adapter (l-lan)
* ent0             U8205.E6B.068D6AP-V4-C2-T1                     Virtual I/O Ethernet Adapter (l-lan)
* vsa0             U8205.E6B.068D6AP-V4-C0                        LPAR Virtual Serial Adapter
* vty0             U8205.E6B.068D6AP-V4-C0-L0                     Asynchronous Terminal
+ L2cache0                                                        L2 Cache
+ mem0                                                            Memory
+ proc0                                                           Processor
+ proc4                                                           Processor


To get the number of processors on the host I've had to use:


aix:/# lscfg|grep -i proc
  Model Implementation: Multiple Processor, PCI bus
+ proc0                                                           Processor
+ proc4                                                           Processor


Another way to get the CPU number is with:

aix:/# lsdev -C -c processor
proc0 Available 00-00 Processor
proc4 Available 00-04 Processor


aix:/# lsattr -EH -l proc4
attribute   value          description           user_settable


frequency   3720000000     Processor Speed       False
smt_enabled true           Processor SMT enabled False
smt_threads 4              Processor SMT threads False
state       enable         Processor state       False
type        PowerPC_POWER7 Processor type        False

aix:/# lsattr -EH -l proc0
attribute   value          description           user_settable


frequency   3720000000     Processor Speed       False
smt_enabled true           Processor SMT enabled False
smt_threads 4              Processor SMT threads False
state       enable         Processor state       False
type        PowerPC_POWER7 Processor type        False


As you can see each of the processor is multicore has 2 Cores and each of the cores have for Threads, to get the overall number of CPUs on the system including the threaded Virtual CPUs:

aix:/# bindprocessor -q
The available processors are:  0 1 2 3 4 5 6 7


This specific machine has overall of 8 CPUs cores.

lscfg can be used to get various useful other info of the iron:

aix:/# lscfg -s
INSTALLED RESOURCE LIST


The following resources are installed on the machine.
+/- = Added or deleted from Resource List.
*   = Diagnostic support not available.

  Model Architecture: chrp
  Model Implementation: Multiple Processor, PCI bus

+ sys0
        System Object
+ sysplanar0
        System Planar
* vio0
        Virtual I/O Bus
* vscsi3           U8305…………….
        Virtual SCSI Client Adapter
* vscsi2           U8305…………….
        Virtual SCSI Client Adapter
* vscsi1           U8305…………….
        Virtual SCSI Client Adapter
* hdisk1           U8305…………….
        Virtual SCSI Disk Drive
* vscsi0           U8305……………..
        Virtual SCSI Client Adapter
* hdisk0           U8305…………….
        Virtual SCSI Disk Drive
* ent3             U8305…………….
        Virtual I/O Ethernet Adapter (l-lan)
* ent2             U8305.E6B…………….
        Virtual I/O Ethernet Adapter (l-lan)
* ent1             U8305.E6B…………….
        Virtual I/O Ethernet Adapter (l-lan)
* ent0             U8305.E6B…………….
        Virtual I/O Ethernet Adapter (l-lan)
* vsa0             U8305.E7B…………….
        LPAR Virtual Serial Adapter
* vty0             U8305.E7B…………….
        Asynchronous Terminal
+ L2cache0
        L2 Cache
+ mem0
        Memory
+ proc0
        Processor
+ proc4
        Processor

aix:/# lscfg -p
INSTALLED RESOURCE LIST

The following resources are installed on the machine.

  Model Architecture: chrp
  Model Implementation: Multiple Processor, PCI bus

  sys0                                                            System Object
  sysplanar0                                                      System Planar
  vio0                                                            Virtual I/O Bus
  vscsi3           U8305.E7B…………….V6-C40-T1                    Virtual SCSI Client Adapter
  vscsi2           U8305.E7B…………….V6-C40-T1                     Virtual SCSI Client Adapter
  vscsi1           U8305.E7B…………….V6-C40-T1                    Virtual SCSI Client Adapter
  hdisk1           U8305.E7B…………….V6-C40-T1-L8500000000000000  Virtual SCSI Disk Drive
  vscsi0           U8305.E7B…………….V6-C40-T1                    Virtual SCSI Client Adapter
  hdisk0           U8305.E7B…………….V6-C40-T1-L8500000000000000  Virtual SCSI Disk Drive
  ent3             U8305.E7B…………….V6-C40-T1                     Virtual I/O Ethernet Adapter (l-lan)
  ent2             U8305.E7B…………….V6-C40-T1                     Virtual I/O Ethernet Adapter (l-lan)
  ent1             U8305.E7B…………….V6-C40-T1                     Virtual I/O Ethernet Adapter (l-lan)
  ent0             U8305.E7B…………….V6-C40-T1                     Virtual I/O Ethernet Adapter (l-lan)
  vsa0             U8305.E7B.069D7AP-V5-C1                        LPAR Virtual Serial Adapter
  vty0             U8305.E7B.069D7AP-V5-D1-L0                     Asynchronous Terminal
  L2cache0                                                        L2 Cache
  mem0                                                            Memory
  proc0                                                           Processor
  proc4                                                           Processor

  PLATFORM SPECIFIC

  Name:  IBM,8305-E7B
    Model:  IBM,8305-E7B
    Node:  /
    Device Type:  chrp

  Name:  openprom
    Model:  IBM,AL730_158
    Node:  openprom

  Name:  interrupt-controller
    Model:  IBM, Logical PowerPC-PIC, 00
    Node:  interrupt-controller@0
    Device Type:  PowerPC-External-Interrupt-Presentation

  Name:  vty
    Node:  vty@30000000
    Device Type:  serial
    Physical Location: …………………………………………..

  Name:  l-lan
    Node:  l-lan@30000002
    Device Type:  network
    Physical Location: …………………………………………..

  Name:  l-lan
    Node:  l-lan@30000003
    Device Type:  network
    Physical Location: …………………………………………..

  Name:  l-lan
    Node:  l-lan@30000004
    Device Type:  network
    Physical Location: …………………………………………..

  Name:  l-lan
    Node:  l-lan@30000005
    Device Type:  network
    Physical Location: …………………………………………..

  Name:  v-scsi
    Node:  v-scsi@3000005a
    Device Type:  vscsi
    Physical Location: …………………………………………..

  Name:  v-scsi
    Node:  v-scsi@3000005b
    Device Type:  vscsi
    Physical Location: …………………………………………..

  Name:  v-scsi
    Node:  v-scsi@30000014
    Device Type:  vscsi
    Physical Location: ………………………………..

  Name:  v-scsi
    Node:  v-scsi@30000017
    Device Type:  vscsi
    Physical Location: …………………………………


Another useful command I found is to list the equivalent of Linux's LVM Logical Volumes configured on the system, below is how:

aix:/# lspv hdisk0
00f68c6a84acb0d5 rootvg active hdisk1 00f69d6a85400468 dsvg active

To get more info on a volume group:

aix:/# lspv hdisk0 PHYSICAL VOLUME: hdisk0 VOLUME GROUP: rootvg PV IDENTIFIER: 00f68d6a85acb0d5 VG IDENTIFIER 00f68d6a00004c0000000131353444a5 PV STATE: active STALE PARTITIONS: 0 ALLOCATABLE: yes PP SIZE: 32 megabyte(s) LOGICAL VOLUMES: 12 TOTAL PPs: 959 (30688 megabytes) VG DESCRIPTORS: 2 FREE PPs: 493 (15776 megabytes) HOT SPARE: no USED PPs: 466 (14912 megabytes) MAX REQUEST: 256 kilobytes FREE DISTRIBUTION: 191..00..00..110..192 USED DISTRIBUTION: 01..192..191..82..00 MIRROR POOL: None


You can get which local configured partition is set on which ( PV )Physical Volume

aix:/# lspv -l hdisk0
hdisk0:
LV NAME               LPs     PPs     DISTRIBUTION          MOUNT POINT
lg_dumplv             64      64      00..64..00..00..00    N/A
hd8                   1       1       00..00..01..00..00    N/A
hd6                   16      16      00..16..00..00..00    N/A
hd2                   166     166     00..45..89..32..00    /usr
hd4                   29      29      00..11..18..00..00    /
hd3                   40      40      00..04..04..32..00    /tmp
hd9var                55      55      00..00..37..18..00    /var
hd10opt               74      74      00..37..37..00..00    /opt
hd1                   8       8       00..07..01..00..00    /home
hd5                   1       1       01..00..00..00..00    N/A

Monitoring Linux hardware Hard Drives / Temperature and Disk with lm_sensors / smartd / hddtemp and Zabbix Userparameter lm_sensors report script

Thursday, April 30th, 2020

monitoring-linux-hardware-with-software-temperature-disk-cpu-health-zabbix-userparameter-script

I'm part of a  SysAdmin Team that is partially doing some minor Zabbix imrovements on a custom corporate installed Zabbix in an ongoing project to substitute the previous HP OpenView monitoring for a bunch of Legacy Linux hosts.
As one of the necessery checks to have is regarding system Hardware, the task was to invent some simplistic way to monitor hardware with the Zabbix Monitoring tool.  Monitoring Bare Metal servers hardware of HP / Dell / Fujituse etc. servers  in Linux usually is done with a third party software provided by the Hardware vendor. But as this requires an additional services to run and sometimes is not desired. It was interesting to find out some alternative Linux native ways to do the System hardware monitoring.
Monitoring statistics from the system hardware components can be obtained directly from the server components with ipmi / ipmitool (for more info on it check my previous article Reset and Manage intelligent  Platform Management remote board article).
With ipmi
 hardware health info could be received straight from the ILO / IDRAC / HPMI of the server. However as often the Admin-Lan of the server is in a seperate DMZ secured network and available via only a certain set of routed IPs, ipmitool can't be used.

So what are the other options to use to implement Linux Server Hardware Monitoring?

The tools to use are perhaps many but I know of two which gives you most of the information you ever need to have a prelimitary hardware damage warning system before the crash, these are:
 

1. smartmontools (smartd)

Smartd is part of smartmontools package which contains two utility programs (smartctl and smartd) to control and monitor storage systems using the Self-Monitoring, Analysis and Reporting Technology system (SMART) built into most modern ATA/SATA, SCSI/SAS and NVMe disks

Disk monitoring is handled by a special service the package provides called smartd that does query the Hard Drives periodically aiming to find a warning signs of hardware failures.
The downside of smartd use is that it implies a little bit of extra load on Hard Drive read / writes and if misconfigured could reduce the the Hard disk life time.


linux:~#  /usr/sbin/smartctl -a /dev/sdb2
smartctl 6.6 2017-11-05 r4594 [x86_64-linux-4.19.0-5-amd64] (local build)
Copyright (C) 2002-17, Bruce Allen, Christian Franke, www.smartmontools.org

=== START OF INFORMATION SECTION ===
Device Model:     KINGSTON SA400S37240G
Serial Number:    50026B768340AA31
LU WWN Device Id: 5 0026b7 68340aa31
Firmware Version: S1Z40102
User Capacity:    240,057,409,536 bytes [240 GB]
Sector Size:      512 bytes logical/physical
Rotation Rate:    Solid State Device
Device is:        Not in smartctl database [for details use: -P showall]
ATA Version is:   ACS-3 T13/2161-D revision 4
SATA Version is:  SATA 3.2, 6.0 Gb/s (current: 3.0 Gb/s)
Local Time is:    Thu Apr 30 14:05:01 2020 EEST
SMART support is: Available – device has SMART capability.
SMART support is: Enabled

=== START OF READ SMART DATA SECTION ===
SMART overall-health self-assessment test result: PASSED

General SMART Values:
Offline data collection status:  (0x00) Offline data collection activity
                                        was never started.
                                        Auto Offline Data Collection: Disabled.
Self-test execution status:      (   0) The previous self-test routine completed
                                        without error or no self-test has ever
                                        been run.
Total time to complete Offline
data collection:                (  120) seconds.
Offline data collection
capabilities:                    (0x11) SMART execute Offline immediate.
                                        No Auto Offline data collection support.
                                        Suspend Offline collection upon new
                                        command.
                                        No Offline surface scan supported.
                                        Self-test supported.
                                        No Conveyance Self-test supported.
                                        No Selective Self-test supported.
SMART capabilities:            (0x0002) Does not save SMART data before
                                        entering power-saving mode.
                                        Supports SMART auto save timer.
Error logging capability:        (0x01) Error logging supported.
                                        General Purpose Logging supported.
Short self-test routine
recommended polling time:        (   2) minutes.
Extended self-test routine
recommended polling time:        (  10) minutes.

SMART Attributes Data Structure revision number: 1
Vendor Specific SMART Attributes with Thresholds:
ID# ATTRIBUTE_NAME          FLAG     VALUE WORST THRESH TYPE      UPDATED  WHEN_FAILED RAW_VALUE
  1 Raw_Read_Error_Rate     0x0032   100   100   000    Old_age   Always       –       100
  9 Power_On_Hours          0x0032   100   100   000    Old_age   Always       –       2820
 12 Power_Cycle_Count       0x0032   100   100   000    Old_age   Always       –       21
148 Unknown_Attribute       0x0000   100   100   000    Old_age   Offline      –       0
149 Unknown_Attribute       0x0000   100   100   000    Old_age   Offline      –       0
167 Unknown_Attribute       0x0000   100   100   000    Old_age   Offline      –       0
168 Unknown_Attribute       0x0012   100   100   000    Old_age   Always       –       0
169 Unknown_Attribute       0x0000   100   100   000    Old_age   Offline      –       0
170 Unknown_Attribute       0x0000   100   100   010    Old_age   Offline      –       0
172 Unknown_Attribute       0x0032   100   100   000    Old_age   Always       –       0
173 Unknown_Attribute       0x0000   100   100   000    Old_age   Offline      –       0
181 Program_Fail_Cnt_Total  0x0032   100   100   000    Old_age   Always       –       0
182 Erase_Fail_Count_Total  0x0000   100   100   000    Old_age   Offline      –       0
187 Reported_Uncorrect      0x0032   100   100   000    Old_age   Always       –       0
192 Power-Off_Retract_Count 0x0012   100   100   000    Old_age   Always       –       16
194 Temperature_Celsius     0x0022   034   052   000    Old_age   Always       –       34 (Min/Max 19/52)
196 Reallocated_Event_Count 0x0032   100   100   000    Old_age   Always       –       0
199 UDMA_CRC_Error_Count    0x0032   100   100   000    Old_age   Always       –       0
218 Unknown_Attribute       0x0032   100   100   000    Old_age   Always       –       0
231 Temperature_Celsius     0x0000   097   097   000    Old_age   Offline      –       97
233 Media_Wearout_Indicator 0x0032   100   100   000    Old_age   Always       –       2104
241 Total_LBAs_Written      0x0032   100   100   000    Old_age   Always       –       1857
242 Total_LBAs_Read         0x0032   100   100   000    Old_age   Always       –       1141
244 Unknown_Attribute       0x0000   100   100   000    Old_age   Offline      –       32
245 Unknown_Attribute       0x0000   100   100   000    Old_age   Offline      –       107
246 Unknown_Attribute       0x0000   100   100   000    Old_age   Offline      –       15940

SMART Error Log Version: 1
No Errors Logged

SMART Self-test log structure revision number 1
No self-tests have been logged.  [To run self-tests, use: smartctl -t]

Selective Self-tests/Logging not supported


2. hddtemp


Usually if smartd is used it is useful to also use hddtemp which relies on smartd data.
 The hddtemp program monitors and reports the temperature of PATA, SATA
 or SCSI hard drives by reading Self-Monitoring Analysis and Reporting
 Technology (S.M.A.R.T.)
information on drives that support this feature.
 

linux:~# /usr/sbin/hddtemp /dev/sda1
/dev/sda1: Hitachi HDS721050CLA360: 31°C
linux:~# /usr/sbin/hddtemp /dev/sdc6
/dev/sdc6: KINGSTON SV300S37A120G: 25°C
linux:~# /usr/sbin/hddtemp /dev/sdb2
/dev/sdb2: KINGSTON SA400S37240G: 34°C
linux:~# /usr/sbin/hddtemp /dev/sdd1
/dev/sdd1: WD Elements 10B8: S.M.A.R.T. not available


3. lm-sensors / i2c-tools 

 Lm-sensors is a hardware health monitoring package for Linux. It allows you
 to access information from temperature, voltage, and fan speed sensors.
i2c-tools
was historically bundled in the same package as lm_sensors but has been seperated cause not all hardware monitoring chips are I2C devices, and not all I2C devices are hardware monitoring chips.

The most basic use of lm-sensors is with the sensors command


linux:~# sensors
i350bb-pci-0600
Adapter: PCI adapter
loc1:         +55.0 C  (high = +120.0 C, crit = +110.0 C)


coretemp-isa-0000
Adapter: ISA adapter
Physical id 0:  +28.0 C  (high = +78.0 C, crit = +88.0 C)
Core 0:         +26.0 C  (high = +78.0 C, crit = +88.0 C)
Core 1:         +28.0 C  (high = +78.0 C, crit = +88.0 C)
Core 2:         +28.0 C  (high = +78.0 C, crit = +88.0 C)
Core 3:         +28.0 C  (high = +78.0 C, crit = +88.0 C)


On CentOS Linux useful tool is also  lm_sensors-sensord.x86_64 – A Daemon that periodically logs sensor readings to syslog or a round-robin database, and warns of sensor alarms.

In Debian Linux there is also the psensors-server (an HTTP server providing JSON Web service which can be used by GTK+ Application to remotely monitor sensors) useful for developers
psesors-server

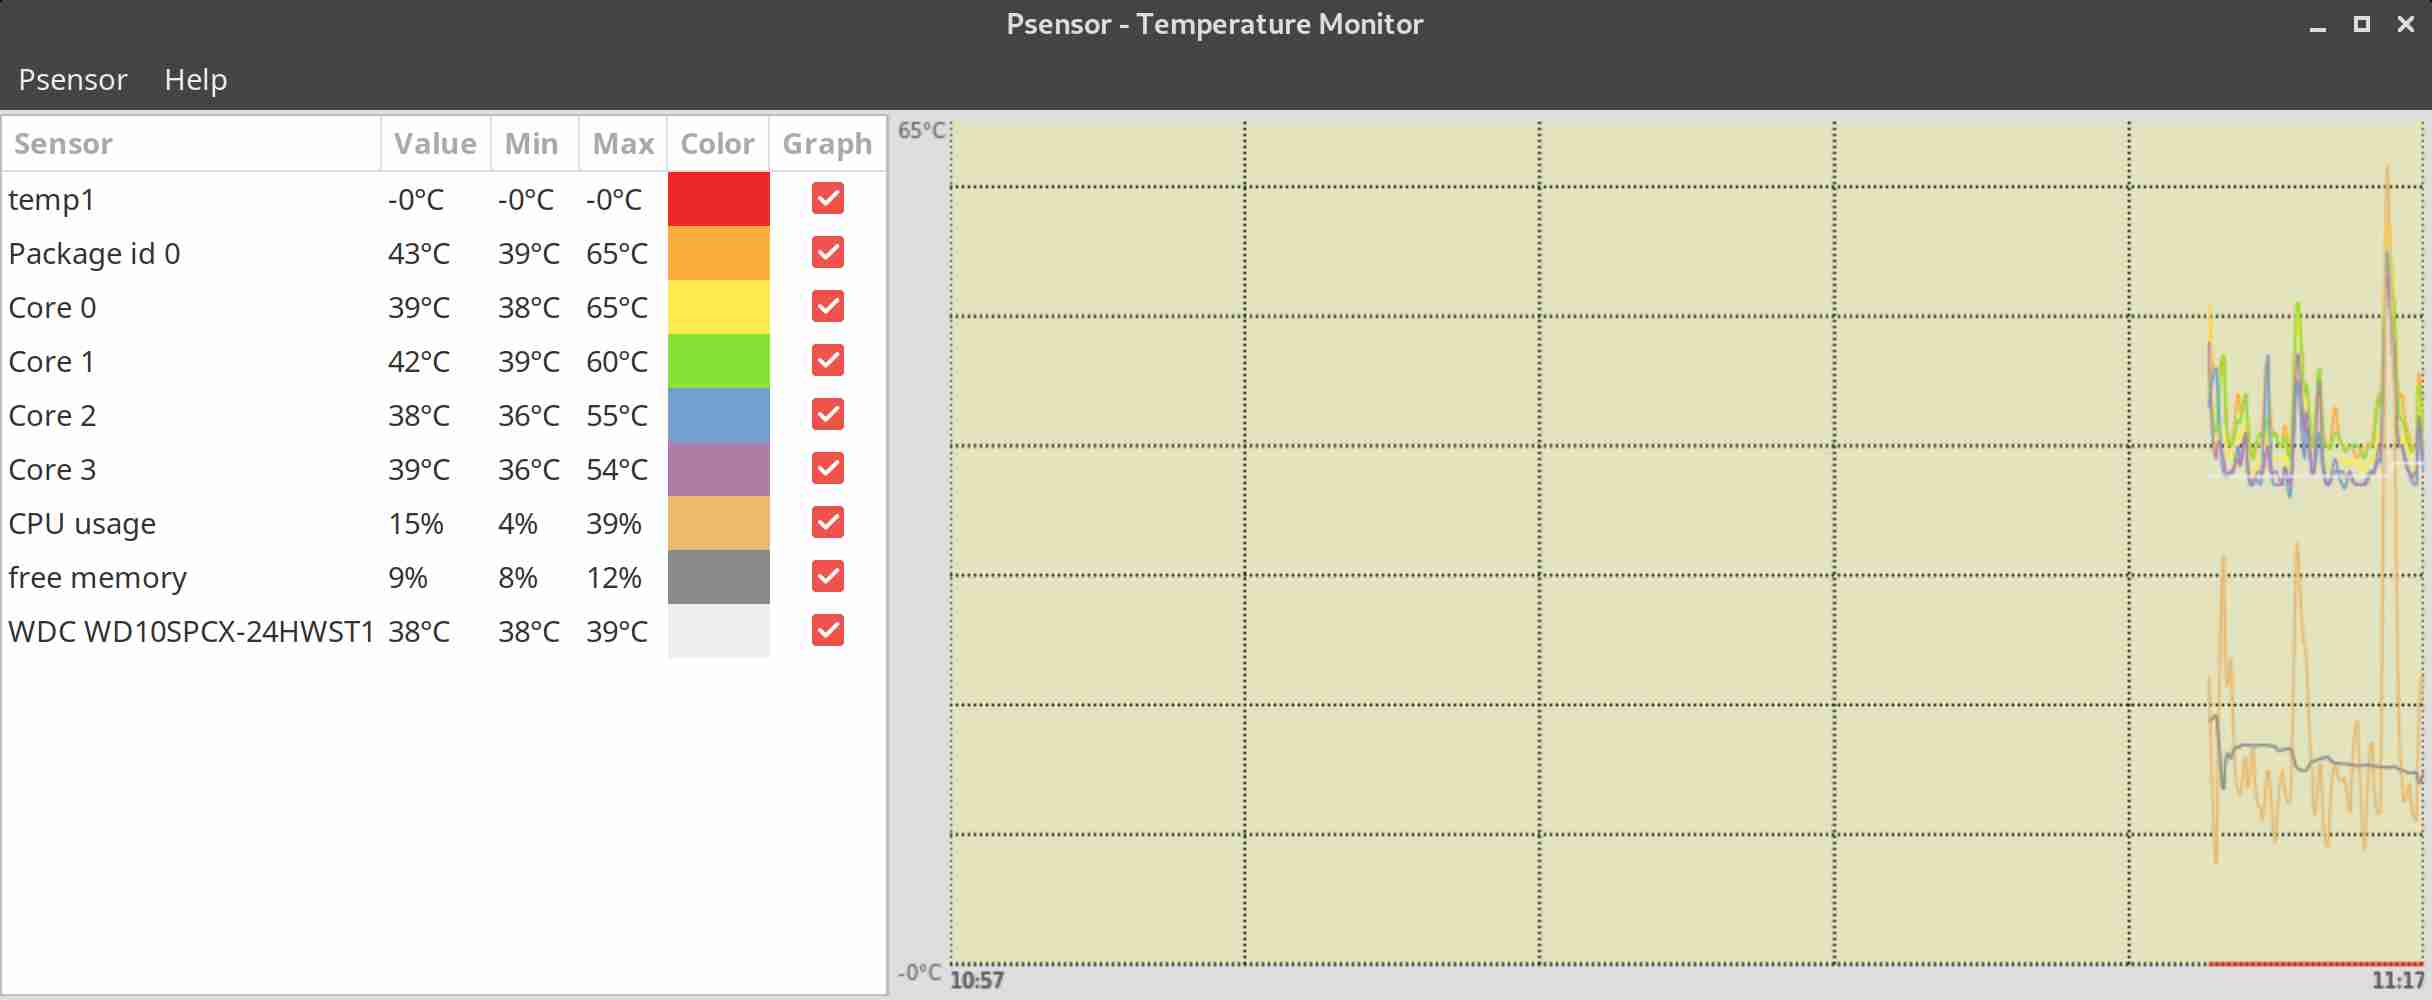
psensor-linux-graphical-tool-to-check-cpu-hard-disk-temperature-unix

If you have a Xserver installed on the Server accessed with Xclient or via VNC though quite rare,
You can use xsensors or Psensora GTK+ (Widget Toolkit for creating Graphical User Interface) application software.

With this 3 tools it is pretty easy to script one liners and use the Zabbix UserParameters functionality to send hardware report data to a Company's Zabbix Sserver, though Zabbix has already some templates to do so in my case, I couldn't import this templates cause I don't have Zabbix Super-Admin credentials, thus to work around that a sample work around is use script to monitor for higher and critical considered temperature.
Here is a tiny sample script I came up in 1 min time it can be used to used as 1 liner UserParameter and built upon something more complex.

SENSORS_HIGH=`sensors | awk '{ print $6 }'| grep '^+' | uniq`;
SENSORS_CRIT=`sensors | awk '{ print $9 }'| grep '^+' | uniq`; ;SENSORS_STAT=`sensors|grep -E 'Core\s' | awk '{ print $1" "$2" "$3 }' | grep "$SENSORS_HIGH|$SENSORS_CRIT"`;
if [ ! -z $SENSORS_STAT ]; then
echo 'Temperature HIGH';
else 
echo 'Sensors OK';
fi 

Of course there is much more sophisticated stuff to use for monitoring out there


Below script can be easily adapted and use on other Monitoring Platforms such as Nagios / Munin / Cacti / Icinga and there are plenty of paid solutions, but for anyone that wants to develop something from scratch just like me I hope this
article will be a good short introduction.
If you know some other Linux hardware monitoring tools, please share.

Check if server is Physical Bare Metal or a Virtual Machine and its type

Tuesday, March 17th, 2020

check-if-linux-operating-system-is-running-on-physical-bare-metal-or-virtual-machine

In modern times the IT employee system administrator / system engineer / security engineer or a developer who has to develop and test code remotely on UNIX hosts, we have to login to multiple of different servers located in separate data centers around the world situated in Hybrid Operating system environments running multitude of different Linux OSes. Often especially for us sysadmins it is important to know whether the remote machine we have SSHed to is physical server (Bare Metal) or a virtual machines running on top of different kind of Hypervisor node OpenXen / Virtualbox / Virtuosso  / VMWare etc.
 

Then the question comes how to determine whether A remote Installed Linux is Physical or Virtual ?
 

1. Using the dmesg kernel log utility


The good old dmesg that is used to examine and control the kernel ring buffer detects plenty of useful information which gives you the info whether a server is Virtual or Bare Metal. It is present and accessible on every Linux server out there, thus using it is the best and simplest way to determine the OS system node type.

To grep whether a machine is Virtual and the Hypervisor type use:


nginx:~# dmesg | grep "Hypervisor detected"
[0.000000] Hypervisor detected: KVM


As you see above OS installed is using the KVM Virtualization technology.

An empty output of this command means the Remote OS is installed on a physical computer.


2. Detecting the OS platform the systemd way


Systemd along with the multiple over-complication of things that nearly all sysadmins (including me hate) so much introduced something useful in the fact of hostnamectl command
that could give you the info about the OS chassis platform.


root@pcfreak:~# hostnamectl status
 
 Static hostname: pcfreak
         Icon name: computer-desktop
           Chassis: desktop
        Machine ID: 02425d67037b8e67cd98bd2800002671
           Boot ID: 34a83b9a79c346168082f7605c2f557c
  Operating System: Debian GNU/Linux 10 (buster)
            Kernel: Linux 4.19.0-5-amd64
      Architecture: x86-64


Below is output of a VM running on a Oracle Virtualbox HV.


linux:~# hostnamectl status
Static hostname: ubuntuserver
 Icon name: computer-vm
 Chassis: vm
 Machine ID: 2befe86cf8887ca098f509e457554beb
 Boot ID: 8021c02d65dc46b1885afb25fddcf18c
 Virtualization: oracle
 Operating System: Ubuntu 16.04.1 LTS
 Kernel: Linux 4.4.0-78-generic
 Architecture: x86-64


3. Detect concrete container virtualization with systemd-detect-virt 


Another Bare Metal or VM identify tool that was introducted some time ago by freedesktop project is systemd-detect-virt (usually command is part of systemd package).
It is useful to detect the exact virtualization on a systemd running OS systemd-detect-virt is capable to detect many type of Virtualization type that are rare like: IBM zvm S390 Z/VM, bochs, bhyve (a FreeBSD hypervisor), Mac OS's parallels, lxc (linux containers), docker containers, podman etc.

The output from the command is either none (if no virtualization is present or the VM Hypervisor Host type):


server:~# systemd-detect-virt
none


quake:~# systemd-detect-virt
oracle


4. Install and use facter to report per node facts


debian:~# apt-cache show facter|grep -i desc -A2
Description-en: collect and display facts about the system
 Facter is Puppet’s cross-platform system profiling library. It discovers and
 reports per-node facts, which are collected by the Puppet agent and are made

Description-md5: 88cdf9a1db3df211de4539a0570abd0a
Homepage: https://github.com/puppetlabs/facter
Tag: devel::lang:ruby, devel::library, implemented-in::ruby,
root@jeremiah:/home/hipo# apt-cache show facter|grep -i desc -A1
Description-en: collect and display facts about the system
 Facter is Puppet’s cross-platform system profiling library. It discovers and

Description-md5: 88cdf9a1db3df211de4539a0570abd0a
Homepage: https://github.com/puppetlabs/facter


– Install facter on Debian / Ubuntu / deb based Linux


# apt install facter –yes


– Install facter on RedHat / CentOS RPM based distros

# yum install epel-release


# yum install facter


– Install facter on OpenSuSE / SLES

# zypper install facter


Once installed on the system to find out whether the remote Operating System is Virtual:

# facter 2> /dev/null | grep virtual
is_virtual => false
virtual => physical


If the machine is a virtual machine you will get some different output like:

# facter 2> /dev/null | grep virtual
is_virtual => true
virtual => kvm


If you're lazy to grep you can use it with argument.

# facter virtual
physical


6. Use lshw and dmidecode (list hardware configuration tool)


If you don't have the permissions to install facter on the system and you can see whether lshw (list hardware command) is not already present on remote host.

# lshw -class system  
storage-host                  
    description: Computer
    width: 64 bits
    capabilities: smbios-2.7 vsyscall32

If the system is virtual you'll get an output similar to:

# lshw -class system  
debianserver 
 description: Computer
 product: VirtualBox
 vendor: innotek GmbH
 version: 1.2
 serial: 0
 width: 64 bits
 capabilities: smbios-2.5 dmi-2.5 vsyscall32
 configuration: family=Virtual Machine uuid=78B58916-4074-42E2-860F-7CAF39F5E6F5


Of course as it provides a verbosity of info on Memory / CPU type / Caches / Cores / Motherboard etc. virtualization used or not can be determined also with dmidecode / hwinfo and other tools that detect the system hardware this is described thoroughfully in my  previous article Get hardware system info on Linux.


7. Detect virtualziation using virt-what or imvirt scripts


imvirt is a little script to determine several virtualization it is pretty similar to virt-what the RedHat own script for platform identification. Even though virt-what is developed for RHEL it is available on other distros, Fedoda, Debian, Ubuntu, Arch Linux (AUR) just like is imvirt.

installing both of them is with the usual apt-get / yum or on Arch Linux with yay package manager (yay -S virt-what) …

Once run the output it produces for physical Dell / HPE / Fujitsu-Siemens Bare Metal servers would be just empty string.

# virt-what
#

Or if the system is Virtual Machine, you'll get the type, for example KVM (Kernel-based Virtual Machine) / virtualbox / qemu etc.

#imvirt
Physical


Conclusion


It was explained how to do a simple check whether the server works on a physical hardware or on a virtual Host hypervisor. The most basic and classic way is with dmesg. If no access to dmesg is due to restrictions you can try the other methods for systemd enabled OSes with hostnamectl / systemd-detect-virt. Other means if the tools are installed or you have the permissions to install them is with facter / lshw or with virt-what / imvirt scripts.
There definitely perhaps much more other useful tools to grasp hardware and virtualization information but this basics could be useful enough for shell scripting purposes.
If you know other tools, please share.
 

Monitoring CPU load and memory usage on Mac OS X command line (Terminal)

Thursday, July 3rd, 2014

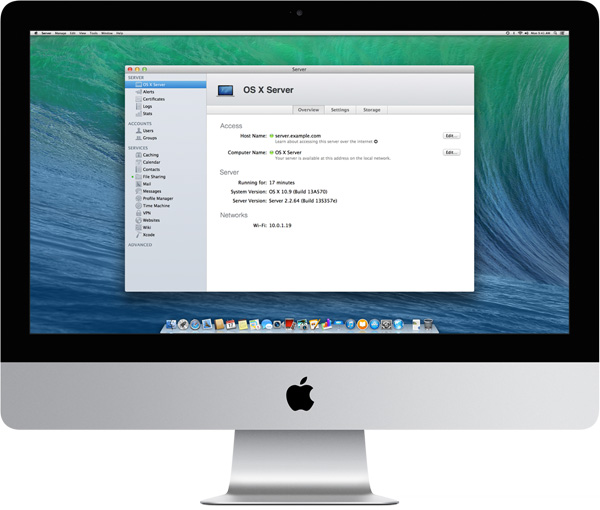
macosx-server-screenshot-server-assistant-apple-tool
You might be stunned to find out Mac OS X has a server variant called Mac OS X server. For the usual admin having to administer a Mac OS X based server is something rarely to do, however it might happen some day, and besides that nowadays Mac OS X has about 10% percentage share of PC desktop and laptops used on the Internet (data collected from w3cschools log files). Thus cause it is among popular OSes, it very possible sooner or later as a sysadmin you will have to troubleshoot issues on at least Mac OS X notebook. Mac has plenty of instruments to debug OS issues as it is UNIX (BSD) based

Mac OS X has already a GUI tool called Activity Monitor (existing in Mac OS 10.3 onwards) in earlier verions, there was tool called Process Viewer and CPU Monitor.

To start Activity Monitor open Finder and launch it via:

Applications -> Utilities -> Activity Monitor

As a Linux guy, I like to use command line and there Mac OS X is equipped with a good arsenal of tools to check CPU load and Memory. Mac OS X comes with sar – (system activity reporter), top (process monitor) and vm_stat (virtual memory statistics) command – these ones are equivalent of Linux's sar (from sysstats package), top and Linux vmstat (report virtual memory statistics).

1. Check out Mac OS X HDD Input / Output statistics
 

$ sar -d -f ~/output.sar

20:43:18   device    r+w/s    blks/s
New Disk: [disk0] IODeviceTree:/PCI0@0/RP06@1C,5/SSD0@0/PRT0@0/PMP@0/@0:0
New Disk: [disk1] IOService:/IOResources/IOHDIXController/IOHDIXHDDriveOutKernel@1/IODiskImageBlockStorageDeviceOutKernel/IOBlockStorageDriver/Apple UDIF, только для чтения, сжатый (zlib)
New Disk: [disk2] IOService:/IOResources/IOHDIXController/IOHDIXHDDriveOutKernel@3/IODiskImageBlockStorageDeviceOutKernel/IOBlockStorageDriver/Apple UDIF, только для чтения, сжатый (bzip2)
New Disk: [disk3] IOService:/IOResources/IOHDIXController/IOHDIXHDDriveOutKernel@4/IODiskImageBlockStorageDeviceOutKernel/IOBlockStorageDriver/Apple UDIF, только для чтения, сжатый (bzip2)
New Disk: [disk4] IOService:/IOResources/IOHDIXController/IOHDIXHDDriveOutKernel@6/IODiskImageBlockStorageDeviceOutKernel/IOBlockStorageDriver/Apple UDIF, только для чтения, сжатый (zlib)
20:43:28   disk0        7        312
20:43:28   disk1        0          0
20:43:28   disk2        0          0
20:43:28   disk3        0          0
20:43:28   disk4        0          0
20:43:38   disk0       12        251
20:43:38   disk1        0          

2. Checking Mac OS X CPU Load from terminal

To check Load from Mac OS command line use:
 

$ sar -o ~/output.sar 10 10

That gathers 10 sets of metrics at 10 second intervals. You can then extract useful information from the output file (even while it's still running), this will get you cpu load on Mac OS system spitting stats every 10 seconds.


21:22:33  %usr  %nice   %sys   %idle
21:22:43    7      0      2     90
21:22:53    8      0      3     89
21:23:03   11      0      4     85
21:23:13    9      0      3     88
21:23:23    9      0      3     88
21:23:33    7      0      3     90
21:23:43   10      0      3     87
21:23:53   10      0      4     85
21:24:03   10      0      5     85
21:24:13    8      0      3     88
Average:      8      0      3     87   


3. Checking Free memory on  Mac OS X

Use this obscure one liner to free -m Linux memory command like output from Mac terminal

$ vm_stat | perl -ne '/page size of (d+)/ and $size=$1; /Pagess+([^:]+)[^d]+(d+)/ and printf("%-16s % 16.2f Min", "$1:", $2 * $size / 1048576);'
 

free: 43.38 Mi
active: 1762.00 Mi
inactive: 1676.91 Mi
speculative: 3.29 Mi
wired down: 609.38 Mi
copy-on-write: 29431.01 Mi
zero filled: 4687689.80 Mi
reactivated: 30288.86 Mi


To show inactive memory in Gigabytes every 10 seconds

$ vm_stat 10 | awk 'NR>2 {gsub("K","000");print ($1+$4)/256000}'

1.70532
1.70455
1.70389
1.6904


It is also possible to get memory statistics on Mac PC running top in non-interactive mode and grepping it from output:

$ top -l 1 | head -n 10 | grep PhysMem | sed 's/, /n /g'


PhysMem: 599M wired, 1735M active, 1712M inactive, 4046M used, 47M free.


4. Quick command to get Kernel / how many CPUs, available memory and load avarage on Mac OS X

From y. 2003 onwards of Mac OS have hostinfo(host information) command, providing admin with quick way to get System Info on Mac OS

$ hostinfo


Mach kernel version:
Darwin Kernel Version 12.5.0: Sun Sep 29 13:33:47 PDT 2013; root:xnu-2050.48.12~1/RELEASE_X86_64
Kernel configured for up to 4 processors.
2 processors are physically available.
4 processors are logically available.
Processor type: i486 (Intel 80486)
Processors active: 0 1 2 3
Primary memory available: 4.00 gigabytes
Default processor set: 98 tasks, 621 threads, 4 processors
Load average: 1.63, Mach factor: 2.54


If you need more verbose information on system hardware and resources, check out system_profiler. As the manual describes it, system_profiler(reports system hardware and software configuration.) cmd:

$ system_profiler Here is a link to output file generated by system_prifler


How to disable PC Spaker on Debian and Ubuntu Linux

Sunday, May 13th, 2012


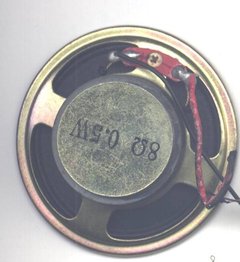
How to disable pc-speaker on Linux / PC-Speaker Old Desktop Computer picture

A PC Speaker is helpful as it could be used as a tool for diagnosing system hardware failures (different systems produce different beep sequences depending on the machine BIOS type).
Using the instructions for the respective BIOS vendor and version one could determine the type of problem experienced by a machine based on the sequence and frequency of sounds produced by the SPEAKER.
Lets say a hardware component on a server is down with no need for a monitor or screen to be attached you can say precisely if it is the hard drive, memory or fan malfunctioning…

Generally speaking historically embedded PC Speaker was inseparatable part of the Personal Computers, preceding the soundblasters, now this is changing but for compitability sake many comp equipment vendors still produce machines with pc-speaker in.
Some newer machines (mostly laptops) are factory produced with no PC-SPEAKER component anymore.
For those who don't know what is PC SPEAKER, it is a hardware device capable of emitting very simple short beep sounds at certain system occasions.

Talking about PC-Speaker, it reminds me of the old computer days, where we used pc-speakers to play music in DOS quite frequently.
It was wide practice across my friends and myself to use the pc-speaker to play Axel Folly and other mod files because we couldn't afford to pay 150$ for a sound cards. Playing a song over pc-speaker is quite a nice thing and it will be a nice thing if someone writes a program to be able to play songs on Linux via the pc-speaker for the sake of experiment.

As of time of writting, I don't know of any application capable of playing music files via the pc-speaker if one knows of something like this please, drop me a comment..

As long as it is used for hardware failure diagnosis the speaker is useful, however there are too many occasions where its just creating useless annoying sounds.
For instance whether one uses a GUI terminal or console typing commands and hits multiple times backspace to delete a mistyped command. The result is just irritating beeps, which could be quite disturbing for other people in the room (for example if you use Linux as Desktop in heterogeneous OS office).
When this "unplanned" glitchering beeps are experienced 100+ times a day you really want to break the computer, as well as your collegues are starting to get mad (if not using their headphones) 🙂

Hence you need sometimes to turn off the pc-speaker to save some nerves.

Here is how this is done on major Linux distros.

On Debian and most other distros, the PC SPEAKER is controlled by a kernel module, so to disable communication with the speaker you have to remove the kernel module.

On Debian and Fedora disabling pcspeaker is done with:

# modprobe -r pcspkr

Then to permanently disable load of the pcspkr module on system boot:

debian:~# echo 'blacklist pcspkr' >> /etc/modprobe.d/blacklist.conf

On Ubuntu to disable load on boot /etc/modprobe.d/blacklist, file should be used:

ubuntu:~# echo 'blacklist pcspkr' >> /etc/modprobe.d/blacklist
Well that's all folks …

Reboot Safely a frozen (hanged up) Linux Server with Magic SysRQ Key combination

Monday, June 20th, 2011

Linux Magic SysRQ Key picture

Being a remote system administrator for many years from now, I’ve experienced many times sudden Linux crashes, mostly caused by system hardware overloads.

This is a common thing especially on busy Web Servers with (Apache/MySQL). Situations like this are really messy and many times in order to bringt the server back online, one has to either physically go to the Data Center or contact the Technical support to request a server reboot.

In this terrible times, data loss might occur if the Server reset button is used to cold reboot it.

Happily in 99% of the cases the data loss which might occur could be prevented with Linux’s kernel capability to support the Magic SysRQ key !

Having the Magic SysRQ key functionality being supported in Linux in past times wasn’t that common, thanksfully these days this has changed andlmost every Linux distrubution supports this handy feature.

Now you might wonder what is the magic with those Magic SysRQ key ?

Let me explain, Magic SysRQ is a kernel level functionality which supports even completely crashed Linux systems with the horrifying:

Kernel Panic
message to be properly shutdown.

Using Magic SysRQ instead of the mostly used indiced cold reboots is really advantageous, as all the opened files by programs on the crashed server which hanged will be properly saved and closed and thus possible data loss caused by the sudden server crash will be minimized.

One other good thing about the Magic SysRQ Key keyboard combination is that initiating the Magic SysRQ could be made blindly (no need for server monitor or display to present any error messages on the failed server).

Now to check if the magic sysrq is enabled on a server one should issue the command:

Here are some Magic SysRQ keyboard combinations one can use in case of server failure:

ALT+SYSRQ+M to dump memory info;
ALT+SYSRQ+P to dump processes states;
ALT+SYSRQ+S to sync disks;
ALT+SYSRQ+U to unmount all mounted filesystems;
ALT+SYSRQ+E to terminate processes;
ALT+SYSRQ+I to kill all processes
ALT+SYSRQ+U to try to unmount once again;
ALT+SYSRQ+B to reboot.

I would skip to explain what each of the keyboard combinations will do as I believe the above description explains it well.

One classics of combinations one might want to issue on a failed Linux server supporting the Magic SysRQ would be:

ALT+SYSRQ+R
ALT+SYSRQ+E
ALT+SYSRQ+I
ALT+SYSRQ+S
ALT+SYSRQ+U
ALT+SYSRQ+B

The ALT+SYSRQ+REISUB key combination is very popular among system administrators.
Also Magic SysRQ is heavily used by kernel developers as it includes many handy debugging options.

If you try the Magic SysRQ key on older servers and you realize it doesn’t react you will have to recompile the linux kernel and enable the CONFIG_MAGIC_SYSRQ kernel time compilation option.

The Magic SysRQ can also be initiated remotely on a properly running server 😉 by initiating:

server:~# echo b > /proc/sysrq-trigger

This command would be useful if you want to just have fun and test that magic sysrq works on your system for sure 😉

To sum it up using the Magic SysRQ will guarantee your locked up, server a Safe Reboot and will hopefully save you a lot of time for backups recovery.