Posts Tagged ‘zabbix’

Monitor cluster heartbeat lines IP reahability via ping ICMP protocol with Zabbix

Wednesday, April 12th, 2023

https://pc-freak.net/images/zabbix-monitoring-icmp-ping-on-application-crm-clusters-with-userparameter-script-howto

Say you're having an haproxy load balancer cluster with two or more nodes and you are running the servers inside some complex organizational hybrid complex network that is a combination of a local DMZ lans, many switches, dedicated connectivity lines and every now and then it happens for the network to mysteriously go down. Usually simply setting monitoring on the network devices CISCO itself or the smart switches used is enough to give you an overview on what's going on but if haproxy is in the middle of the end application servers and in front of other Load balancers and network equipment sometimes it might happen that due to failure of a network equipment / routing issues or other strange unexpected reasons one of the 2 nodes connectivity might fail down via the configured dedicated additional Heartbeat lines that are usually configured in order to keep away the haproxy CRM Resource Manager cluster thus ending it up in a split brain scenarios.

Assuming that this is the case like it is with us you would definitely want to keep an eye on the connectivity of Connect Line1 and Connect Line2 inside some monitoring software like zabbix. As our company main monitoring software used to monitor our infrastructure is Zabbix in this little article, I'll briefly explain how to configre the network connectivity status change from haproxy node1 and haproxy node2 Load balancer cluster to be monitored via a simple ICMP ping echo checks.

Of course the easies way to configure an ICMP monitor via Zabbix is using EnableRemoteCommands=1 inside /etc/zabbix/zabbix-agentd.conf but if your infrastructure should be of High Security and PCI perhaps this options is prohibited to be used on the servers. This is why to achieve still the ICMP ping checks with EnableRemoteCommands=0 a separate simple bash user parameter script could be used. Read further to find out one way ICMP monitoring with a useparameter script can be achieved with Zabbix.


1. Create the userparameter check for heartbeat lines

root@haproxy1 zabbix_agentd.d]# cat userparameter_check_heartbeat_lines.conf
UserParameter=heartbeat.check,\
/etc/zabbix/scripts/check_heartbeat_lines.sh

root@haproxy2 zabbix_agentd.d]# cat userparameter_check_heartbeat_lines.conf
UserParameter=heartbeat.check,\
/etc/zabbix/scripts/check_heartbeat_lines.sh

2. Create check_heartbeat_lines.sh script which will be actually checking connectivity with simple ping

root@haproxy1 zabbix_agentd.d]# cat /etc/zabbix/scripts/check_heartbeat_lines.sh
#!/bin/bash
hb1=haproxy2-lb1
hb2=haproxy2-lb2
if ping -c 1 $hb1  &> /dev/null
then
  echo "$hb1 1"
else
  echo "$hb1 0"
fi
if ping -c 1 $hb2  &> /dev/null
then
  echo "$hb2 1"
else
  echo "$hb2 0"
fi

[root@haproxy1 zabbix_agentd.d]#

root@haproxy2 zabbix_agentd.d]# cat /etc/zabbix/scripts/check_heartbeat_lines.sh
#!/bin/bash
hb1=haproxy1-hb1
hb2=haproxy1-hb2
if ping -c 1 $hb1  &> /dev/null
then
  echo "$hb1 1"
else
  echo "$hb1 0"
fi
if ping -c 1 $hb2  &> /dev/null
then
  echo "$hb2 1"
else
  echo "$hb2 0"
fi

[root@haproxy2 zabbix_agentd.d]#


3. Test script heartbeat lines first time

Each of the nodes from the cluster are properly pingable via ICMP protocol

The script has to be run on both haproxy1 and haproxy2 Cluster (load) balancer nodes

[root@haproxy-hb1 zabbix_agentd.d]# /etc/zabbix/scripts/check_heartbeat_lines.sh
haproxy2-hb1 1
haproxy2-hb2 1

[root@haproxy-hb2 zabbix_agentd.d]# /etc/zabbix/scripts/check_heartbeat_lines.sh
haproxy1-hb1 1
haproxy1-hb2 1


The status of 1 returned by the script should be considered remote defined haproxy node is reachable / 0 means ping command does not return any ICMP status pings back.

4. Restart the zabbix-agent on both cluster node machines that will be conducting the ICMP ping check

[root@haproxy zabbix_agentd.d]# systemctl restart zabbix-agentd
[root@haproxy zabbix_agentd.d]# systemctl status zabbix-agentd

[root@haproxy zabbix_agentd.d]# tail -n 100 /var/log/zabbix_agentd.log


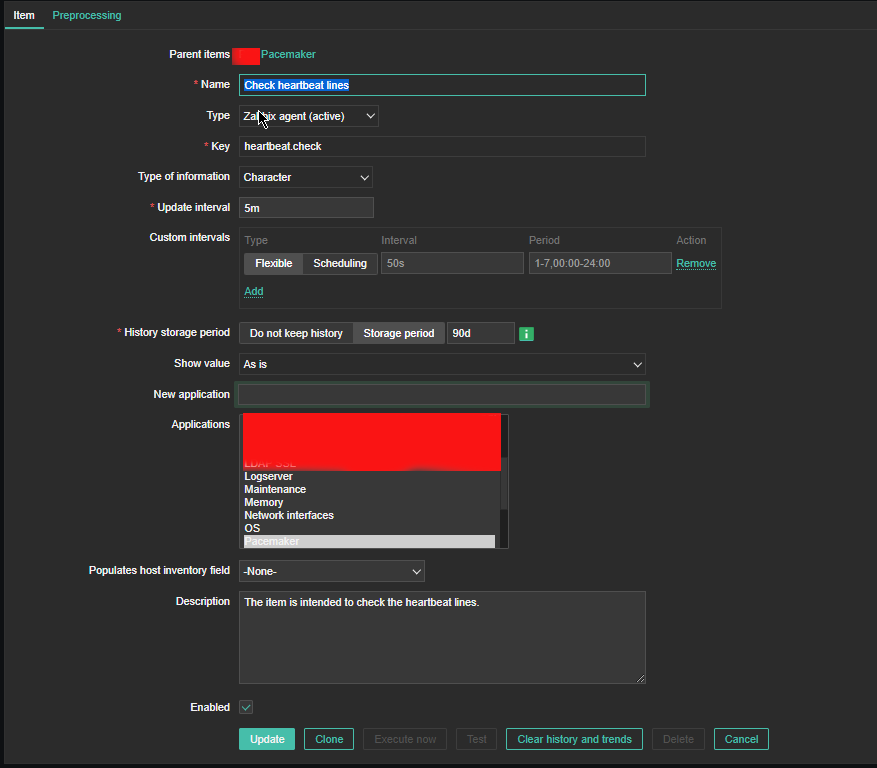
5. Create Item to process the userparam script

Create Item as follows:

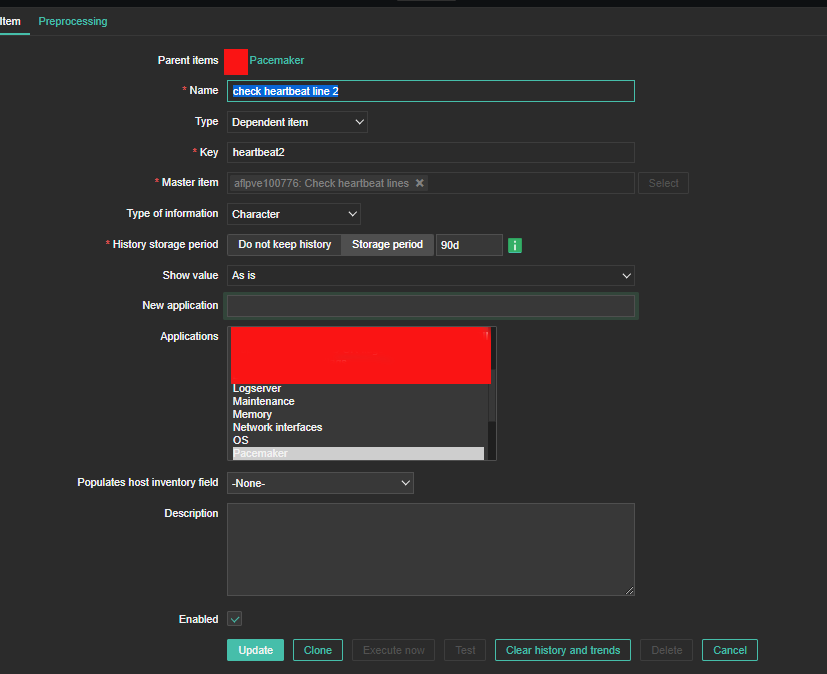
6. Create the Dependent Item required
 

zabbix-heartbeat-check-screenshots/heartbeat-line1-preprocessing

For processing you need to put the following simple regular expression

Name: Regular Expression
Parameters: hb1(\s+)(\d+)
Custom on fail: \2

zabbix-heartbeat-check-screenshots/heartbeat-line2-preprocessing1

zabbix-heartbeat-check-screenshots/heartbeat-lines-triggers


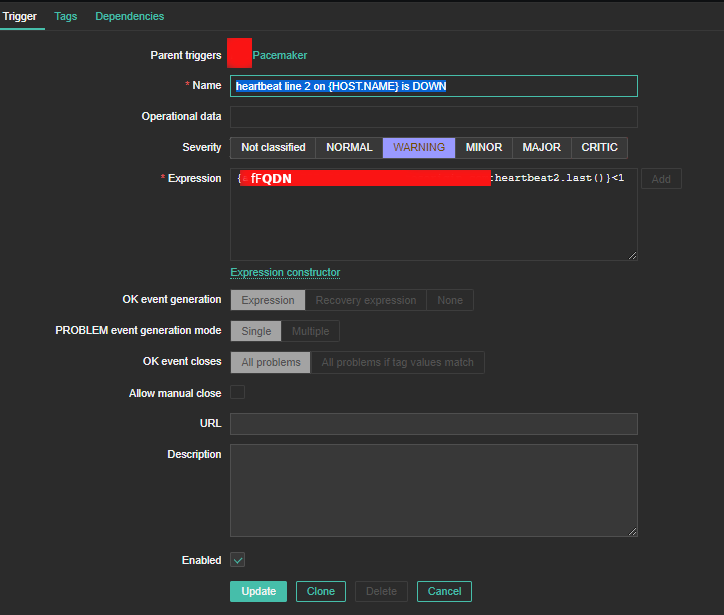
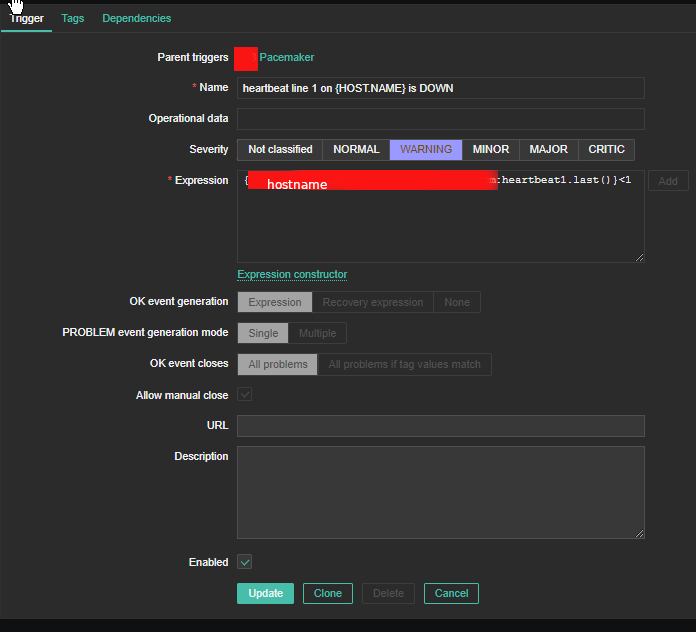
7. Create triggers that will be generating the Alert

Create the required triggers as well

zabbix-heartbeat-check-screenshots/heartbeat2-line
Main thing to configure here in Zabbix is below expression

Expression: {FQDN:heartbeat2.last()}<1

triggers_heartbeat1

You can further configure Zabbix Alerts to mail yourself or send via Slack / MatterMost or Teams alarms in case of problems.

How to log every Linux executed command by every running system program to separte log via rsyslog for better server Security and audit trails

Wednesday, March 15th, 2023

snoopy-log-all-commands-on-linux-server-tux-logo

To keep a good eye on installed Debian Linux server security if you have to be PCI compliant (e.g. follow a high security) standards or you work in a company, where system security is crucial and any kind of security breach is untorrelated and in case of unexpected security holes exploited on running system processess listening on network peripherals (that malicious crackers) does to be able to easily identify what really happened e.g. do a Security RCA (Root Cause Analysis) for how this hack happened in order to mitigate it for future if possible capture the crackers and close the security hole the better, some kind of paranoid running program logging is required.

For such higher security systems, Linux / BSD / UNIX sysadmins can benefit from;

Snoopy command logger – a small library that logs all program executions on your Linux/BSD system.

Embedding snoopy into a running uptodate system is relatively easy, you either have to download the respective distribution package (in this particular article that would be Debian GNU / Linux) or for Linux distributions, that doesn't have the package integrated into the existing package repositories or externally available package repos, the code can be easily git cloned and installed from github snoopy program page following the README.md


However consider that snoopy run and logging the executed commands, make sure that if you use it you have rsyslogd configured to log to external logging server to make sure (someone did not manipulate the running system to avoid their actions being logged by snoopy, this is pointed by snoopy security disclaimer on the FAQ of official github snoopy project page, the page reads as so:

Security disclaimer
WARNING: Snoopy is not a reliable auditing solution.
Rogue users can easily manipulate environment to avoid their actions being logged by Snoopy. Consult this FAQ entry for more information.                


Most likely this warning is pointed out by the tool authors, in order to set the logging Tool creators free for any liability in case if someone uses the snoopy tool for some unauthorized logging
and sniffing of systems etc.

Before we proceed with the tool, install first for some clarity it is a good idea to know on what kind of Debian Linux you're about to install Snoopy command logger.

root@linux:~ # cat /etc/os-release
PRETTY_NAME="Debian GNU/Linux 11 (bullseye)"
NAME="Debian GNU/Linux"
VERSION_ID="11"
VERSION="11 (bullseye)"
VERSION_CODENAME=bullseye
ID=debian
HOME_URL="https://www.debian.org/"
SUPPORT_URL="https://www.debian.org/support"
BUG_REPORT_URL="https://bugs.debian.org/"


1. Prepare separate log file for snoopy that will keep log of every system command run by running processes visible by (ps -ef)

Next check the permissions user / group and read / write / executable flags with which the default generated rsyslog will be writting and set snoopy to whatever you would like it to write with

root@linux:~ # cat /etc/rsyslog.conf | grep "^\$File\|\$Umask"~
$FileOwner root
$FileGroup adm
$FileCreateMode 0640


Create Rsyslog configuration for snoopy.log

root@linux:~ # cat << EOF | sudo tee /etc/rsyslog.d/01-snoopy.conf
# Send snoopy messages to a dedicated logfile
if (\$programname startswith "snoopy") then {
  action(type="omfile" fileOwner="root" fileGroup="root" fileCreateMode="0600" file="/var/log/snoopy.log")
  stop
}

EOF


To make sure that snoopy library will be preloaded after installation on next boot:

root@linux:~ # cat << EOF | sudo debconf-set-selections
snoopy snoopy/install-ld-preload boolean true
EOF


root@linux:~ # systemctl restart rsyslog


root@linux:~ # systemctl status rsyslog
● rsyslog.service – System Logging Service
     Loaded: loaded (/lib/systemd/system/rsyslog.service; enabled; vendor preset: enabled)
     Active: active (running) since Tue 2023-03-14 12:59:05 EET; 59min ago
TriggeredBy: ● syslog.socket
       Docs: man:rsyslogd(8)
             man:rsyslog.conf(5)
             https://www.rsyslog.com/doc/
   Main PID: 713745 (rsyslogd)
      Tasks: 6 (limit: 4654)
     Memory: 1.1M
        CPU: 548ms
     CGroup: /system.slice/rsyslog.service
             └─713745 /usr/sbin/rsyslogd -n -iNONE

мар 14 12:59:05 haproxy2 systemd[1]: Started System Logging Service.
мар 14 12:59:05 haproxy2 rsyslogd[713745]: warning: ~ action is deprecated, consider using the 'stop' statement instead [v8.210>
мар 14 12:59:05 haproxy2 rsyslogd[713745]: [198B blob data]
мар 14 12:59:05 haproxy2 rsyslogd[713745]: imuxsock: Acquired UNIX socket '/run/systemd/journal/syslog' (fd 3) from systemd.  [>
мар 14 12:59:05 haproxy2 rsyslogd[713745]: [origin software="rsyslogd" swVersion="8.2102.0" x-pid="713745" x-info="https://www.>
мар 14 13:19:05 haproxy2 rsyslogd[713745]: — MARK —
мар 14 13:39:05 haproxy2 rsyslogd[713745]: — MARK —


2. Install snoopy deb package and configure it

root@linux:~ # apt install snoopy
Четене на списъците с пакети… Готово
Изграждане на дървото със зависимости… Готово
Четене на информацията за състоянието… Готово
Следните пакети са били инсталирани автоматично и вече не са необходими:
  bsdmainutils cpp-8 geoip-database libasan5 libbind9-161 libcroco3 libdns1104 libdns1110 libevent-core-2.1-6
  libevent-pthreads-2.1-6 libgdk-pixbuf-xlib-2.0-0 libgdk-pixbuf2.0-0 libgeoip1 libicu63 libisc1100 libisc1105 libisccc161
  libisccfg163 libisl19 liblwres161 libmpdec2 libmpx2 libperl5.28 libpython2-stdlib libpython2.7-minimal libpython2.7-stdlib
  libpython3.7-minimal libpython3.7-stdlib libreadline7 netcat-traditional node-ansi-align node-arrify node-bluebird
  node-boxen node-builtin-modules node-call-limit node-camelcase node-cli-boxes node-cliui node-co node-concat-stream
  node-config-chain node-cross-spawn node-cyclist node-decamelize node-decompress-response node-deep-extend node-detect-indent
  node-detect-newline node-duplexer3 node-duplexify node-editor node-end-of-stream node-errno node-execa node-find-up
  node-flush-write-stream node-from2 node-fs-vacuum node-get-caller-file node-get-stream node-got node-has-symbol-support-x
  node-has-to-string-tag-x node-import-lazy node-invert-kv node-is-buffer node-is-builtin-module node-is-npm node-is-object
  node-is-plain-obj node-is-retry-allowed node-is-stream node-isurl node-json-buffer node-kind-of node-latest-version
  node-lazy-property node-lcid node-libnpx node-locate-path node-lowercase-keys node-mem node-merge-stream node-mimic-fn
  node-mimic-response node-minimist node-mississippi node-node-uuid node-npm-run-path node-os-locale node-p-cancelable
  node-p-finally node-p-limit node-p-locate node-p-timeout node-package-json node-parallel-transform node-path-exists
  node-path-is-inside node-prepend-http node-proto-list node-prr node-pump node-pumpify node-qw node-rc
  node-registry-auth-token node-registry-url node-require-directory node-require-main-filename node-semver-diff node-sha
  node-shebang-command node-shebang-regex node-slide node-sorted-object node-stream-each node-stream-iterate node-stream-shift
  node-strip-eof node-strip-json-comments node-term-size node-through2 node-timed-out node-typedarray node-uid-number
  node-unpipe node-url-parse-lax node-url-to-options node-which-module node-widest-line node-wrap-ansi node-xdg-basedir
  node-xtend node-y18n node-yargs node-yargs-parser perl-modules-5.28 python-pkg-resources python2 python2-minimal python2.7
  python2.7-minimal python3.7-minimal

Използвайте „apt autoremove“ за да ги премахнете.
Следните НОВИ пакети ще бъдат инсталирани:
  snoopy
0 актуализирани, 1 нови инсталирани, 0 за премахване и 1 без промяна.
Необходимо е да се изтеглят 46,0 kB архиви.
След тази операция ще бъде използвано 124 kB допълнително дисково пространство.
Изт:1 http://deb.debian.org/debian bullseye/main amd64 snoopy amd64 2.4.12-1 [46,0 kB]
Изтеглени 46,0 kB за 0с (93,2 kB/сек)
Предварително настройване на пакети …


Selecting previously unselected package snoopy.
(Reading database … 56067 files and directories currently installed.)
Preparing to unpack …/snoopy_2.4.12-1_amd64.deb ...
Unpacking snoopy (2.4.12-1) …
Setting up snoopy (2.4.12-1) …
Processing triggers for libc-bin (2.31-13+deb11u5) …

root@linux:/etc# ls -al /var/log/snoopy.log
-rw——- 1 root root 14472 14 мар 13:40 /var/log/snoopy.log

Any specific configuration for snoopy can be tuned through /etc/snoopy.ini

Now you will find all the commands executed by all monitored running processes in /var/log/snoopy.

root@linux:/etc# tail -30 /var/log/snoopy.log
Mar 14 12:59:32 haproxy2 snoopy[713804]: [login:root ssh:(192.168.0.1 62796 192.168.0.210 22) sid:713792 tty:/dev/pts/2 (0/root) uid:root(0)/root(0) cwd:/]: ldconfig
Mar 14 12:59:32 haproxy2 snoopy[713806]: [login:zabbix ssh:((undefined)) sid:682168 tty:(none) ((none)/(none)) uid:zabbix(108)/zabbix(108) cwd:/]: who
Mar 14 12:59:32 haproxy2 snoopy[713807]: [login:zabbix ssh:((undefined)) sid:682168 tty:(none) ((none)/(none)) uid:zabbix(108)/zabbix(108) cwd:/]: wc -l
Mar 14 13:00:07 haproxy2 snoopy[713815]: [login:root ssh:((undefined)) sid:713815 tty:(none) ((none)/(none)) uid:root(0)/root(0) cwd:/usr/lib/sysstat]: /usr/lib/sysstat/sadc -F -L -S DISK 1 1 /var/log/sysstat
Mar 14 13:00:32 haproxy2 snoopy[713823]: [login:zabbix ssh:((undefined)) sid:682168 tty:(none) ((none)/(none)) uid:zabbix(108)/zabbix(108) cwd:/]: who
Mar 14 13:00:32 haproxy2 snoopy[713824]: [login:zabbix ssh:((undefined)) sid:682168 tty:(none) ((none)/(none)) uid:zabbix(108)/zabbix(108) cwd:/]: wc -l
Mar 14 13:01:32 haproxy2 snoopy[713834]: [login:zabbix ssh:((undefined)) sid:682168 tty:(none) ((none)/(none)) uid:zabbix(108)/zabbix(108) cwd:/]: who
Mar 14 13:01:32 haproxy2 snoopy[713835]: [login:zabbix ssh:((undefined)) sid:682168 tty:(none) ((none)/(none)) uid:zabbix(108)/zabbix(108) cwd:/]: wc -l
Mar 14 13:02:32 haproxy2 snoopy[713843]: [login:zabbix ssh:((undefined)) sid:682168 tty:(none) ((none)/(none)) uid:zabbix(108)/zabbix(108) cwd:/]: who
Mar 14 13:02:32 haproxy2 snoopy[713844]: [login:zabbix ssh:((undefined)) sid:682168 tty:(none) ((none)/(none)) uid:zabbix(108)/zabbix(108) cwd:/]: wc -l
Mar 14 13:03:32 haproxy2 snoopy[713855]: [login:zabbix ssh:((undefined)) sid:682168 tty:(none) ((none)/(none)) uid:zabbix(108)/zabbix(108) cwd:/]: who
Mar 14 13:03:32 haproxy2 snoopy[713856]: [login:zabbix ssh:((undefined)) sid:682168 tty:(none) ((none)/(none)) uid:zabbix(108)/zabbix(108) cwd:/]: wc -l
Mar 14 13:04:32 haproxy2 snoopy[713868]: [login:zabbix ssh:((undefined)) sid:682168 tty:(none) ((none)/(none)) uid:zabbix(108)/zabbix(108) cwd:/]: who


3. Set up logrotation (archiving) for snoopy logs

root@linux:/etc# vim /etc/logrotate.d/snoopy    


/var/log/snoopy.log {
        daily
        rotate 30
        compress
        delaycompress
        notifempty
        create 640 root adm

}
 

If you want to test logrotation without actually rotating the file:               

root@linux:/etc# logrotate –debug –force /etc/logrotate.d/snoopy   
  log needs rotating
rotating log /var/log/snoopy.log, log->rotateCount is 30
dateext suffix '-20230314'
glob pattern '-[0-9][0-9][0-9][0-9][0-9][0-9][0-9][0-9]'
previous log /var/log/snoopy.log.1 does not exist
renaming /var/log/snoopy.log.30.gz to /var/log/snoopy.log.31.gz (rotatecount 30, logstart 1, i 30),


renaming /var/log/snoopy.log.1.gz to /var/log/snoopy.log.2.gz (rotatecount 30, logstart 1, i 1),
renaming /var/log/snoopy.log.0.gz to /var/log/snoopy.log.1.gz (rotatecount 30, logstart 1, i 0),
log /var/log/snoopy.log.31.gz doesn't exist — won't try to dispose of it
renaming /var/log/snoopy.log to /var/log/snoopy.log.1
creating new /var/log/snoopy.log mode = 0640 uid = 0 gid = 4


4. Monitoring only selected applications  executed commands with snoopy                                                                             

By default snoopy after installed will set itself to monitor all kind of running processes on the system is done by preloading the ldconfig's (libcld.so.preload

root@haproxy2:/etc# cat /etc/ld.so.preload
/lib/x86_64-linux-gnu/libsnoopy.so

If you want to monitor a concrete application and not log everything from the running processes in process list, comment this out this line run ldconfig command

Then to any concrete application you would like to monitor with snoopy add to its init script either /etc/init.d/app_init_script or to systemctl's start script before the application binary program run:

export LD_PRELOAD=/lib/snoopy.so


  As per the README states


 Snoopy is placed in /etc/ld.so.preload to trap all occurrences of exec, if 
 you wish to monitor only certain applications you can do so through the    
 LD_PRELOAD environment variable.
Simply set it to /lib/snoopy.so before  loading the application.

For example

 # export LD_PRELOAD=/lib/snoopy.so                                           
 # lynx http://example.com/                           


Monitoring chronyd time service is synchronized, get additional time server values with Zabbix userparameter script

Monday, March 21st, 2022

monitoring-chronyc-time-server-synchronization-zabbix-logo

If you''re running a server infrastructure and your main monitoring system is Zabbix. Then a vital check you might want to setup is to monitor the server time synchronization to a central server. In newer Linux OS-es ntpd time server is started to be used lesser and many modern Linux distributions used in the corporate realm are starting to recommend using chrony as a time synchronization client / server.

In this article, I'll show you how you can quickly setup monitoring of chronyd process and monitoring whether the time is successfully synchronizing with remote Chronyd time server. This will be done with a tiny one liner shell script setup as userparameter It is relatively easy then to setup an Action Alert


1. Create userparameter script to send parsed chronyd time synchronization to Zabbix Server

chronyc tracking provides plenty of useful data which can give many details about info such as offset, skew, root delay, stratum, update interval.

[root@server: ~]# chronyc tracking
Reference ID    : 0A32EF0B (fkf-intp01.intcs.meshcore.net)
Stratum         : 3
Ref time (UTC)  : Fri Mar 18 12:42:31 2022
System time     : 0.000032544 seconds fast of NTP time
Last offset     : +0.000031102 seconds
RMS offset      : 0.000039914 seconds
Frequency       : 3.037 ppm slow
Residual freq   : +0.000 ppm
Skew            : 0.023 ppm
Root delay      : 0.017352410 seconds
Root dispersion : 0.004285847 seconds
Update interval : 1041.6 seconds
Leap status     : Normal

[root@server zabbix_agentd.d]# cat userparameter_chrony.conf 
UserParameter=chrony.json,chronyc -c tracking | sed -e s/'^'/'{"chrony":[“‘/g -e s/’$’/'”]}'/g -e s/','/'","'/g
[root@server zabbix_agentd.d]#

The -c option passed to chronyc is printing the chronyc tracking command ouput data in comma-separated values ( CSV ) format.

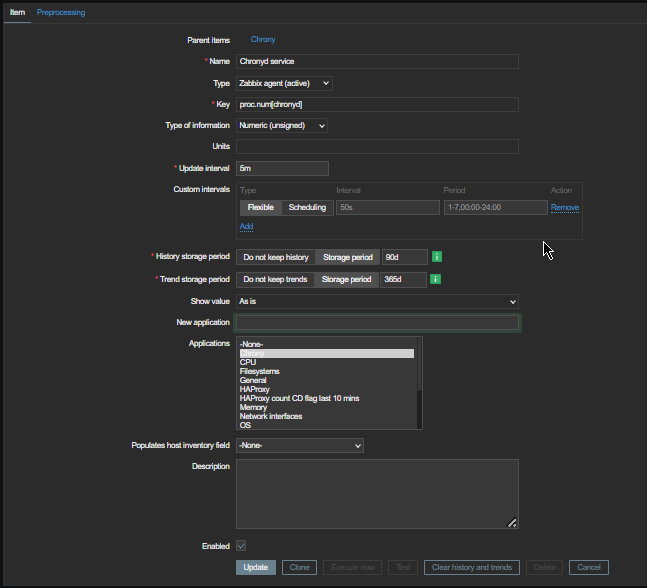
2. Create Necessery Item key to get chronyd processes and catch the userparameter data


  • First lets create a an Item key to calculate the chronyd daemon proc.num
    proc.num – simply returns the number of processes in the process list just like a simple
    pgrep servicename command does.


monitroing-chronyc_zabbix_item_report_to-zabbix

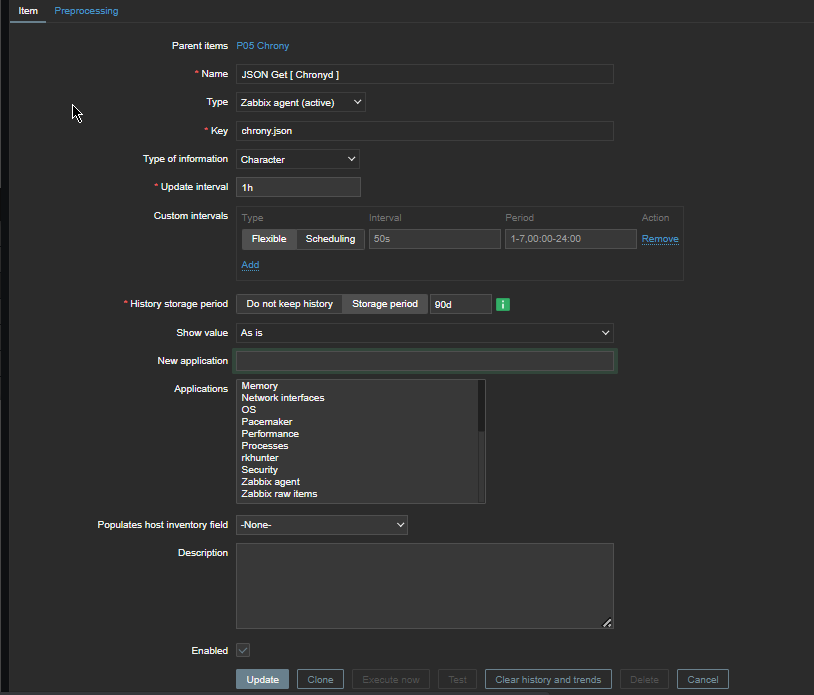
Second lets create the Item for the userparameter script, the chrony.json key should be the same as the key given in the userparameter script.

obtain-chronyc-statistic-variables-from-remote-chronyd-to-zabbix-windows

Create Chrony Zabbix Triggers 
 

Expression 

{server-host:proc.num[chronyd].last()}<1


will be triggered if the process of chronyd on the server is less than 1


chronyc_monitoring_process-is-not-running-screenshot

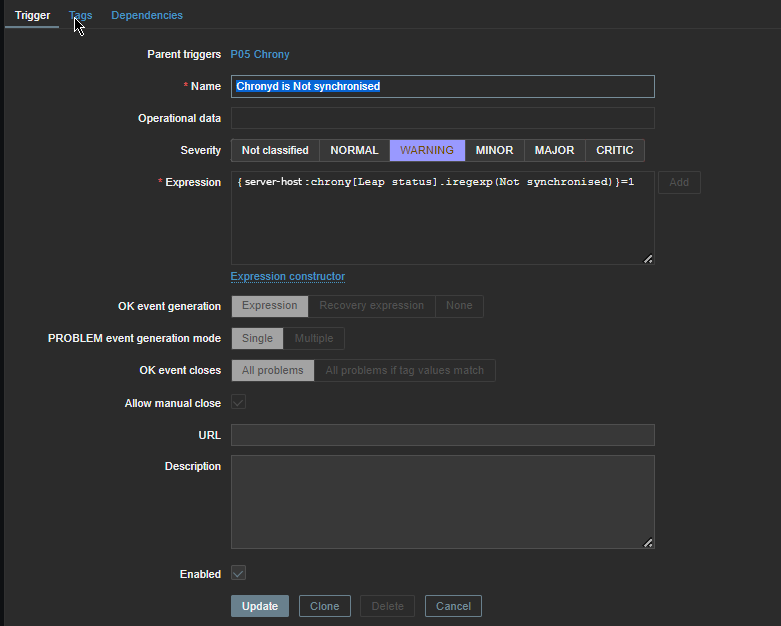
Next configure

{server-host:chrony[Leap status].iregexp[Not synchronised) ]=1


to trigger Alert Chronyd is Not synchronized if the Expression check occurs.

chronyd-is-not-synchronized-trigger-iregexp

Reload the zabbix-agent on the server
 

To make zabbix-agent locally installed on the machine read the userparameter into memory  (in my case this is zabbix-agent-4.0.28-1.el8.x86_64) installed on Redhat 8.3 (Ootpa), you have to restart it.

[root@server: ~]# systemctl restart zabbix-agent
[root@server: ~]# systemctl status zabbix-agent

● zabbix-agent.service – Zabbix Agent
   Loaded: loaded (/usr/lib/systemd/system/zabbix-agent.service; enabled; vendor preset: disabled)
   Active: active (running) since Thu 2021-12-16 16:41:02 CET; 3 months 0 days ago
 Main PID: 862165 (zabbix_agentd)
    Tasks: 6 (limit: 23662)
   Memory: 20.6M
   CGroup: /system.slice/zabbix-agent.service
           ├─862165 /usr/sbin/zabbix_agentd -c /etc/zabbix/zabbix_agentd.conf
           ├─862166 /usr/sbin/zabbix_agentd: collector [idle 1 sec]
           ├─862167 /usr/sbin/zabbix_agentd: listener #1 [waiting for connection]
           ├─862168 /usr/sbin/zabbix_agentd: listener #2 [waiting for connection]
           ├─862169 /usr/sbin/zabbix_agentd: listener #3 [waiting for connection]
           └─862170 /usr/sbin/zabbix_agentd: active checks #1 [idle 1 sec]

Warning: Journal has been rotated since unit was started. Log output is incomplete or unavailable.


In a short while you should be seeing in the chrony.json key History data fed by the userparameter Script.

In Zabbix Latest data, you will see plenty of interesting time synchronization data get reported such as Skew, Stratum, Root Delay, Update Interval, Frequency etc.

chronyd-zabbix-reported-time-synchronization-offset-leap-residual-freq-root-delay-screenshot

To have an email Alerting further, go and setup a new Zabbix Action based on the Trigger with your likings and you're done. 
The tracked machine will be in zabbix to make sure your OS clock is not afar from the time server. Repeat the same steps if you need to track chronyd is up running and synchronized on few machines, or if you have to make it for dozens setup a Zabbix template.

Monitor service log is continously growing with Zabbix on Windows with batch userparameter script and trigger Alert if log is unchanged

Thursday, March 17th, 2022

monitor-if-log-file-is-growing-with-zabbix-zabbix-userparameter-script-howto

Recently we had an inteteresting Monitoring work task to achieve. We have an Application that is constantly simulating encrypted connections traffic to a remote side machine and sending specific data on TCP/IP ports.
Communiucation between App Server A -> App Server B should be continous and if all is working as expected App Server A messages output are logged in the Application log file on the machine which by the way Runs
Windows Server 2020.

Sometimes due to Network issues this constant reconnections from the Application S. A to the remote checked machine TCP/IP ports gets interrupted due to LAN issues or a burned Network Switch equipment, misconfiguration on the network due to some Network admin making stoopid stuff etc..

Thus it was important to Monitor somehow whether the log is growing or not and feed the output of whether Application log file is growing or it stuck to a Central Zabbix Server. 
To be able to better understand the task, lets divide the desired outcome in few parts on required:

1. Find The latest file inside a folder C:\Path-to-Service\Monitoring\Log\
2. Open the and check it is current logged records and log the time
3. Re-open file in a short while and check whether in few seconds new records are written
4. Report the status out to Zabbix
5. Make Zabbix Item / Trigger / Action in case if monitored file is not growing

In below article I'll briefly explain how Monitoring a Log on a Machine for growing was implemented using a pure good old WIN .BAT (.batch) script and Zabbix Userparameter key


1. Enable userparameter script for Local Zabbix-Agent on the Windows 10 Server Host


Edit Zabbix config file usually on Windows Zabbix installs file is named:

zabbix_agentd.win ]


Uncomment the following lines to enable userparameter support for zabbix-agentd:


# Include=c:\zabbix\zabbix_agentd.userparams.conf

Include=c:\zabbix\zabbix_agentd.conf.d\

# Include=c:\zabbix\zabbix_agentd.conf.d\*.conf


2. Create folders for userparameter script and for the userparameter.conf

Before creating userparameter you can to create the folder and grant permissions

Folder name under C:\Zabbix -> zabbix_agentd.conf.d

If you don't want to use Windows Explorer) but do it via cmd line:

C:\Users\LOGUser> mkdir \Zabbix\zabbix_agentd.conf\
C:\User\LOGUser> mkdir \Zabbix\zabbix_scripts\


3. Create Userparameter with some name file ( Userparameter-Monitor-Grow.conf )

In the directory C:\Zabbix\zabbix_agentd.conf.d you should create a config file like:
Userparameter-Monitor-Grow.conf and in it you should have a standard userparameter key and script so file content is:

UserParameter=service.check,C:\Zabbix\zabbix_scripts\GROW_LOG_MONITOR-USERPARAMETER.BAT


4. Create the Batch script that will read the latest file in the service log folder and will periodically check and report to zabbix that file is changing

notepad C:\Zabbix\zabbix_scripts\GROW_LOG_MONITOR-USERPARAMETER.BAT

REM "SCRIPT MONITOR IF FILE IS GROWING OR NOT"
@echo off

set work_dir=C:\Path-to-Service\Monitoring\Log\

set client=client Name

set YYYYMMDD=%DATE:~10,4%%DATE:~4,2%%DATE:~7,2%

set name=csv%YYYYMMDD%.csv

set mytime=%TIME:~0,8%

for %%I in (..) do set CurrDirName=%%~nxI


setlocal EnableDelayedExpansion

set "line1=findstr /R /N "^^" %work_dir%\output.csv | find /C ":""


for /f %%a in ('!line1!') do set number1=%%a

set "line2=findstr /R /N "^^" %work_dir%\%name% | find /C ":""


for /f %%a in ('!line2!') do set number2=%%a


IF  %number1% == %number2% (

echo %YYYYMMDD% %mytime% MAJOR the log is not incrementing for %client%

echo %YYYYMMDD% %mytime% MAJOR the log is not incrementing for %client% >> monitor-grow_err.log

) ELSE (

echo %YYYYMMDD% %mytime% NORMAL the log is incrementing for %client%

SETLOCAL DisableDelayedExpansion

del %work_dir%\output.csv

FOR /F "usebackq delims=" %%a in (`"findstr /n ^^ %work_dir%\%name%"`) do (

    set "var=%%a"

    SETLOCAL EnableDelayedExpansion

    set "var=!var:*:=!"

    echo(!var! >> %work_dir%\output.csv

    ENDLOCAL

)

)


To download GROW_LOG_MONITOR-USERPARAMETER.BAT click here.
The script needs to have configured the path to directory containing multiple logs produced by the Monitored Application.
As prior said it will, list the latest created file based on DATE timestamp in the folder will output a simple messages:

If the log file is being fed with data the script will output to output.csv messages continuously, either:

%%mytime%% NORMAL the log is incrementing for %%client%%

Or if the Monitored application log is not writting anything for a period it will start writting messages

%%mytime%%mytime MAJOR the log is not incrementing for %client%

The messages will also be sent in Zabbix.

Before saving the script make sure you modify the Full Path location to the Monitored file for growing, i.e.:

set work_dir=C:\Path-to-Service\Monitoring\Log\


5. Create The Zabbix Item

Set whatever service.check name you would like and a check interval to fetch the info from the userparameter (if you're dealing with very large log files produced by Monitored log of application, then 10 minutes might be too frequent, in most cases 10 minutes should be fine)
monitor-if-log-grows-windows-zabbix-item-service-check-screenshot
 

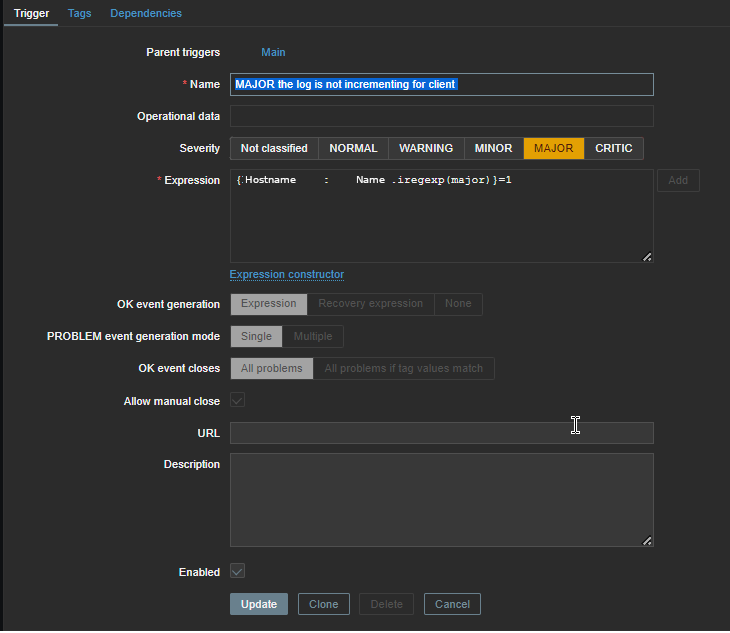
6. Create Zabbix Trigger


You will need a Trigger something similar to below:

Now considering that zabbix server receives correctly data from the client and the monitored log is growing you should in Zabbix:

%%mytime%% NORMAL the log is incrementing for %%client%%


7. Lastly create an Action to send Email Alert if log is not growing

Linux: Howto Fix “N: Repository ‘http://deb.debian.org/debian buster InRelease’ changed its ‘Version’ value from ‘10.9’ to ‘10.10’” error to resolve apt-get release update issue

Friday, August 13th, 2021

Linux's surprises and disorganization is continuously growing day by day and I start to realize it is becoming mostly impossible to support easily this piece of hackware bundled together.
Usually so far during the last 5 – 7 years, I rarely had any general issues with using:

 apt-get update && apt-get upgrade && apt-get dist-upgrade 

to raise a server's working stable Debian Linux version packages e.g. version X.Y to verzion X.Z (for example up the release from Debian Jessie from 8.1 to 8.2). 

Today I just tried to follow this well known and established procedure that, of course nowdays is better to be done with the newer "apt" command instead with the legacy "apt-get"
And the set of 


# apt-get update && apt-get upgrade && apt-get dist-upgrade


has triggered below shitty error:
 

root@zabbix:~# apt-get update && apt-get upgrade
Get:1 http://security.debian.org buster/updates InRelease [65.4 kB]
Get:2 http://deb.debian.org/debian buster InRelease [122 kB]
Get:3 http://security.debian.org buster/updates/non-free Sources [688 B]
Get:4 http://repo.zabbix.com/zabbix/5.0/debian buster InRelease [7096 B]
Get:5 http://security.debian.org buster/updates/main Sources [198 kB]
Get:6 http://security.debian.org buster/updates/main amd64 Packages [300 kB]
Get:7 http://security.debian.org buster/updates/main Translation-en [157 kB]
Get:8 http://security.debian.org buster/updates/non-free amd64 Packages [556 B]
Get:9 http://deb.debian.org/debian buster/main Sources [7836 kB]
Get:10 http://repo.zabbix.com/zabbix/5.0/debian buster/main Sources [1192 B]
Get:11 http://repo.zabbix.com/zabbix/5.0/debian buster/main amd64 Packages [4785 B]
Get:12 http://deb.debian.org/debian buster/non-free Sources [85.7 kB]
Get:13 http://deb.debian.org/debian buster/contrib Sources [42.5 kB]
Get:14 http://deb.debian.org/debian buster/main amd64 Packages [7907 kB]
Get:15 http://deb.debian.org/debian buster/main Translation-en [5968 kB]
Get:16 http://deb.debian.org/debian buster/main amd64 Contents (deb) [37.3 MB]
Get:17 http://deb.debian.org/debian buster/contrib amd64 Packages [50.1 kB]
Get:18 http://deb.debian.org/debian buster/non-free amd64 Packages [87.7 kB]
Get:19 http://deb.debian.org/debian buster/non-free Translation-en [88.9 kB]
Get:20 http://deb.debian.org/debian buster/non-free amd64 Contents (deb) [861 kB]
Fetched 61.1 MB in 22s (2774 kB/s)
Reading package lists… Done
N: Repository 'http://deb.debian.org/debian buster InRelease' changed its 'Version' value from '10.9' to '10.10'


As I used to realize nowdays, as Linux started originally as 'Hackers' operating system, its legacy is just one big hack and everything from simple maintenance up to the higher and more sophisticated things requires a workaround 'hack''.


This time the hack to resolve error:
 

N: Repository 'http://deb.debian.org/debian buster InRelease' changed its 'Version' value from '10.9' to '10.10'


is up to running cmd:
 

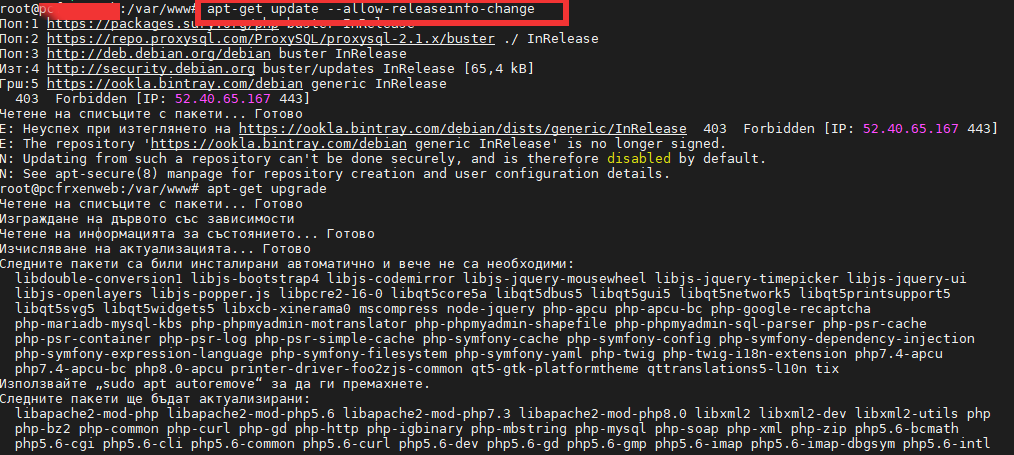
debian-server:~# apt-get update –allow-releaseinfo-change
Поп:1 http://ftp.de.debian.org/debian buster-backports InRelease
Поп:2 http://ftp.debian.org/debian stable InRelease
Поп:3 http://security.debian.org stable/updates InRelease
Изт:5 https://packages.sury.org/php buster InRelease [6837 B]
Изт:6 https://download.docker.com/linux/debian stretch InRelease [44,8 kB]
Изт:7 https://packages.sury.org/php buster/main amd64 Packages [317 kB]
Игн:4 https://attic.owncloud.org/download/repositories/production/Debian_10  InRelease
Изт:8 https://download.owncloud.org/download/repositories/production/Debian_10  Release [964 B]
Изт:9 https://packages.sury.org/php buster/main i386 Packages [314 kB]
Изт:10 https://download.owncloud.org/download/repositories/production/Debian_10  Release.gpg [481 B]
Грш:10 https://download.owncloud.org/download/repositories/production/Debian_10  Release.gpg
  Следните подписи са невалидни: DDA2C105C4B73A6649AD2BBD47AE7F72479BC94B
Грш:11 https://ookla.bintray.com/debian generic InRelease
  403  Forbidden [IP: 52.39.193.126 443]
Четене на списъците с пакети… Готово
N: Repository 'https://packages.sury.org/php buster InRelease' changed its 'Suite' value from '' to 'buster'
W: An error occurred during the signature verification. The repository is not updated and the previous index files will be used. GPG error: https://download.owncloud.org/download/repositories/production/Debian_10  Release: 

apt-get-update-allow-releaseinfo-change-debian-linux-screenshot

Onwards to upgrade the system up to the latest .deb packages, as usual run:

# apt-get -y update && apt-get upgrade -y


and updates should be applied as usual with some prompts on whether you prefer to keep or replace existing service configuration and some information on some general changes that might affect your installed services. In a few minutes and few prompts hopefully your Debian OS should be up to the latest stable.

How to calculate connections from IP address with shell script and log to Zabbix graphic

Thursday, March 11th, 2021

We had to test the number of connections incoming IP sorted by its TCP / IP connection state.

For example:

TIME_WAIT, ESTABLISHED, LISTEN etc.


The reason behind is sometimes the IP address '192.168.0.1' does create more than 200 connections, a Cisco firewall gets triggered and the connection for that IP is filtered out. To be able to know in advance that this problem is upcoming. a Small userparameter script is set on the Linux servers, that does print out all connections from IP by its STATES sorted out.


The script is calc_total_ip_match_zabbix.sh is below:

#!/bin/bash
#  check ESTIMATED / FIN_WAIT etc. netstat output for IPs and calculate total
# UserParameter=count.connections,(/usr/local/bin/calc_total_ip_match_zabbix.sh)
CHECK_IP='192.168.0.1';
f=0; 


for i in $(netstat -nat | grep "$CHECK_IP" | awk '{print $6}' | sort | uniq -c | sort -n); do

echo -n "$i ";
f=$((f+i));
done;
echo
echo "Total: $f"


root@pcfreak:/bashscripts# ./calc_total_ip_match_zabbix.sh 
1 TIME_WAIT 2 ESTABLISHED 3 LISTEN 

Total: 6


root@pcfreak:/bashscripts# ./calc_total_ip_match_zabbix.sh 
2 ESTABLISHED 3 LISTEN 
Total: 5


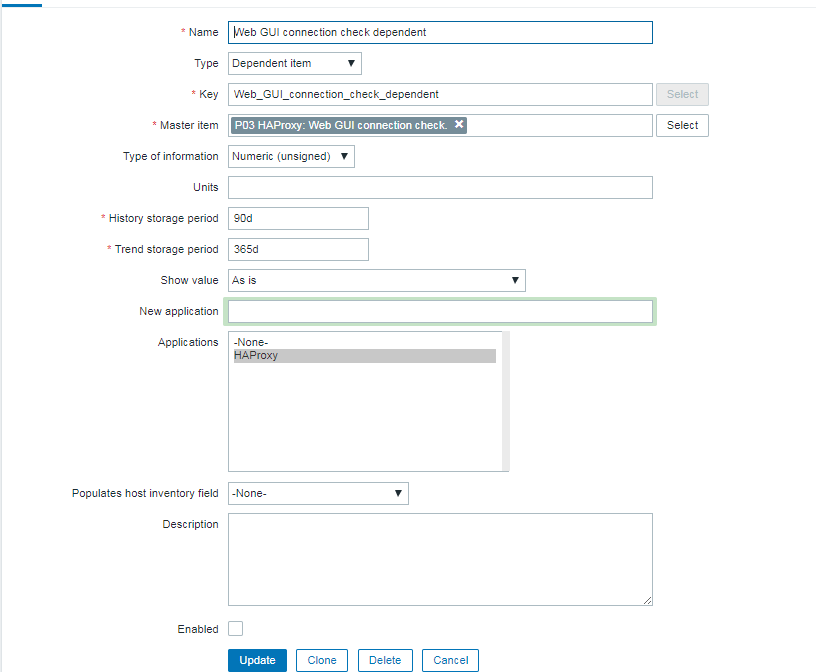
To make process with Zabbix it is necessery to have an Item created and a Depedent Item.

images/zabbix-webgui-connection-check1


webguiconnection-check1

webguiconnection-check1
 

webgui-connection-check2-item

images/webguiconnection-check1

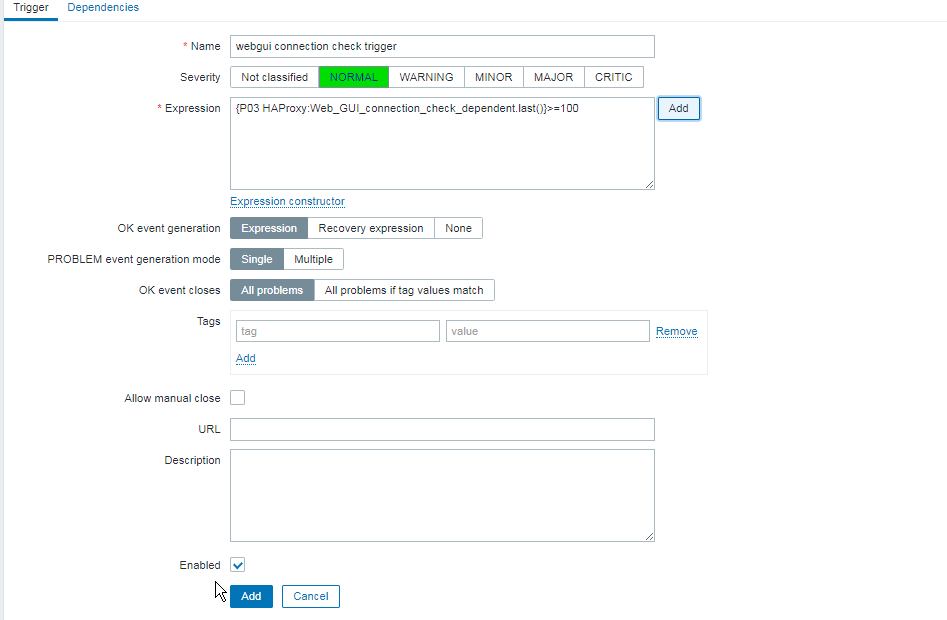
Finally create a trigger to trigger alarm if you have more than or eqaul to 100 Total overall connections.


images/zabbix-webgui-connection-check-trigger

The Zabbix userparameter script should be as this:
cat /etc/zabbix/zabbix_agentd.d/userparameter_webgui_conn.conf
UserParameter=count.connections,(/usr/local/bin/webgui_conn_track.sh)
 

Some collleagues suggested more efficient shell script solution for suming the overall number of connections, below is less time consuming version of script, that can be used for the calculation.
 

#!/bin/bash -x
# show FIN_WAIT2 / ESTIMATED etc. and calcuate total
count=$(netstat -n | grep "192.168.0.1" | awk ' { print $6 } ' | sort -n | uniq -c | sort -nr)
total=$((${count// /+}))
echo "$count"
echo "Total:" "$total"


      2 ESTABLISHED
      1 TIME_WAIT
Total: 3


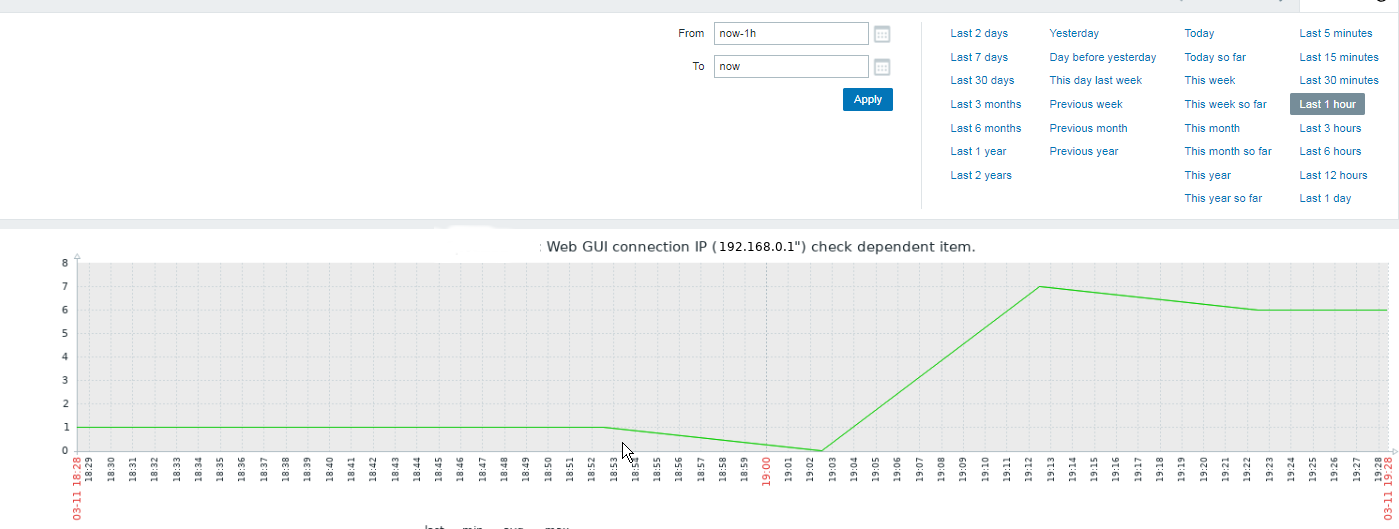
Below is the graph built with Zabbix showing all the fluctuations from connections from monitored IP.
ebgui-check_ip_graph

Monitoring Linux hardware Hard Drives / Temperature and Disk with lm_sensors / smartd / hddtemp and Zabbix Userparameter lm_sensors report script

Thursday, April 30th, 2020

monitoring-linux-hardware-with-software-temperature-disk-cpu-health-zabbix-userparameter-script

I'm part of a  SysAdmin Team that is partially doing some minor Zabbix imrovements on a custom corporate installed Zabbix in an ongoing project to substitute the previous HP OpenView monitoring for a bunch of Legacy Linux hosts.
As one of the necessery checks to have is regarding system Hardware, the task was to invent some simplistic way to monitor hardware with the Zabbix Monitoring tool.  Monitoring Bare Metal servers hardware of HP / Dell / Fujituse etc. servers  in Linux usually is done with a third party software provided by the Hardware vendor. But as this requires an additional services to run and sometimes is not desired. It was interesting to find out some alternative Linux native ways to do the System hardware monitoring.
Monitoring statistics from the system hardware components can be obtained directly from the server components with ipmi / ipmitool (for more info on it check my previous article Reset and Manage intelligent  Platform Management remote board article).
With ipmi
 hardware health info could be received straight from the ILO / IDRAC / HPMI of the server. However as often the Admin-Lan of the server is in a seperate DMZ secured network and available via only a certain set of routed IPs, ipmitool can't be used.

So what are the other options to use to implement Linux Server Hardware Monitoring?

The tools to use are perhaps many but I know of two which gives you most of the information you ever need to have a prelimitary hardware damage warning system before the crash, these are:
 

1. smartmontools (smartd)

Smartd is part of smartmontools package which contains two utility programs (smartctl and smartd) to control and monitor storage systems using the Self-Monitoring, Analysis and Reporting Technology system (SMART) built into most modern ATA/SATA, SCSI/SAS and NVMe disks

Disk monitoring is handled by a special service the package provides called smartd that does query the Hard Drives periodically aiming to find a warning signs of hardware failures.
The downside of smartd use is that it implies a little bit of extra load on Hard Drive read / writes and if misconfigured could reduce the the Hard disk life time.


linux:~#  /usr/sbin/smartctl -a /dev/sdb2
smartctl 6.6 2017-11-05 r4594 [x86_64-linux-4.19.0-5-amd64] (local build)
Copyright (C) 2002-17, Bruce Allen, Christian Franke, www.smartmontools.org

=== START OF INFORMATION SECTION ===
Device Model:     KINGSTON SA400S37240G
Serial Number:    50026B768340AA31
LU WWN Device Id: 5 0026b7 68340aa31
Firmware Version: S1Z40102
User Capacity:    240,057,409,536 bytes [240 GB]
Sector Size:      512 bytes logical/physical
Rotation Rate:    Solid State Device
Device is:        Not in smartctl database [for details use: -P showall]
ATA Version is:   ACS-3 T13/2161-D revision 4
SATA Version is:  SATA 3.2, 6.0 Gb/s (current: 3.0 Gb/s)
Local Time is:    Thu Apr 30 14:05:01 2020 EEST
SMART support is: Available – device has SMART capability.
SMART support is: Enabled

=== START OF READ SMART DATA SECTION ===
SMART overall-health self-assessment test result: PASSED

General SMART Values:
Offline data collection status:  (0x00) Offline data collection activity
                                        was never started.
                                        Auto Offline Data Collection: Disabled.
Self-test execution status:      (   0) The previous self-test routine completed
                                        without error or no self-test has ever
                                        been run.
Total time to complete Offline
data collection:                (  120) seconds.
Offline data collection
capabilities:                    (0x11) SMART execute Offline immediate.
                                        No Auto Offline data collection support.
                                        Suspend Offline collection upon new
                                        command.
                                        No Offline surface scan supported.
                                        Self-test supported.
                                        No Conveyance Self-test supported.
                                        No Selective Self-test supported.
SMART capabilities:            (0x0002) Does not save SMART data before
                                        entering power-saving mode.
                                        Supports SMART auto save timer.
Error logging capability:        (0x01) Error logging supported.
                                        General Purpose Logging supported.
Short self-test routine
recommended polling time:        (   2) minutes.
Extended self-test routine
recommended polling time:        (  10) minutes.

SMART Attributes Data Structure revision number: 1
Vendor Specific SMART Attributes with Thresholds:
ID# ATTRIBUTE_NAME          FLAG     VALUE WORST THRESH TYPE      UPDATED  WHEN_FAILED RAW_VALUE
  1 Raw_Read_Error_Rate     0x0032   100   100   000    Old_age   Always       –       100
  9 Power_On_Hours          0x0032   100   100   000    Old_age   Always       –       2820
 12 Power_Cycle_Count       0x0032   100   100   000    Old_age   Always       –       21
148 Unknown_Attribute       0x0000   100   100   000    Old_age   Offline      –       0
149 Unknown_Attribute       0x0000   100   100   000    Old_age   Offline      –       0
167 Unknown_Attribute       0x0000   100   100   000    Old_age   Offline      –       0
168 Unknown_Attribute       0x0012   100   100   000    Old_age   Always       –       0
169 Unknown_Attribute       0x0000   100   100   000    Old_age   Offline      –       0
170 Unknown_Attribute       0x0000   100   100   010    Old_age   Offline      –       0
172 Unknown_Attribute       0x0032   100   100   000    Old_age   Always       –       0
173 Unknown_Attribute       0x0000   100   100   000    Old_age   Offline      –       0
181 Program_Fail_Cnt_Total  0x0032   100   100   000    Old_age   Always       –       0
182 Erase_Fail_Count_Total  0x0000   100   100   000    Old_age   Offline      –       0
187 Reported_Uncorrect      0x0032   100   100   000    Old_age   Always       –       0
192 Power-Off_Retract_Count 0x0012   100   100   000    Old_age   Always       –       16
194 Temperature_Celsius     0x0022   034   052   000    Old_age   Always       –       34 (Min/Max 19/52)
196 Reallocated_Event_Count 0x0032   100   100   000    Old_age   Always       –       0
199 UDMA_CRC_Error_Count    0x0032   100   100   000    Old_age   Always       –       0
218 Unknown_Attribute       0x0032   100   100   000    Old_age   Always       –       0
231 Temperature_Celsius     0x0000   097   097   000    Old_age   Offline      –       97
233 Media_Wearout_Indicator 0x0032   100   100   000    Old_age   Always       –       2104
241 Total_LBAs_Written      0x0032   100   100   000    Old_age   Always       –       1857
242 Total_LBAs_Read         0x0032   100   100   000    Old_age   Always       –       1141
244 Unknown_Attribute       0x0000   100   100   000    Old_age   Offline      –       32
245 Unknown_Attribute       0x0000   100   100   000    Old_age   Offline      –       107
246 Unknown_Attribute       0x0000   100   100   000    Old_age   Offline      –       15940

SMART Error Log Version: 1
No Errors Logged

SMART Self-test log structure revision number 1
No self-tests have been logged.  [To run self-tests, use: smartctl -t]

Selective Self-tests/Logging not supported


2. hddtemp


Usually if smartd is used it is useful to also use hddtemp which relies on smartd data.
 The hddtemp program monitors and reports the temperature of PATA, SATA
 or SCSI hard drives by reading Self-Monitoring Analysis and Reporting
 Technology (S.M.A.R.T.)
information on drives that support this feature.
 

linux:~# /usr/sbin/hddtemp /dev/sda1
/dev/sda1: Hitachi HDS721050CLA360: 31°C
linux:~# /usr/sbin/hddtemp /dev/sdc6
/dev/sdc6: KINGSTON SV300S37A120G: 25°C
linux:~# /usr/sbin/hddtemp /dev/sdb2
/dev/sdb2: KINGSTON SA400S37240G: 34°C
linux:~# /usr/sbin/hddtemp /dev/sdd1
/dev/sdd1: WD Elements 10B8: S.M.A.R.T. not available


3. lm-sensors / i2c-tools 

 Lm-sensors is a hardware health monitoring package for Linux. It allows you
 to access information from temperature, voltage, and fan speed sensors.
i2c-tools
was historically bundled in the same package as lm_sensors but has been seperated cause not all hardware monitoring chips are I2C devices, and not all I2C devices are hardware monitoring chips.

The most basic use of lm-sensors is with the sensors command


linux:~# sensors
i350bb-pci-0600
Adapter: PCI adapter
loc1:         +55.0 C  (high = +120.0 C, crit = +110.0 C)


coretemp-isa-0000
Adapter: ISA adapter
Physical id 0:  +28.0 C  (high = +78.0 C, crit = +88.0 C)
Core 0:         +26.0 C  (high = +78.0 C, crit = +88.0 C)
Core 1:         +28.0 C  (high = +78.0 C, crit = +88.0 C)
Core 2:         +28.0 C  (high = +78.0 C, crit = +88.0 C)
Core 3:         +28.0 C  (high = +78.0 C, crit = +88.0 C)


On CentOS Linux useful tool is also  lm_sensors-sensord.x86_64 – A Daemon that periodically logs sensor readings to syslog or a round-robin database, and warns of sensor alarms.

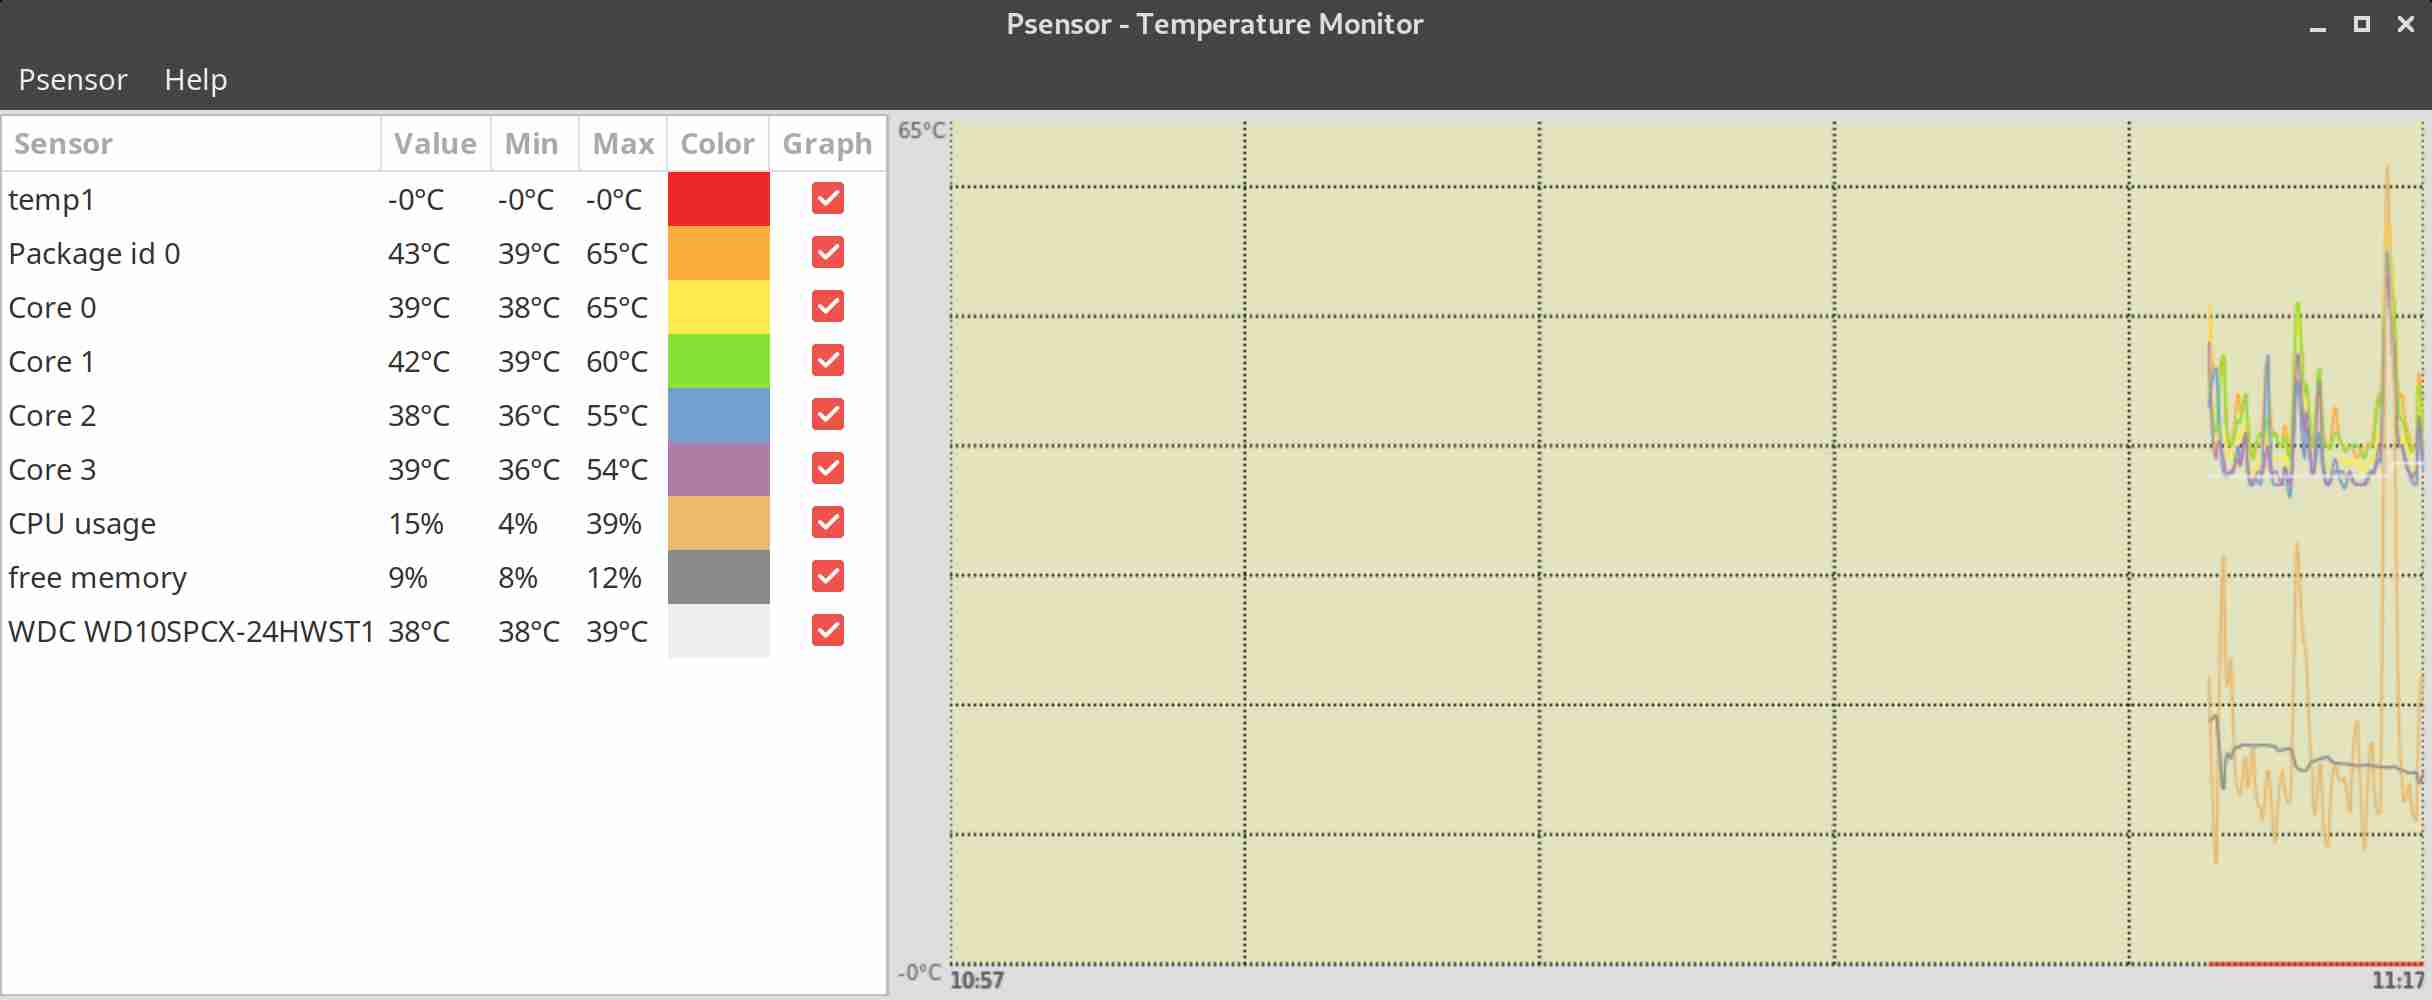
In Debian Linux there is also the psensors-server (an HTTP server providing JSON Web service which can be used by GTK+ Application to remotely monitor sensors) useful for developers
psesors-server

psensor-linux-graphical-tool-to-check-cpu-hard-disk-temperature-unix

If you have a Xserver installed on the Server accessed with Xclient or via VNC though quite rare,
You can use xsensors or Psensora GTK+ (Widget Toolkit for creating Graphical User Interface) application software.

With this 3 tools it is pretty easy to script one liners and use the Zabbix UserParameters functionality to send hardware report data to a Company's Zabbix Sserver, though Zabbix has already some templates to do so in my case, I couldn't import this templates cause I don't have Zabbix Super-Admin credentials, thus to work around that a sample work around is use script to monitor for higher and critical considered temperature.
Here is a tiny sample script I came up in 1 min time it can be used to used as 1 liner UserParameter and built upon something more complex.

SENSORS_HIGH=`sensors | awk '{ print $6 }'| grep '^+' | uniq`;
SENSORS_CRIT=`sensors | awk '{ print $9 }'| grep '^+' | uniq`; ;SENSORS_STAT=`sensors|grep -E 'Core\s' | awk '{ print $1" "$2" "$3 }' | grep "$SENSORS_HIGH|$SENSORS_CRIT"`;
if [ ! -z $SENSORS_STAT ]; then
echo 'Temperature HIGH';
else 
echo 'Sensors OK';
fi 

Of course there is much more sophisticated stuff to use for monitoring out there


Below script can be easily adapted and use on other Monitoring Platforms such as Nagios / Munin / Cacti / Icinga and there are plenty of paid solutions, but for anyone that wants to develop something from scratch just like me I hope this
article will be a good short introduction.
If you know some other Linux hardware monitoring tools, please share.