
I'm part of a SysAdmin Team that is partially doing some minor Zabbix imrovements on a custom corporate installed Zabbix in an ongoing project to substitute the previous HP OpenView monitoring for a bunch of Legacy Linux hosts.
As one of the necessery checks to have is regarding system Hardware, the task was to invent some simplistic way to monitor hardware with the Zabbix Monitoring tool. Monitoring Bare Metal servers hardware of HP / Dell / Fujituse etc. servers in Linux usually is done with a third party software provided by the Hardware vendor. But as this requires an additional services to run and sometimes is not desired. It was interesting to find out some alternative Linux native ways to do the System hardware monitoring.
Monitoring statistics from the system hardware components can be obtained directly from the server components with ipmi / ipmitool (for more info on it check my previous article Reset and Manage intelligent Platform Management remote board article).
With ipmi hardware health info could be received straight from the ILO / IDRAC / HPMI of the server. However as often the Admin-Lan of the server is in a seperate DMZ secured network and available via only a certain set of routed IPs, ipmitool can't be used.
So what are the other options to use to implement Linux Server Hardware Monitoring?
The tools to use are perhaps many but I know of two which gives you most of the information you ever need to have a prelimitary hardware damage warning system before the crash, these are:
1. smartmontools (smartd)
Smartd is part of smartmontools package which contains two utility programs (smartctl and smartd) to control and monitor storage systems using the Self-Monitoring, Analysis and Reporting Technology system (SMART) built into most modern ATA/SATA, SCSI/SAS and NVMe disks.
Disk monitoring is handled by a special service the package provides called smartd that does query the Hard Drives periodically aiming to find a warning signs of hardware failures.
The downside of smartd use is that it implies a little bit of extra load on Hard Drive read / writes and if misconfigured could reduce the the Hard disk life time.
linux:~# /usr/sbin/smartctl -a /dev/sdb2
smartctl 6.6 2017-11-05 r4594 [x86_64-linux-4.19.0-5-amd64] (local build)
Copyright (C) 2002-17, Bruce Allen, Christian Franke, www.smartmontools.org
=== START OF INFORMATION SECTION ===
Device Model: KINGSTON SA400S37240G
Serial Number: 50026B768340AA31
LU WWN Device Id: 5 0026b7 68340aa31
Firmware Version: S1Z40102
User Capacity: 240,057,409,536 bytes [240 GB]
Sector Size: 512 bytes logical/physical
Rotation Rate: Solid State Device
Device is: Not in smartctl database [for details use: -P showall]
ATA Version is: ACS-3 T13/2161-D revision 4
SATA Version is: SATA 3.2, 6.0 Gb/s (current: 3.0 Gb/s)
Local Time is: Thu Apr 30 14:05:01 2020 EEST
SMART support is: Available – device has SMART capability.
SMART support is: Enabled
=== START OF READ SMART DATA SECTION ===
SMART overall-health self-assessment test result: PASSED
General SMART Values:
Offline data collection status: (0x00) Offline data collection activity
was never started.
Auto Offline Data Collection: Disabled.
Self-test execution status: ( 0) The previous self-test routine completed
without error or no self-test has ever
been run.
Total time to complete Offline
data collection: ( 120) seconds.
Offline data collection
capabilities: (0x11) SMART execute Offline immediate.
No Auto Offline data collection support.
Suspend Offline collection upon new
command.
No Offline surface scan supported.
Self-test supported.
No Conveyance Self-test supported.
No Selective Self-test supported.
SMART capabilities: (0x0002) Does not save SMART data before
entering power-saving mode.
Supports SMART auto save timer.
Error logging capability: (0x01) Error logging supported.
General Purpose Logging supported.
Short self-test routine
recommended polling time: ( 2) minutes.
Extended self-test routine
recommended polling time: ( 10) minutes.
SMART Attributes Data Structure revision number: 1
Vendor Specific SMART Attributes with Thresholds:
ID# ATTRIBUTE_NAME FLAG VALUE WORST THRESH TYPE UPDATED WHEN_FAILED RAW_VALUE
1 Raw_Read_Error_Rate 0x0032 100 100 000 Old_age Always – 100
9 Power_On_Hours 0x0032 100 100 000 Old_age Always – 2820
12 Power_Cycle_Count 0x0032 100 100 000 Old_age Always – 21
148 Unknown_Attribute 0x0000 100 100 000 Old_age Offline – 0
149 Unknown_Attribute 0x0000 100 100 000 Old_age Offline – 0
167 Unknown_Attribute 0x0000 100 100 000 Old_age Offline – 0
168 Unknown_Attribute 0x0012 100 100 000 Old_age Always – 0
169 Unknown_Attribute 0x0000 100 100 000 Old_age Offline – 0
170 Unknown_Attribute 0x0000 100 100 010 Old_age Offline – 0
172 Unknown_Attribute 0x0032 100 100 000 Old_age Always – 0
173 Unknown_Attribute 0x0000 100 100 000 Old_age Offline – 0
181 Program_Fail_Cnt_Total 0x0032 100 100 000 Old_age Always – 0
182 Erase_Fail_Count_Total 0x0000 100 100 000 Old_age Offline – 0
187 Reported_Uncorrect 0x0032 100 100 000 Old_age Always – 0
192 Power-Off_Retract_Count 0x0012 100 100 000 Old_age Always – 16
194 Temperature_Celsius 0x0022 034 052 000 Old_age Always – 34 (Min/Max 19/52)
196 Reallocated_Event_Count 0x0032 100 100 000 Old_age Always – 0
199 UDMA_CRC_Error_Count 0x0032 100 100 000 Old_age Always – 0
218 Unknown_Attribute 0x0032 100 100 000 Old_age Always – 0
231 Temperature_Celsius 0x0000 097 097 000 Old_age Offline – 97
233 Media_Wearout_Indicator 0x0032 100 100 000 Old_age Always – 2104
241 Total_LBAs_Written 0x0032 100 100 000 Old_age Always – 1857
242 Total_LBAs_Read 0x0032 100 100 000 Old_age Always – 1141
244 Unknown_Attribute 0x0000 100 100 000 Old_age Offline – 32
245 Unknown_Attribute 0x0000 100 100 000 Old_age Offline – 107
246 Unknown_Attribute 0x0000 100 100 000 Old_age Offline – 15940
SMART Error Log Version: 1
No Errors Logged
SMART Self-test log structure revision number 1
No self-tests have been logged. [To run self-tests, use: smartctl -t]
Selective Self-tests/Logging not supported
2. hddtemp
Usually if smartd is used it is useful to also use hddtemp which relies on smartd data.
The hddtemp program monitors and reports the temperature of PATA, SATA
or SCSI hard drives by reading Self-Monitoring Analysis and Reporting
Technology (S.M.A.R.T.) information on drives that support this feature.
linux:~# /usr/sbin/hddtemp /dev/sda1
/dev/sda1: Hitachi HDS721050CLA360: 31°C
linux:~# /usr/sbin/hddtemp /dev/sdc6
/dev/sdc6: KINGSTON SV300S37A120G: 25°C
linux:~# /usr/sbin/hddtemp /dev/sdb2
/dev/sdb2: KINGSTON SA400S37240G: 34°C
linux:~# /usr/sbin/hddtemp /dev/sdd1
/dev/sdd1: WD Elements 10B8: S.M.A.R.T. not available
3. lm-sensors / i2c-tools
Lm-sensors is a hardware health monitoring package for Linux. It allows you
to access information from temperature, voltage, and fan speed sensors.
i2c-tools was historically bundled in the same package as lm_sensors but has been seperated cause not all hardware monitoring chips are I2C devices, and not all I2C devices are hardware monitoring chips.
The most basic use of lm-sensors is with the sensors command
linux:~# sensors
i350bb-pci-0600
Adapter: PCI adapter
loc1: +55.0 C (high = +120.0 C, crit = +110.0 C)
coretemp-isa-0000
Adapter: ISA adapter
Physical id 0: +28.0 C (high = +78.0 C, crit = +88.0 C)
Core 0: +26.0 C (high = +78.0 C, crit = +88.0 C)
Core 1: +28.0 C (high = +78.0 C, crit = +88.0 C)
Core 2: +28.0 C (high = +78.0 C, crit = +88.0 C)
Core 3: +28.0 C (high = +78.0 C, crit = +88.0 C)
On CentOS Linux useful tool is also lm_sensors-sensord.x86_64 – A Daemon that periodically logs sensor readings to syslog or a round-robin database, and warns of sensor alarms.
In Debian Linux there is also the psensors-server (an HTTP server providing JSON Web service which can be used by GTK+ Application to remotely monitor sensors) useful for developers
psesors-server
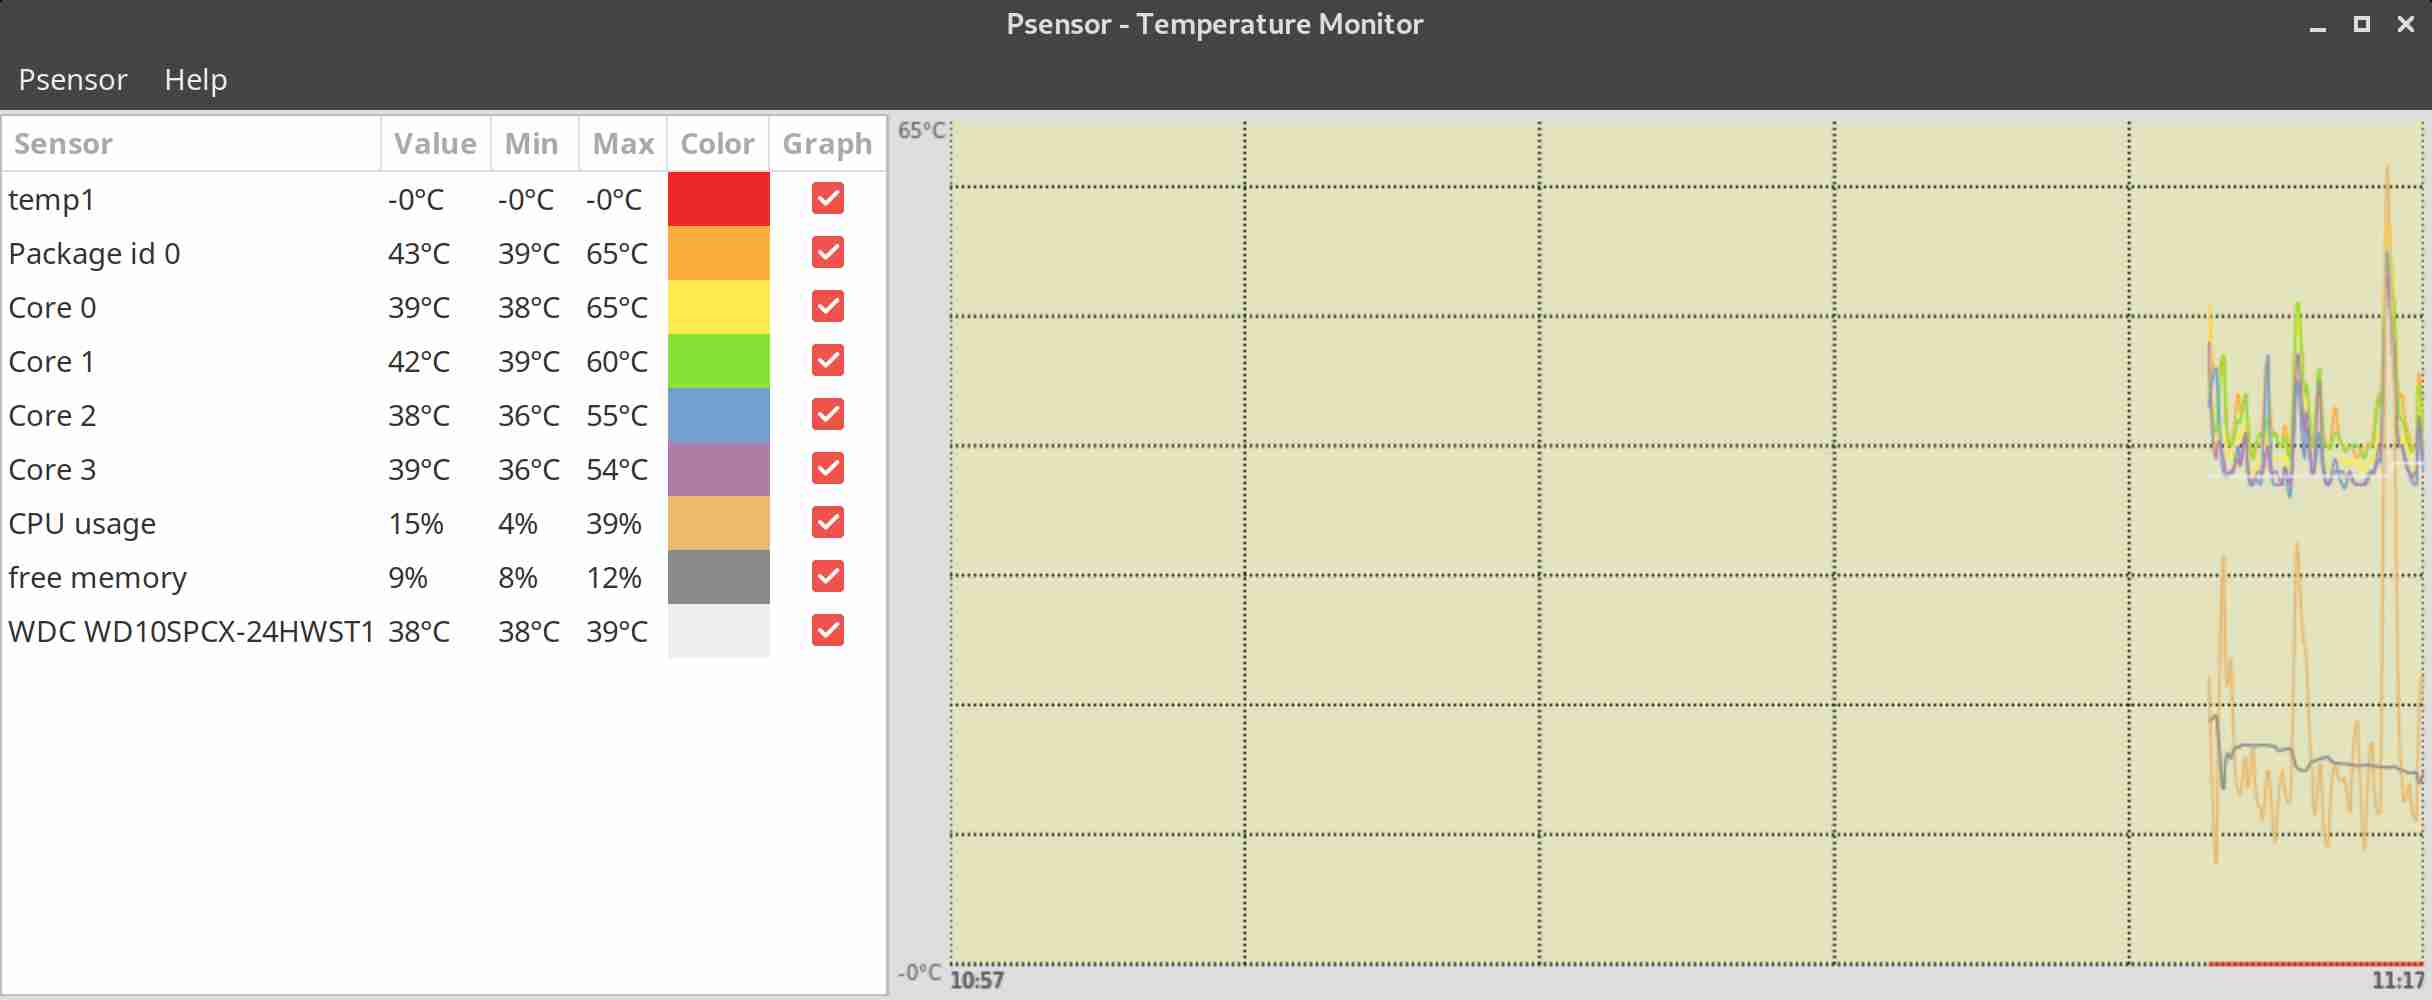
If you have a Xserver installed on the Server accessed with Xclient or via VNC though quite rare,
You can use xsensors or Psensor – a GTK+ (Widget Toolkit for creating Graphical User Interface) application software.
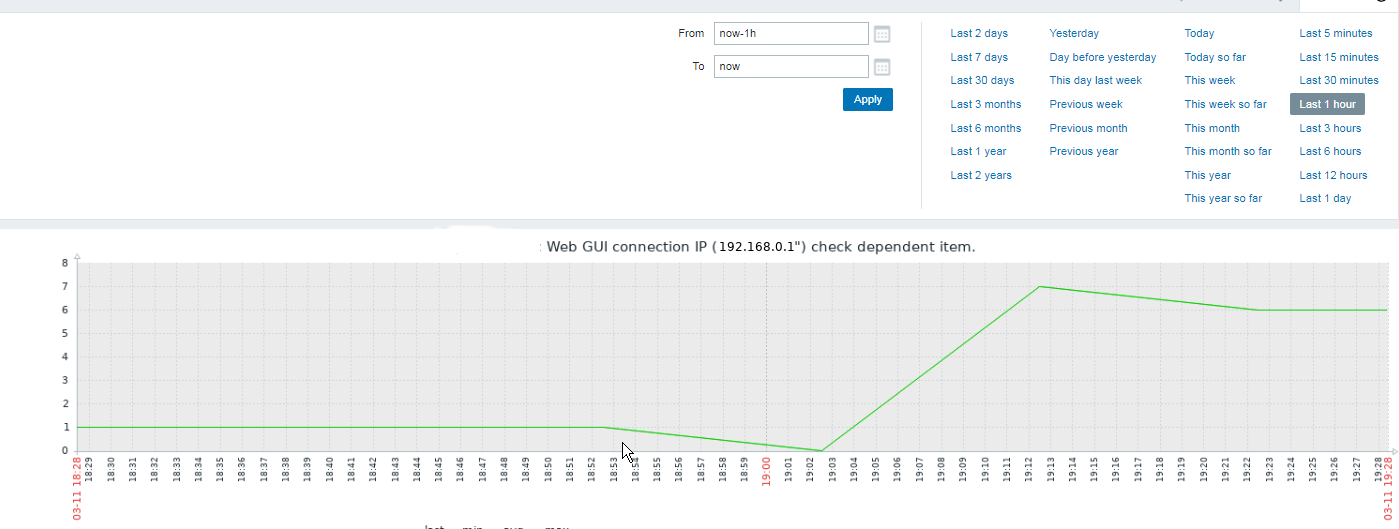
With this 3 tools it is pretty easy to script one liners and use the Zabbix UserParameters functionality to send hardware report data to a Company's Zabbix Sserver, though Zabbix has already some templates to do so in my case, I couldn't import this templates cause I don't have Zabbix Super-Admin credentials, thus to work around that a sample work around is use script to monitor for higher and critical considered temperature.
Here is a tiny sample script I came up in 1 min time it can be used to used as 1 liner UserParameter and built upon something more complex.
SENSORS_HIGH=`sensors | awk '{ print $6 }'| grep '^+' | uniq`;
SENSORS_CRIT=`sensors | awk '{ print $9 }'| grep '^+' | uniq`; ;SENSORS_STAT=`sensors|grep -E 'Core\s' | awk '{ print $1" "$2" "$3 }' | grep "$SENSORS_HIGH|$SENSORS_CRIT"`;
if [ ! -z $SENSORS_STAT ]; then
echo 'Temperature HIGH';
else
echo 'Sensors OK';
fi
Of course there is much more sophisticated stuff to use for monitoring out there
Below script can be easily adapted and use on other Monitoring Platforms such as Nagios / Munin / Cacti / Icinga and there are plenty of paid solutions, but for anyone that wants to develop something from scratch just like me I hope this
article will be a good short introduction.
If you know some other Linux hardware monitoring tools, please share.


Report haproxy node switch script useful for Zabbix or other monitoring
Tuesday, June 9th, 2020For those who administer corosync clustered haproxy and needs to build monitoring in case if the main configured Haproxy node in the cluster is changed, I've developed a small script to be integrated with zabbix-agent installed to report to a central zabbix server via a zabbix proxy.
The script is very simple it assumed DC1 variable is the default used haproxy node and DC2 and DC3 are 2 backup nodes. The script is made to use crm_mon which is not installed by default on each server by default so if you'll be using it you'll have to install it first, but anyways the script can easily be adapted to use pcs cmd instead.
Below is the bash shell script:
To configure it with zabbix monitoring it can be configured via UserParameterScript.
The way I configured it in Zabbix is as so:
1. Create the userpameter_active_node.conf
Below script is 3 nodes Haproxy cluster
Once pasted to save the file press CTRL + D
The version of the script with 2 nodes slightly improved is like so:
The haproxy_active_DC_zabbix.sh script with a bit of more comments as explanations is available here
2. Configure access for /usr/sbin/crm_mon for zabbix user in sudoers
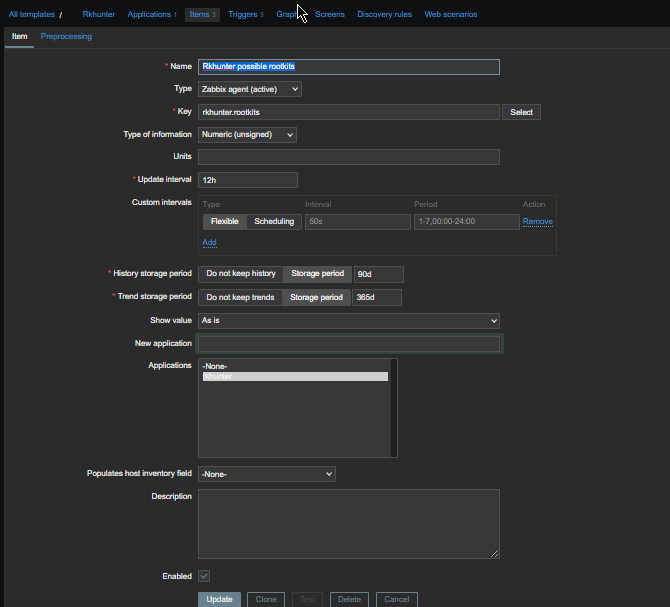
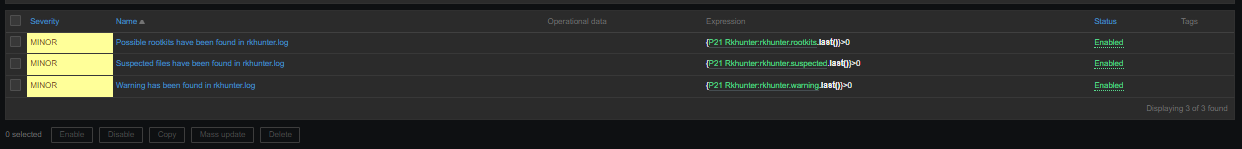
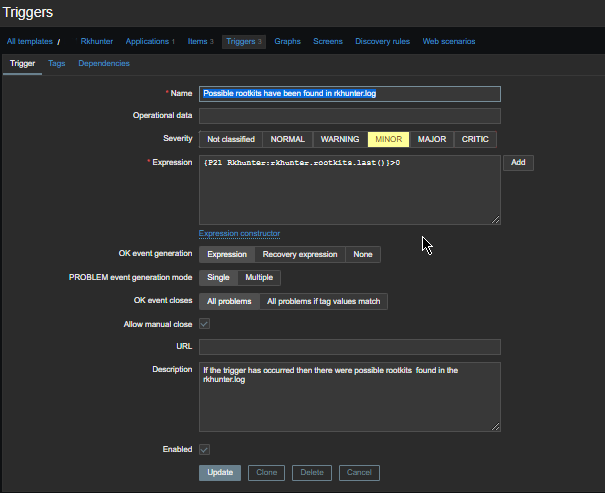
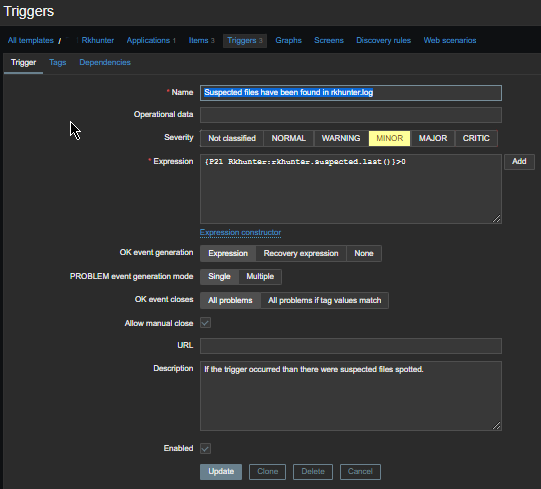
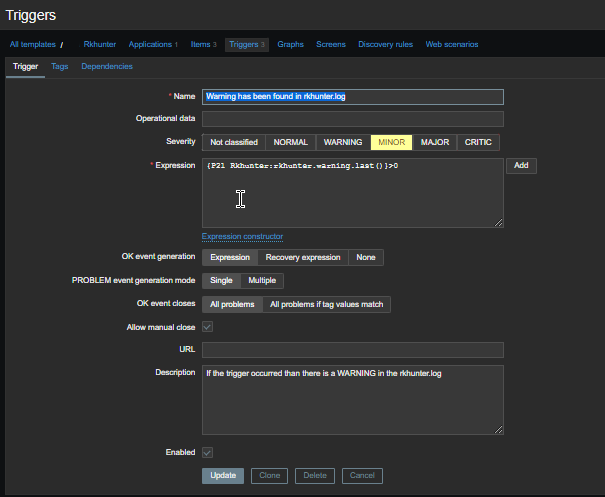
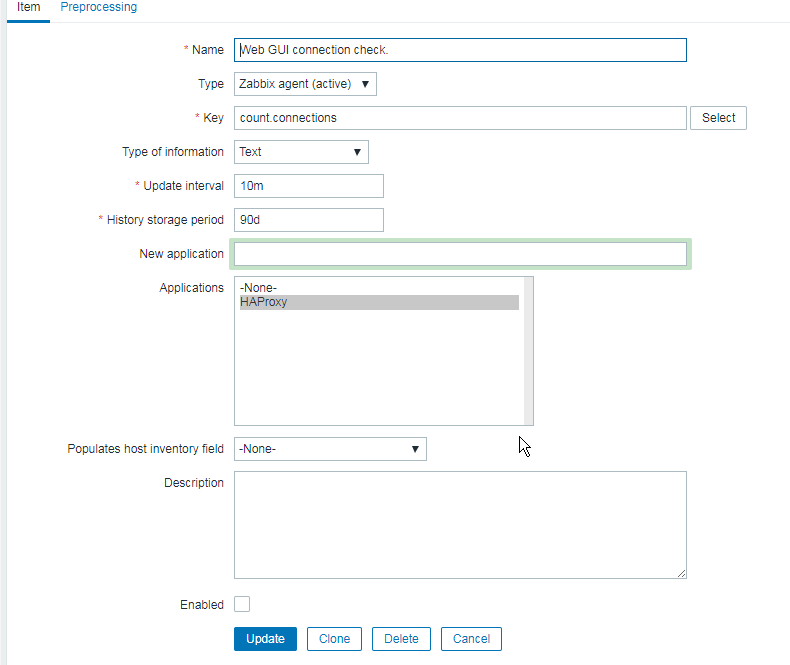
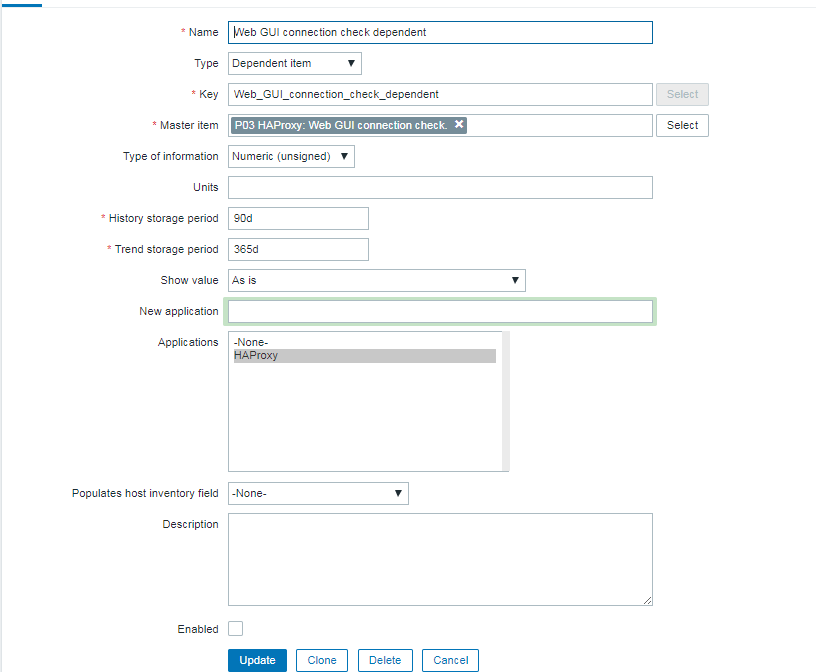
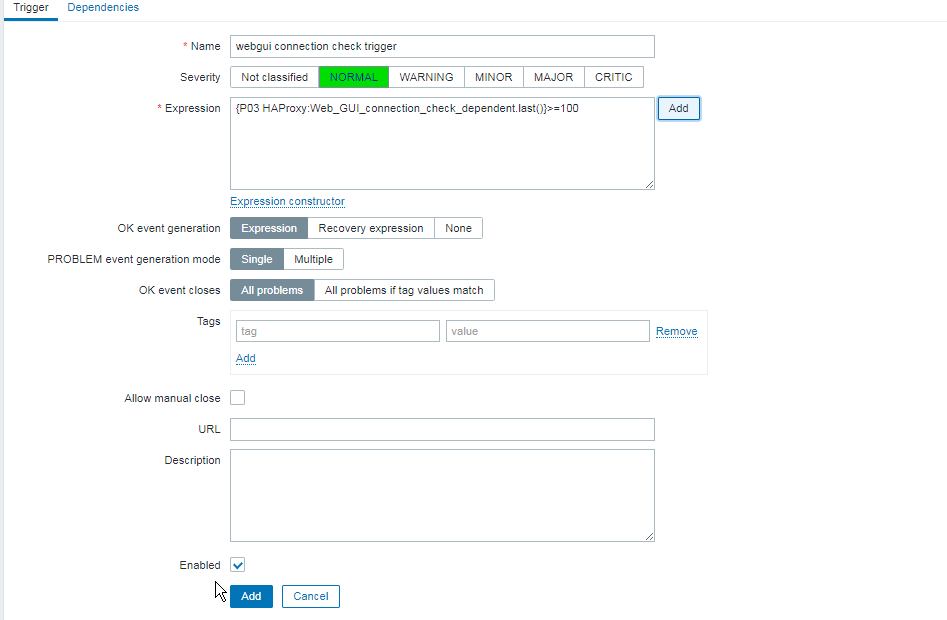
3. Configure in Zabbix for active.dc key Trigger and Item
Tags: access, ALL, and, Anyways, are, available, awk, bash shell, bash shell script, Below, bit, case, cat, Central, check, Cluster, cmd, Comments, conf, configure
Posted in Linux, Monitoring, Zabbix | No Comments »