Posts Tagged ‘sysadmin’

Building a self-healing WordPress Monitoring shell Script using Systemd, Apache, MariaDB simple automation for Linux server Auto Recovery

Friday, May 22nd, 2026

linux-self-healing-wordpress-script-automation-how-to-auto-recovery-broken-apache-mysql-mariadb-wordpress-server-tux-logo

Running a WordPress website in production is not only about publishing content  it is also about keeping the server healthy 24 / 7 to have a good yearly Website Uptime and if needed fit an SLA.

Even on stable Linux systems, services occasional failures are common for a reasons like:

  • Apache Crash / stop responding (due to bug or whatever)
  • MariaDB Database server acts unstable after heavy load (or server overheat)
  • WordPress platform auto updates leaves the site stuck in maintenance mode (until manually fixed)
  • Network outage (or a DHCP server malfunction, IP / MAC conflics can disrupt network).

There is plenty of other things that can go wrong, but generally usually a website infrastructure running on a Linux server that counts for proper productivity on basically a web server (apache) / mariadb / postgresql (or whatever other service) and WordPress based website has a set of common issues faced. That require a sysadmin to partake simple steps to resolve it.
Temporary outages can become kind of permanent without proper monitoring and introduction of automatic recovery procedures.

Within the age of clouds and automation reducing outages is key to success!

To reduce downtime and avoid manual intervention, there is a lot of things a sysadmin can do but a lot of traditional options are mostly neglected or uknown by the the new and knowledgable SREs (Site Reliability Engineers), most of whom seem to be a Gen-Z 🙂

Thus an alternative approach to the new ways of working is to keep up to the old standards and use lightweight self-healing Bash monitoring script for my WordPress based site / blog. I use such script myself as a do have a self-hosted infrastructure, so decided to share it with hope someone can benefit of it.

The server-health-check-restore-wp-apache-mariadb.sh script continuously checks:

  • Apache health state
  • MariaDB availability
  • HTTP response code status equals 200 ( OK )
  • WordPress maintenance mode (is not disabled

As an auto healing steps It then partakes:

  • Restarts of found failed services
  • Cleans stuck . maintenance wordpress files
  • Reboots the entire server after repeated database failures

This approach provides a simple but highly effective watchdog mechanism without needing complex monitoring software.

1. The server-health-check-restore-wp-apache-mariadb.sh
automation self-healing Script


$ cat /usr/local/bin/server-health-check-restore-wp-apache-mariadb.sh

#!/bin/bash

URL="https://www.pc-freak.net/blog/"
MAINT_FILE="/var/www/blog/.maintenance"
KEYWORD="Briefly unavailable for scheduled maintenance"

APACHE_SERVICE="apache2"
MARIADB_SERVICE="mariadb"

MAX_DB_RESTARTS=5
RESTART_COUNT_FILE="/var/run/mariadb_restart_count"

log() {
    echo "$(date): $1"
}

# —- Apache check —-
if ! systemctl is-active –quiet "$APACHE_SERVICE"; then
    log "Apache is not running. Restarting…"
    systemctl restart "$APACHE_SERVICE"
    sleep 5
fi

# —- MariaDB check —-
if ! systemctl is-active –quiet "$MARIADB_SERVICE"; then
    log "MariaDB is not running."

    # Read restart count
    if [ -f “$RESTART_COUNT_FILE” ]; then
        RESTART_COUNT=$(cat "$RESTART_COUNT_FILE")
    else
        RESTART_COUNT=0
    fi

    RESTART_COUNT=$((RESTART_COUNT + 1))
    echo "$RESTART_COUNT" > "$RESTART_COUNT_FILE"

    log "Restart attempt $RESTART_COUNT of $MAX_DB_RESTARTS"
    systemctl restart "$MARIADB_SERVICE"
    sleep 10

    # Re-check MariaDB
    if ! systemctl is-active –quiet "$MARIADB_SERVICE"; then
        log "MariaDB still unhealthy after restart."

        if [ “$RESTART_COUNT” -ge “$MAX_DB_RESTARTS” ]; then
            log "MariaDB failed $MAX_DB_RESTARTS times. Rebooting server!"
            rm -f "$RESTART_COUNT_FILE"
            /sbin/reboot
            exit 0
        fi

        exit 0
    fi
else
    # MariaDB healthy → reset counter
    if [ -f “$RESTART_COUNT_FILE” ]; then
        log "MariaDB is healthy again. Resetting restart counter."
        rm -f "$RESTART_COUNT_FILE"
    fi
fi

# —- HTTP sanity check —-
HTTP_CODE=$(curl -L –max-redirs 5 -s -o /dev/null -w "%{http_code}" –max-time 10 "$URL")

if [[ “$HTTP_CODE” != “200” ]]; then
    log "Site returned HTTP $HTTP_CODE. Skipping WordPress maintenance cleanup."
    exit 0
fi

# —- WordPress maintenance check —-
PAGE_CONTENT=$(curl -L –max-redirs 5 -s –max-time 10 "$URL")

if echo "$PAGE_CONTENT" | grep -qi "$KEYWORD"; then
    if [ -f “$MAINT_FILE” ]; then
        rm -f "$MAINT_FILE"
        log "WordPress maintenance file removed."
    else
        log "Maintenance message detected, but .maintenance file not found."
    fi
else
    log "Site healthy. No maintenance mode detected."
fi

1.1. Make script executable

Store the script somewhere under /usr/local/bin/ and make it executable:

# chmod +x /usr/local/bin/server-health-check-restore-wp-apache-mariadb.sh

1.2. Schedule it to run via Cron job

Run the script lets say every 5 minutes with cron and make it log to a log file:

# crontab -u root -e

*/5 * * * * /usr/sbin/server-health-check-restore-wp-apache-mariadb.sh >> /var/log/wp_healthcheck.log 2>&1

2. What This Script Actually Does

The script acts like a mini watchdog daemon.

Instead of relying on heavyweight enterprise monitoring systems, it uses:

systemctl , curl , grep combined with simple scripting  logic.

The simplicity of solution advantage is for maintenance it is easy it is transparent and highly portable as it will run on virtually ever Linux server / VPS without the need to install anything additional.

2.1 Apache Health Checks

The first section checks whether Apache is running:

# systemctl is-active –quiet apache2

If Apache is down, the script automatically restarts it:

# systemctl restart apache2

This solves temporary crashes caused by:

  • memory exhaustion
  • bad PHP workers
  • failed reloads
  • temporary kernel pressure

A short sleep delay gives Apache time to recover before additional checks continue.

2.2. MariaDB Recovery Script Logic

The database layer is more critical than Apache.

A web server can recover instantly, but repeated MariaDB crashes often indicate:

  • corrupted tables
  • exhausted RAM
  • deadlocks
  • disk problems
  • InnoDB failures

Because of that, the script implements a restart counter.

2.3. Restart Counter Logic

The counter is stored in file:

/var/run/mariadb_restart_count

Every failed startup increments the counter:

RESTART_COUNT=$((RESTART_COUNT + 1))

If MariaDB recovers successfully, the counter is deleted.

This prevents accidental reboot loops.

2.4. Automatic Server Reboot if too many auto recovery attempts

If MariaDB fails too many times:

MAX_DB_RESTARTS=5

the script escalates to a full system reboot:

/sbin/reboot

2.5. Why use reboot at continuous services failure?

Well reboot might not always work and under some cases it can make things better, but in case if you have a multiple servers running the same set of service with Apache and Mysql  with Haproxy or other Load balancer in front this set of logic is just perfect:

  • kernel resources are exhausted
  • filesystem locks remain stuck
  • memory fragmentation becomes severe
  • hardware drivers misbehave

A clean reboot can recover the machine faster than manual debugging during production outages !

This kind of script can be especially useful on:

  • Rarely mainteinaed Linux / VPS servers
  • unattended cloud instances
  • remote hosting environments

2.6. HTTP Sanity Check

After validating services, the script checks whether the website actually responds correctly.

$ curl -L –max-redirs 5

The script expects as normal a return code of:

HTTP 200

Anything else:

  • 500 errors
  • redirect loops
  • gateway failures
  • CDN problems

will stop the maintenance cleanup logic.

This prevents accidental removal of WordPress maintenance files during unrelated outages.

2.7. Automatic WordPress Maintenance Mode Recovery

One of the most annoying WordPress problems happens during failed updates.

WordPress creates under its install directory say /var/www/ a file:

.maintenance

If the update crashes, the file remains forever and the site displays:

“Briefly unavailable for scheduled maintenance.”

The script detects this message directly from the webpage content with grep:

$ grep -qi "$KEYWORD"

If detected, it removes the stale file automatically:

rm -f "$MAINT_FILE"

This instantly restores the site without requiring manual SSH intervention.

3. Why Simple script approach Works well and is good idea

This setup has several advantages, among key one is It is Extremely Lightweight.

No additional complications of use of trendy stuff like:

  • Docker stack
  • Zabbix
  • Kubernetes
  • Prometheus
  • external monitoring agents etc.

Everything is handled with simple native well known Linux tools.

3.1. It is Easy to Debug

Everything is plain Bash.

No hidden automation layers.

Every action is visible and understandable.

3.2. Production Friendly

The script tolerates:

  • temporary outages
  • service crashes
  • failed WordPress upgrades

without requiring administrator interaction.

4. Possible future script Improvements

There are many ways to extend script setup further, here is few ideas.

4.1. Add Email Notifications

Send alerts when:

  • services restart
  • reboot occurs
  • maintenance mode is detected

4.2. Add Disk Space Monitoring

Automatically detect:

  • full disks
  • inode exhaustion
  • backup growth

4.3. Add simple MySQL Query Health Checks

Instead of only checking the service state:

mysqladmin ping

could validate actual database responsiveness.

4.4. Introduce systemd Integration

Instead of cron-based execution, you might want to make the script could be made native if you use :

  • systemd timer
  • systemd service

Close up Summary

In many cases, simple Linux automation still beats overengineered solutions.

Today overcomplication of monitoring is a trend especially for big companies however for home brew small projects on little budget, sometimes the best server automation is the simplest one.
 A few lines of Bash can improve as shown above could improve uptime and reduce operational headaches.

For small-to-medium WordPress / Website deployments, this kind of self-healing “watchdog “ guarantees you reliability , simplicity , transparency , relatively quick fast recovery in case of crashes without brining a any  unnecessary infrastructure complexity, plus this setup works with zero human interaction and if combined with a simple Slack / Discord monitoring python script you can sleep better.


How to check if network ethernet cards are active on Linux server / detect the physical connected state of a network cable / connector?

Tuesday, November 1st, 2022

linux-check-connectivity-interface-software-implementation-of-multi-queue-support-in-Linux-using-commodity-Ethernet-NICs

Lets say you are administrating some Linux server and need to upgrade a switch and temporary move out traffic for ethernet interfaces connected via a Gigabit network to a Gigabit Cisco / Junper EX Series / HPE Aruba or Arista Platform network switch to a newer version of a switch or software.

Usually if you don't have control over the Network switch (if you're employeed in a large corporation), that migration will be handled by a colleague from the Network team in a prescheduled time slot and usually in a coordinated meeting, once the cabling is being physically moved by someone a person in the Computer Room (in DC) in the respective data center.

Then once the correct commands are executed on the network switch to remap the new cable to point to the right location on the Linux server, where the old switch was and the setup has to be double verified by the network team mate.

Once this is done either by a colleague or if you're in a smaller company and you work as one man army sysadmin and you have done it yourself.
Next step is to verify that the Ethernet LAN cards on the Linux server lets say 6 or 8 LAN cards are still connected and active to the preset Active LAN / VLANs.

On Linux this is pretty simple and there is many ways to do it with external tools like ethtool, if you're lucky and your server doesn't have to have a paranoid security rules to follow or have to be a minimilastic machine with a 100% PCI High security standards compliancy.

To check connectivity for all your ethernet interfaces you can simply run a one liner shell script like so:

[root@linux-server ~]# for i in $(ip a s|grep -i :|grep -v link|awk '{ print $2 }'|sed -e 's#:##g'|grep -v lo); do ethtool $i; done
Settings for eth0:
        Link detected: yes
Settings for eth1:
        Link detected: yes
Settings for eth2:
        Link detected: yes

So far so good but what if your RHEL / CentOS / Debian server doesn't have ethtool installed and you're not allowed to install it then how can you check whether network cable connector is indicating a network activity to the connected Ethernet LAN cards?

[root@linux-server ~]# for f in $(ls -1 /sys/class/net/); do echo "Eth inface: $f"; cat /sys/class/net/$f/operstate; done
Eth inface: eth0
up
Eth inface: eth1
up
Eth inface: eth2
up
Eth inface: lo
unknown

If your operstate returns something different like state unknown, e.g.:

root@linux-server ~]# cd /sys/class/net/
[root@linux-server net]# grep "" eth2/operstate
unknown
[root@linux-server net]#

[root@linux-server net]# grep "" eth{0,1,2,3}/operstate  
eth0/operstate:unknown
eth1/operstate:unknown
eth2/operstate:unknown
eth3/operstate:unknown

Then you need to check the carrier file

[root@linux-server net]# grep "" eth{0,1,2,3}/carrier
eth0/carrier:1
eth1/carrier:1
eth2/carrier:1
eth3/carrier:1

It could return either 0 or 1

The number 1 in the above output means that the network cable is physically connected to your network card’s slot meaning your network switch migration is success.

Method 2: Next, we will test a second network interface eth1:

[root@linux-server net]# cat /sys/class/net/eth1/carrier
[root@linux-server net]# cat: /sys/class/net/eth1/carrier: Invalid argument

This command’s output most likely means the the eth1 network interface is in powered down state.

So what have learned?

We have learned how to monitor the state of the network cable connected to a Linux ethernet device via external switch that is migrated without the use of any external tools like ethtool.

How to disable Windows pagefile.sys and hiberfil.sys to temporary or permamently save disk space if space is critically low

Monday, March 28th, 2022

howto-pagefile-hiberfil.sys-remove-reduce-increase-increase-size-windows-logo

Sometimes you have to work with Windows 7 / 8 / 10 PCs  etc. that has a very small partition C:\
drive or othertimes due to whatever the disk got filled up with time and has only few megabytes left
and this totally broke up the windows performance as Windows OS becomes terribly sluggish and even
simple things as opening Internet Browser (Chrome / Firefox / Opera ) or Windows Explorer stones the PC performance.

You might of course try to use something like Spacesniffer tool (a great tool to find lost data space on PC s short description on it is found in my previous article how to
delete temporary Internet Files and Folders to to speed up and free disk space
 ) or use CCleaner to clean up a bit the pc.
Sometimes this is not enough though or it is not possible to do at all the main
partition disk C:\ is anyhow too much low (only 30-50MB are available on HDD) or the Physical or Virtual Machine containing the OS is filled with important data
and you couldn't risk to remove anything including Internet Temporary files, browsing cookies … whatever.

Lets say you are the fate chosen guy as sysadmin to face this uneasy situation and have no easy
way to add disk space from another present free space partition or could not add a new SATA hard drive
SSD drive, what should you do?
 

The solution wipe off pagefile.sys and hiberfil.sys

Usually every Windows installation has a pagefile.sys and hiberfil.sys.

  • pagefile.sys – is the default file that is used as a swap file, immediately once the machine runs out of memory. For Unix / Linux users better understanding pagefile.sys is the equivallent of Linux's swap partition. Of course as the pagefile is in a file and not in separate partition the swapping in Windows is perhaps generally worse than in Linux.
  • hiberfil.sys – is used to store data from the machine on machine Hibernation (for those who use the feature)


Pagefile.sys which depending on the configured RAM memory on the OS could takes up up to 5 – 8 GB, there hanging around doing nothing but just occupying space. Thus a temporary workaround that could free you some space even though it will degrade performance and on servers and production machines this is not a good solution on just user machines, where you temporary need to free space any other important task you can free up space
by seriously reducing the preconfigured default size of pagefile.sys (which usually is 1.5 times the active memory on the OS – hence if you have 4GB you would have a 6Gigabytes of pagefile.sys).

Other possibility especially on laptop and movable devices running Win OS is to disable hiberfil.sys, read below how this is done.


The temporary solution here is to simply free space by either reducing the pagefile.sys or completely disabling it


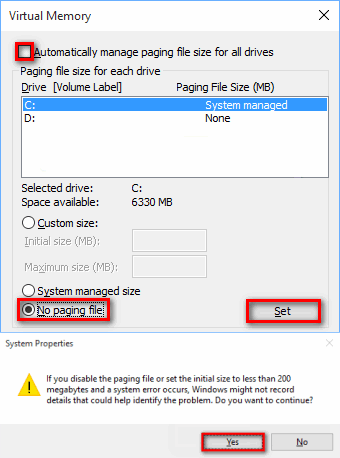
1. Disable pagefile.sys on Windows XP, Windows 7 / 8 / 10 / 11


The GUI interface to disable pagefile across all NT based Windows OS-es is quite similar, the only difference is newer versions of Windows has slightly more options.


1.1 Disable pagefile on Windows XP


Quickest way is to find pagefile.sys settings from GUI menus

1. Computer (My Computer) – right click mouse
2. Properties (System Preperties will appear)
3. Advanced (tab) 
4. Settings
5. Advanced (tab)
6. Change button
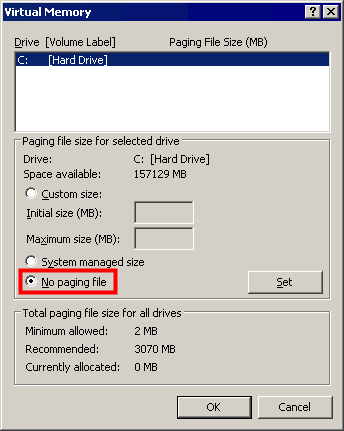
windows-xp-pagefile-disable-screenshot

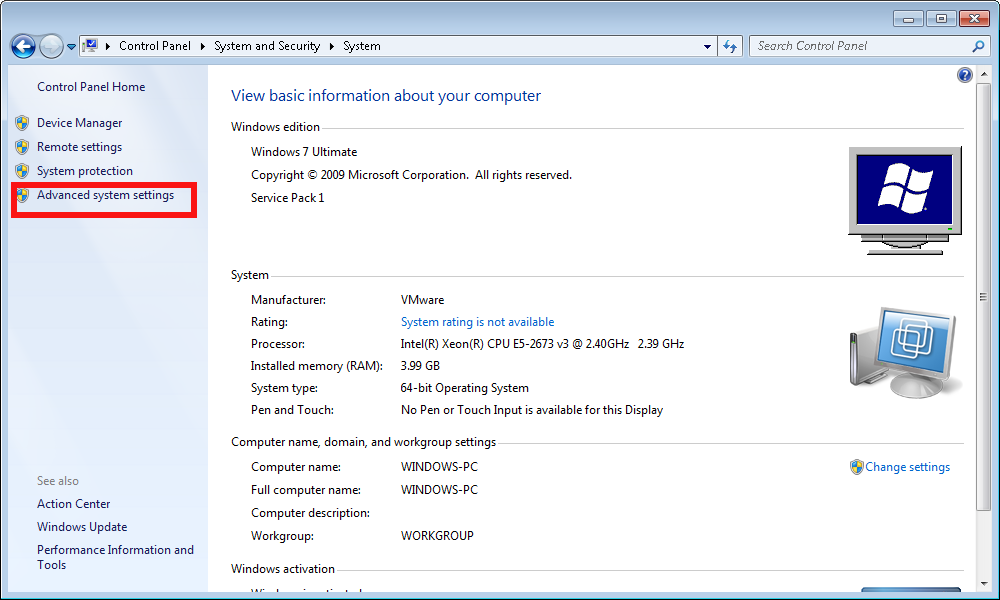
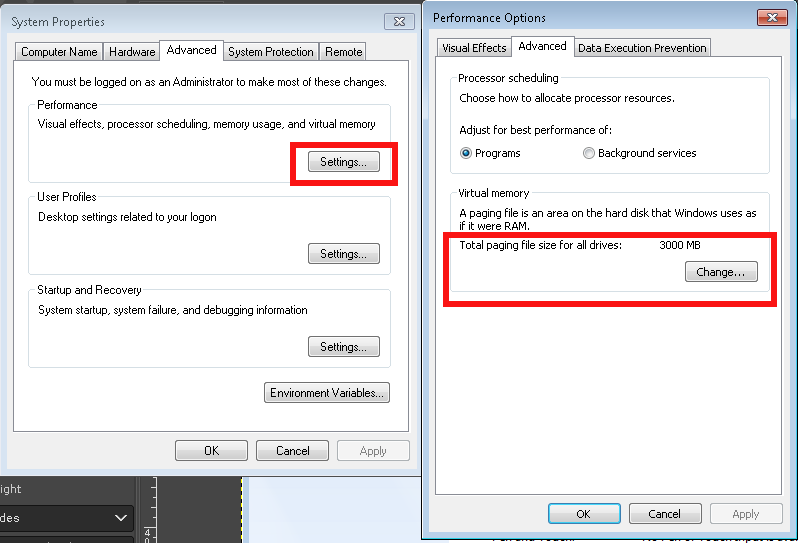
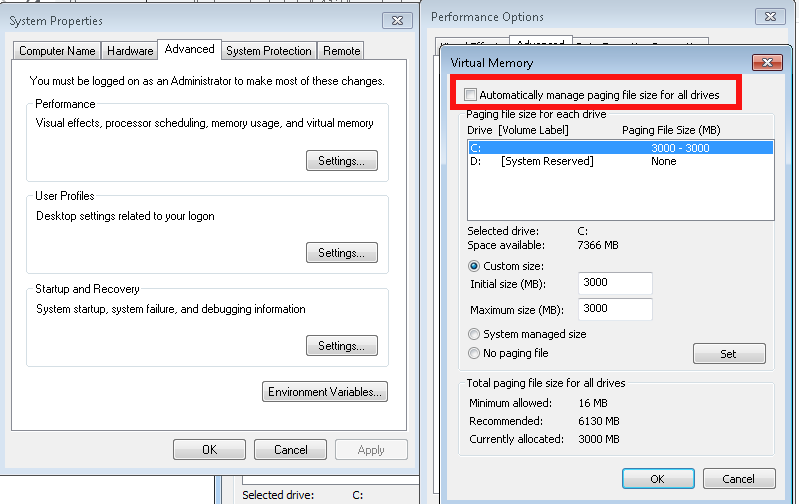
1.2 Disable pagefile on Windows 7


advanced-system-settings-control-panel-system-and-security-screenshot

windows-system-properties-screenshot-properties-advanced-change-Virtual-memory-pagefile-screenshot

system-properties-performance-options
 

Once applied you'll be required to reboot the PC
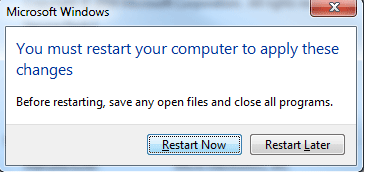
How-to-turn-off-Virtual-Memory-Paging_File-in-Windows-7-restart


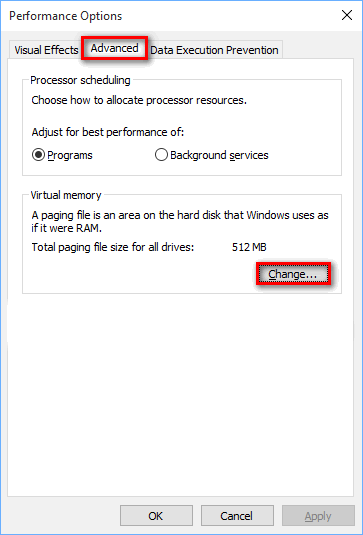
1.3 Disable Increase / Decrease pagefile.sys on Windows 10 / Win 11
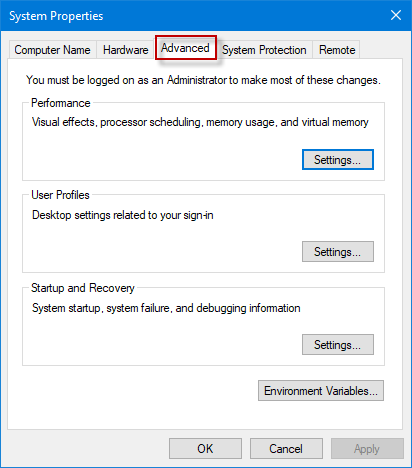
 

open-system-properties-advanced-win10

win10-performance-options-menu-screenshot

configure-virtual-memory-win-10-screenshot


1.4 Make Windows clear pagefile.sys on shutdown

On home PCs it might be useful thing to clear up ( nullify) pagefile.sys on shutdown, that could save you some disk space on every reboot, until file continuously grows to its configured Maximum.

Run

regedit

Modify registry key at location


HKEY_LOCAL_MACHINE\SYSTEM\CurrentControlSet\Control\Session Manager\Memory Management
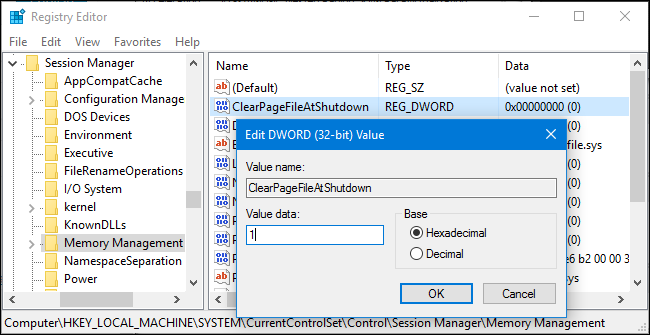
windows-clean-up-pagefile-sys-file-on-shutdown-or-reboot-registry-editor-value-screenshot

You can apply the value also via a registry file you can get the Enable Clearpagefile at shutdown here .reg.
 

2. Manipulating pagefile.sys size and file delete from command line with wmic tool 

For scripting purposes you might want to use the wmic pagefile which can do increase / decrase or delete the file without GUI, that is very helpful if you have to admin a Windows Domain (Active Directory)
 

[hipo.WINDOWS-PC] ➤ wmic pagefile /?

PAGEFILE – Virtual memory file swapping management.

HINT: BNF for Alias usage.
(<alias> [WMIObject] | [] | [] ) [].

USAGE:

PAGEFILE ASSOC []
PAGEFILE CREATE <assign list>
PAGEFILE DELETE
PAGEFILE GET [] []
PAGEFILE LIST [] []


[hipo.WINDOWS-PC] ➤ wmic pagefile
AllocatedBaseSize  Caption          CurrentUsage  Description      InstallDate                Name             PeakUsage  Status  TempPageFile
4709               C:\pagefile.sys  499           C:\pagefile.sys  20200912061902.938000+180  C:\pagefile.sys  525                FALSE


[hipo.WINDOWS-PC] ➤ wmic pagefile list /format:list

AllocatedBaseSize=4709
CurrentUsage=499
Description=C:\pagefile.sys
InstallDate=20200912061902.938000+180
Name=C:\pagefile.sys
PeakUsage=525
Status=
TempPageFile=FALSE
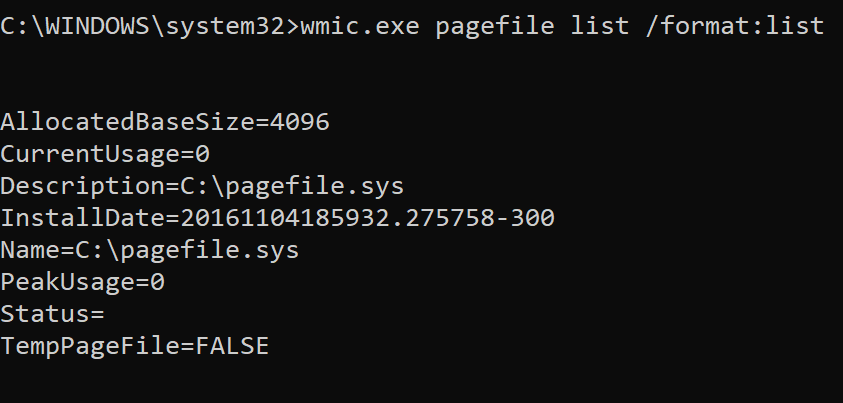
wmic-pagefile-command-line-tool-for-windows-default-output-screenshot


  • To change the Initial Size or Maximum Size of Pagefile use:
     

➤ wmic pagefileset where name="C:\\pagefile.sys" set InitialSize=2048,MaximumSize=2048

  • To move the pagefile / change location of pagefile to less occupied disk drive partition (i.e. D:\ drive)


    Sometimes you might have multiple drives on the PC and some of them might be having multitudes of gigabytes while main drive C:\ could be fully occupied due to initial install bad drive organization, in that case a good work arount to save you space so you can work normally with the server is just to temporary or permanently move pagefile to another drive.

wmic pagefileset where name="D:\\pagefile.sys" set InitialSize=2048,MaximumSize=2048


!! CONSIDER !!! 

That if you have the option to move the pagefile.sys for best performance it is advicable to place the file inside another physical disk, preferrably a Solid State Drive one, SATA disks are too slow and reduced Input / Output disk operations will lead to degraded performance, if there is lack of memory (i.e. pagefile.sys is actively open read and wrote in).
 

  • To delete pagefile.sys 
     

➤ wmic pagefileset where name="C:\\pagefile.sys" delete


If for some reason you prefer to not use wmic but simple del command you can delete pagefile.sys also by:

Removing file default "Hidden" and "system" file attributes – set for security reasons as the file is a system file usually not touched by user. This will save you from "permission denied" errors:
 

➤ attrib -s -h %systemdrive%\pagefile.sys


Delete the file:
 

➤ del /a /q %systemdrive%\pagefile.sys


3. Disable hibernation on Windows 7 / 8 and Win 10 / 11

Disabling hibernation file hiberfil.sys can also free up some space, especially if the hibernation has been actively used before and the file is written with data. Of course, that is more common on notebooks.
Windows hibernation has significantly improved over time though i didn't have very pleasant experience in the past and I prefer to disable it just in case.
 

3.1 Disable Windows 7 / 8 / 10 / 11 hibernation from GUI 

Disable it through:

Control Panel -> All Control Panel Items -> Power Options -> Edit Plan Settings -> Change advanced power settings


 like shown in below screenshot:
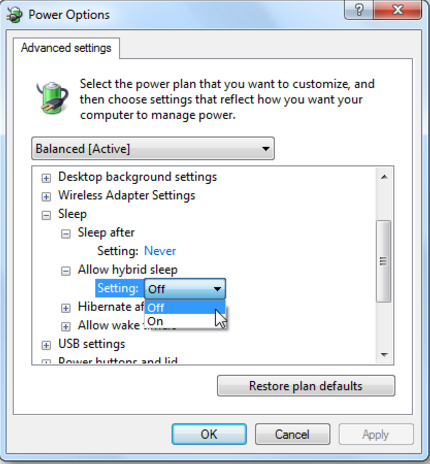
Windqows-power-options-Advanced-settings-Allow-Hybrid-sleep-option-menu-screenshot


3.2 Disable Windows 7 / 8 / 10 / 11 hibernation from command line

Disable hibernation Is done in the same way through the powercfg.exe command, to disable it
if you're cut of disk space and you want to save space from it:

run as Administrator in Command Line Windows (cmd.exe)
 

powercfg.exe /hibernate off

If you later need to switch on hibernation
 

powercfg.exe /hibernate on
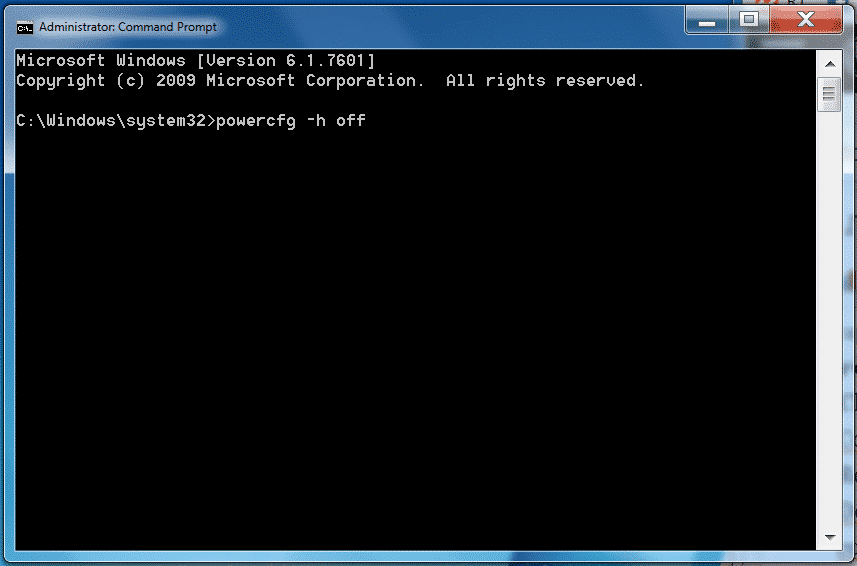

disable-hiberfile-windows-screenshot

3.3 Disable Windows hibernation on legacy Windows XP

On XP to disable hibernation open

1. Power Options Properties
2. Select Hibernate
3. Select Enable Hibernation to clear the checkbox and disable Hibernation mode. 
4. Select OK to apply the change.

Close the Power Options Properties box. 
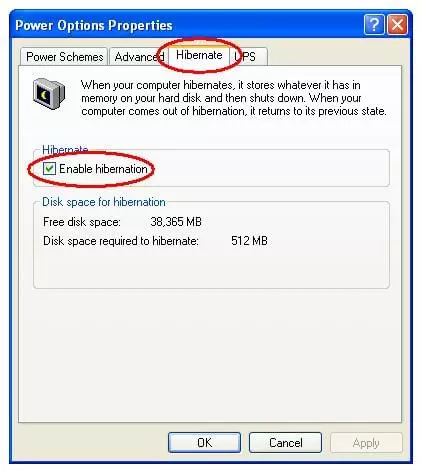
enable-disable-hibernate-windows-xp-menu-screenshot

To sum it up

We have learned some basics on Windows swapping and hibernation and i've tried to give some insight on how thiese files if misconfigured could lead to degraded Win OS performance. In any case using SSD as of 2022 to store both files is a best practice for machines that has plenty of memory always try to completely disable / remove the files. It was shown how  to manage pagefile.sys and hiberfil.sys across Windows Operating Systems different versions both from GUI and via command line as well as how you can configure pagefile.sys to be cleared up on pc reboot.
 

Set all logs to log to to physical console /dev/tty12 (tty12) on Linux

Wednesday, August 12th, 2020

tty linux-logo how to log everything to last console terminal tty12

Those who administer servers from the days of birth of Linux and who used actively GNU / Linux over the years or any other UNIX knows how practical could be to configure logging of all running services / kernel messages / errors and warnings on a physical console.

Traditionally from the days I was learning Linux basics I was shown how to do this on an old Debian Sarge 3.0 Linux without systemd and on all Linux distributions Redhat 9.0 / Calderas and Mandrakes I've used either as a home systems or for servers. I've always configured output of all messages to go to the last easy to access console /dev/tty12 (for those who never use it console switching under Linux plain text console mode is done with key combination of CTRL + ALT + F1 .. F12.

In recent times however with the introduction of systemd pretty much things changed as messages to console are not handled by /etc/inittab which was used to add and refresh physical consoles tty1, tty2 … tty7 (the default added one on Linux were usually 7), but I had to manually include more respawn lines for each console in /etc/inittab.
Nowadays as of year 2020 Linux distros /etc/inittab is no longer there being obsoleted and console print out of INPUT / OUTPUT messages are handled by systemd.
 

1. Enable Physical TTYs from TTY8 till TTY12 etc.


The number of default consoles existing in most Linux distributions I've seen is still from tty1 to tty7. Hence to add more tty consoles and be ready to be able to switch out  not only towards tty7 but towards tty12 once you're connected to the server via a remote ILO (Integrated Lights Out) / IdRAC (Dell Remote Access Controller) / IPMI / IMM (Imtegrated Management Module), you have to do it by telling systemd issuing below systemctl commands:


 # systemctl enable getty@tty8.service Created symlink /etc/systemd/system/getty.target.wants/getty@tty8.service -> /lib/systemd/system/getty@.service.

systemctl enable getty@tty9.service

Created symlink /etc/systemd/system/getty.target.wants/getty@tty9.service -> /lib/systemd/system/getty@.service.

systemctl enable getty@tty10.service

Created symlink /etc/systemd/system/getty.target.wants/getty@tty10.service -> /lib/systemd/system/getty@.service.

systemctl enable getty@tty11.service

Created symlink /etc/systemd/system/getty.target.wants/getty@tty11.service -> /lib/systemd/system/getty@.service.

systemctl enable getty@tty12.service

Created symlink /etc/systemd/system/getty.target.wants/getty@tty12.service -> /lib/systemd/system/getty@.service.


Once the TTYS tty7 to tty12 are enabled you will be able to switch to this consoles either if you have a physical LCD / CRT monitor or KVM switch connected to the machine mounted on the Rack shelf once you're in the Data Center or will be able to see it once connected remotely via the Management IP Interface (ILO) remote console.
 

2. Taking screenshot of the physical console TTY with fbcat


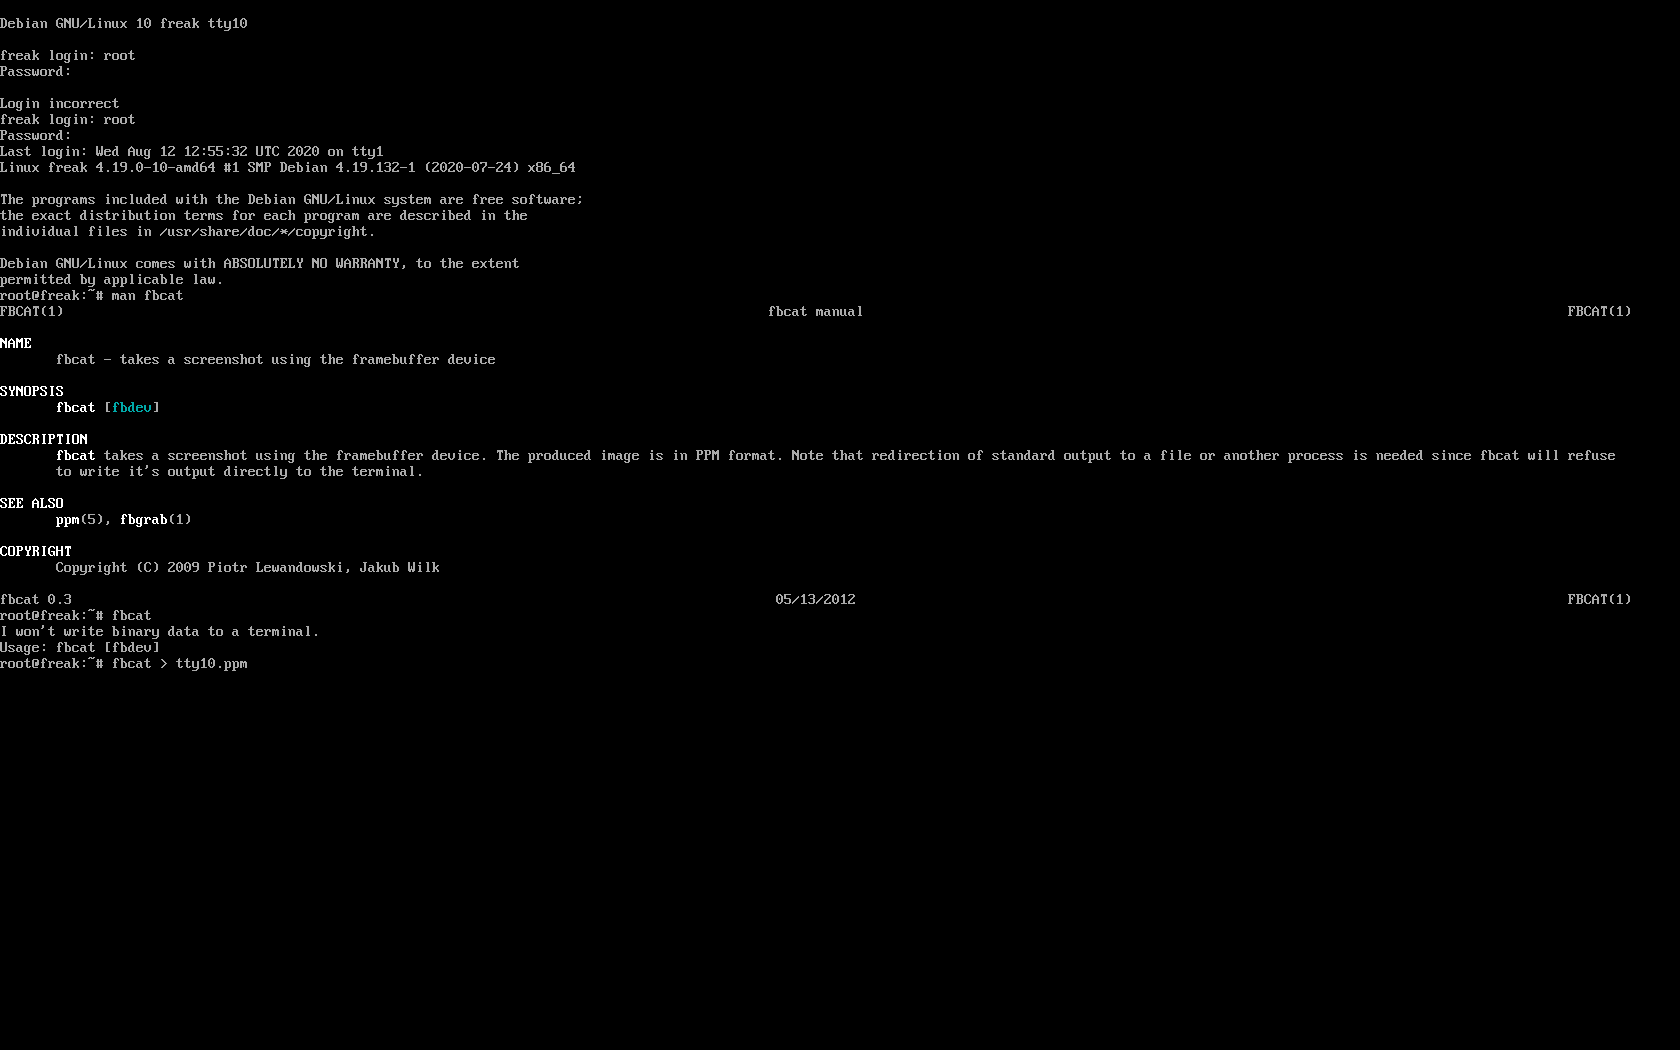
For example below is a screenshot of the 10th enabled tty10:

tty10-linux-screenshot-fbcat-how-to-screenshot-console

As you can in the screenshot I've used the nice tool fbcat that can be used to make a screenshot of remote console. This is very useful especially if remote access via a SSH client such as PuTTY / MobaXterm is not there but you have only a physical attached monitor access on a DCs that are under a heavy firewall that is preventing anyone to get to the system remotely. For example screenshotting the physical console in case if there is a major hardware failure occurs and you need to dump a hardware error message to a flash drive that will be used to later be handled to technicians to analyize it and exchange the broken server hardware part.

Screenshots of the CLI with fbcat is possible across most Linux distributions where as usual.

In Debian you have to first instal the tool via :
 

# apt install –yes fbcat


and on RedHats / CentOS / Fedoras

# yum install -y fbcat


Taking screenshot once tool is on the server of whatever you have printed on console is as easy as

# fbcat > tty_name.ppm


Note that you might want to convert the .ppm created picture to png with any converter such as imagemagick's convert command or if you have a GUI perhaps with GNU Image Manipulation Tool (GIMP).

3. Enabling every rsyslog handled message to log to Physical TTY12


To make everything such as errors, notices, debug, warning messages  become instantly logging towards above added new /dev/tty12.

Open /etc/rsyslog.conf and to the end of the file append below line :
 

daemon,mail.*;\
   news.=crit;news.=err;news.=notice;\
   *.=debug;*.=info;\
   *.=notice;*.=warn   /dev/tty12


To make rsyslog load its new config restart it:


# systemctl status rsyslog


rsyslog.service – System Logging Service
   Loaded: loaded (/lib/systemd/system/rsyslog.service; enabled; vendor preset: enabled)
   Active: active (running) since Mon 2020-08-10 04:09:36 EEST; 2 days ago
     Docs: man:rsyslogd(8)
           https://www.rsyslog.com/doc/
 Main PID: 671 (rsyslogd)
    Tasks: 4 (limit: 4915)
   Memory: 12.5M
   CGroup: /system.slice/rsyslog.service
           └─671 /usr/sbin/rsyslogd -n -iNONE


авг 12 00:00:05 pcfreak rsyslogd[671]:  [origin software="rsyslogd" swVersion="8.1901.0" x-pid="671" x-info="https://www.rsyslo
Warning: Journal has been rotated since unit was started. Log output is incomplete or unavailable.


systemctl restart rsyslog


That's all folks navigate by pressing simultaneously CTRL + ALT + F12 to get to TTY12 or use ALT + LEFT / ALT + RIGHT ARROW (console switch commands) till you get to the console where everything should be now logged.

Enjoy and if you like this article share to tell your sysadmin friends about this nice hack  ! 🙂


How to check how many processor and volume groups IBM AIX eServer have

Monday, July 13th, 2020

how-many-cpus-are-on-commands-Linux-sysadmin-and-user-show-know-AIX-logo
In daily sysadmin duties I have been usually administrating GNU / Linux or FreeBSD servers.
However now in my daily sysadmin jobs I've been added to do some minor sysadmin activities on  a few IBM AIX eServers UNIX machines.

As the eServers were completely unknown to me and I logged in for a first time I needed a way to get idea on what kind of hardware I'm logging in so I wanted to get information about the Central Processing UNIT CPUs on the host.

On Linux I'm used to do a cat /proc/cpuinfo or do dmidecode etc. to get the number of CPUs, however AIX does not have /proc/cpuinfo and has its own way to get information about the system hardware.
As I've red in the IBM AIX's RedBook to get system information on AIX there is the lscfg command.
 

aix:/# lscfg
INSTALLED RESOURCE LIST

The following resources are installed on the machine.
+/- = Added or deleted from Resource List.
*   = Diagnostic support not available.

  Model Architecture: chrp
  Model Implementation: Multiple Processor, PCI bus

+ sys0                                                            System Object
+ sysplanar0                                                      System Planar
* vio0                                                            Virtual I/O Bus
* vscsi3           U8205.E6B.068D6AP-V4-C21-T1                    Virtual SCSI Client Adapter
* vscsi2           U8205.E6B.068D6AP-V4-C20-T1                    Virtual SCSI Client Adapter
* vscsi1           U8205.E6B.068D6AP-V4-C11-T1                    Virtual SCSI Client Adapter
* hdisk1           U8205.E6B.068D6AP-V4-C11-T1-L8100000000000000  Virtual SCSI Disk Drive
* vscsi0           U8205.E6B.068D6AP-V4-C10-T1                    Virtual SCSI Client Adapter
* hdisk0           U8205.E6B.068D6AP-V4-C10-T1-L8100000000000000  Virtual SCSI Disk Drive
* ent3             U8205.E6B.068D6AP-V4-C5-T1                     Virtual I/O Ethernet Adapter (l-lan)
* ent2             U8205.E6B.068D6AP-V4-C4-T1                     Virtual I/O Ethernet Adapter (l-lan)
* ent1             U8205.E6B.068D6AP-V4-C3-T1                     Virtual I/O Ethernet Adapter (l-lan)
* ent0             U8205.E6B.068D6AP-V4-C2-T1                     Virtual I/O Ethernet Adapter (l-lan)
* vsa0             U8205.E6B.068D6AP-V4-C0                        LPAR Virtual Serial Adapter
* vty0             U8205.E6B.068D6AP-V4-C0-L0                     Asynchronous Terminal
+ L2cache0                                                        L2 Cache
+ mem0                                                            Memory
+ proc0                                                           Processor
+ proc4                                                           Processor


To get the number of processors on the host I've had to use:


aix:/# lscfg|grep -i proc
  Model Implementation: Multiple Processor, PCI bus
+ proc0                                                           Processor
+ proc4                                                           Processor


Another way to get the CPU number is with:

aix:/# lsdev -C -c processor
proc0 Available 00-00 Processor
proc4 Available 00-04 Processor


aix:/# lsattr -EH -l proc4
attribute   value          description           user_settable


frequency   3720000000     Processor Speed       False
smt_enabled true           Processor SMT enabled False
smt_threads 4              Processor SMT threads False
state       enable         Processor state       False
type        PowerPC_POWER7 Processor type        False

aix:/# lsattr -EH -l proc0
attribute   value          description           user_settable


frequency   3720000000     Processor Speed       False
smt_enabled true           Processor SMT enabled False
smt_threads 4              Processor SMT threads False
state       enable         Processor state       False
type        PowerPC_POWER7 Processor type        False


As you can see each of the processor is multicore has 2 Cores and each of the cores have for Threads, to get the overall number of CPUs on the system including the threaded Virtual CPUs:

aix:/# bindprocessor -q
The available processors are:  0 1 2 3 4 5 6 7


This specific machine has overall of 8 CPUs cores.

lscfg can be used to get various useful other info of the iron:

aix:/# lscfg -s
INSTALLED RESOURCE LIST


The following resources are installed on the machine.
+/- = Added or deleted from Resource List.
*   = Diagnostic support not available.

  Model Architecture: chrp
  Model Implementation: Multiple Processor, PCI bus

+ sys0
        System Object
+ sysplanar0
        System Planar
* vio0
        Virtual I/O Bus
* vscsi3           U8305…………….
        Virtual SCSI Client Adapter
* vscsi2           U8305…………….
        Virtual SCSI Client Adapter
* vscsi1           U8305…………….
        Virtual SCSI Client Adapter
* hdisk1           U8305…………….
        Virtual SCSI Disk Drive
* vscsi0           U8305……………..
        Virtual SCSI Client Adapter
* hdisk0           U8305…………….
        Virtual SCSI Disk Drive
* ent3             U8305…………….
        Virtual I/O Ethernet Adapter (l-lan)
* ent2             U8305.E6B…………….
        Virtual I/O Ethernet Adapter (l-lan)
* ent1             U8305.E6B…………….
        Virtual I/O Ethernet Adapter (l-lan)
* ent0             U8305.E6B…………….
        Virtual I/O Ethernet Adapter (l-lan)
* vsa0             U8305.E7B…………….
        LPAR Virtual Serial Adapter
* vty0             U8305.E7B…………….
        Asynchronous Terminal
+ L2cache0
        L2 Cache
+ mem0
        Memory
+ proc0
        Processor
+ proc4
        Processor

aix:/# lscfg -p
INSTALLED RESOURCE LIST

The following resources are installed on the machine.

  Model Architecture: chrp
  Model Implementation: Multiple Processor, PCI bus

  sys0                                                            System Object
  sysplanar0                                                      System Planar
  vio0                                                            Virtual I/O Bus
  vscsi3           U8305.E7B…………….V6-C40-T1                    Virtual SCSI Client Adapter
  vscsi2           U8305.E7B…………….V6-C40-T1                     Virtual SCSI Client Adapter
  vscsi1           U8305.E7B…………….V6-C40-T1                    Virtual SCSI Client Adapter
  hdisk1           U8305.E7B…………….V6-C40-T1-L8500000000000000  Virtual SCSI Disk Drive
  vscsi0           U8305.E7B…………….V6-C40-T1                    Virtual SCSI Client Adapter
  hdisk0           U8305.E7B…………….V6-C40-T1-L8500000000000000  Virtual SCSI Disk Drive
  ent3             U8305.E7B…………….V6-C40-T1                     Virtual I/O Ethernet Adapter (l-lan)
  ent2             U8305.E7B…………….V6-C40-T1                     Virtual I/O Ethernet Adapter (l-lan)
  ent1             U8305.E7B…………….V6-C40-T1                     Virtual I/O Ethernet Adapter (l-lan)
  ent0             U8305.E7B…………….V6-C40-T1                     Virtual I/O Ethernet Adapter (l-lan)
  vsa0             U8305.E7B.069D7AP-V5-C1                        LPAR Virtual Serial Adapter
  vty0             U8305.E7B.069D7AP-V5-D1-L0                     Asynchronous Terminal
  L2cache0                                                        L2 Cache
  mem0                                                            Memory
  proc0                                                           Processor
  proc4                                                           Processor

  PLATFORM SPECIFIC

  Name:  IBM,8305-E7B
    Model:  IBM,8305-E7B
    Node:  /
    Device Type:  chrp

  Name:  openprom
    Model:  IBM,AL730_158
    Node:  openprom

  Name:  interrupt-controller
    Model:  IBM, Logical PowerPC-PIC, 00
    Node:  interrupt-controller@0
    Device Type:  PowerPC-External-Interrupt-Presentation

  Name:  vty
    Node:  vty@30000000
    Device Type:  serial
    Physical Location: …………………………………………..

  Name:  l-lan
    Node:  l-lan@30000002
    Device Type:  network
    Physical Location: …………………………………………..

  Name:  l-lan
    Node:  l-lan@30000003
    Device Type:  network
    Physical Location: …………………………………………..

  Name:  l-lan
    Node:  l-lan@30000004
    Device Type:  network
    Physical Location: …………………………………………..

  Name:  l-lan
    Node:  l-lan@30000005
    Device Type:  network
    Physical Location: …………………………………………..

  Name:  v-scsi
    Node:  v-scsi@3000005a
    Device Type:  vscsi
    Physical Location: …………………………………………..

  Name:  v-scsi
    Node:  v-scsi@3000005b
    Device Type:  vscsi
    Physical Location: …………………………………………..

  Name:  v-scsi
    Node:  v-scsi@30000014
    Device Type:  vscsi
    Physical Location: ………………………………..

  Name:  v-scsi
    Node:  v-scsi@30000017
    Device Type:  vscsi
    Physical Location: …………………………………


Another useful command I found is to list the equivalent of Linux's LVM Logical Volumes configured on the system, below is how:

aix:/# lspv hdisk0
00f68c6a84acb0d5 rootvg active hdisk1 00f69d6a85400468 dsvg active

To get more info on a volume group:

aix:/# lspv hdisk0 PHYSICAL VOLUME: hdisk0 VOLUME GROUP: rootvg PV IDENTIFIER: 00f68d6a85acb0d5 VG IDENTIFIER 00f68d6a00004c0000000131353444a5 PV STATE: active STALE PARTITIONS: 0 ALLOCATABLE: yes PP SIZE: 32 megabyte(s) LOGICAL VOLUMES: 12 TOTAL PPs: 959 (30688 megabytes) VG DESCRIPTORS: 2 FREE PPs: 493 (15776 megabytes) HOT SPARE: no USED PPs: 466 (14912 megabytes) MAX REQUEST: 256 kilobytes FREE DISTRIBUTION: 191..00..00..110..192 USED DISTRIBUTION: 01..192..191..82..00 MIRROR POOL: None


You can get which local configured partition is set on which ( PV )Physical Volume

aix:/# lspv -l hdisk0
hdisk0:
LV NAME               LPs     PPs     DISTRIBUTION          MOUNT POINT
lg_dumplv             64      64      00..64..00..00..00    N/A
hd8                   1       1       00..00..01..00..00    N/A
hd6                   16      16      00..16..00..00..00    N/A
hd2                   166     166     00..45..89..32..00    /usr
hd4                   29      29      00..11..18..00..00    /
hd3                   40      40      00..04..04..32..00    /tmp
hd9var                55      55      00..00..37..18..00    /var
hd10opt               74      74      00..37..37..00..00    /opt
hd1                   8       8       00..07..01..00..00    /home
hd5                   1       1       01..00..00..00..00    N/A

Start Event Viewer from Command Line (Prompt) – eventvwr.msc to Debug Windows server issues

Friday, November 6th, 2015

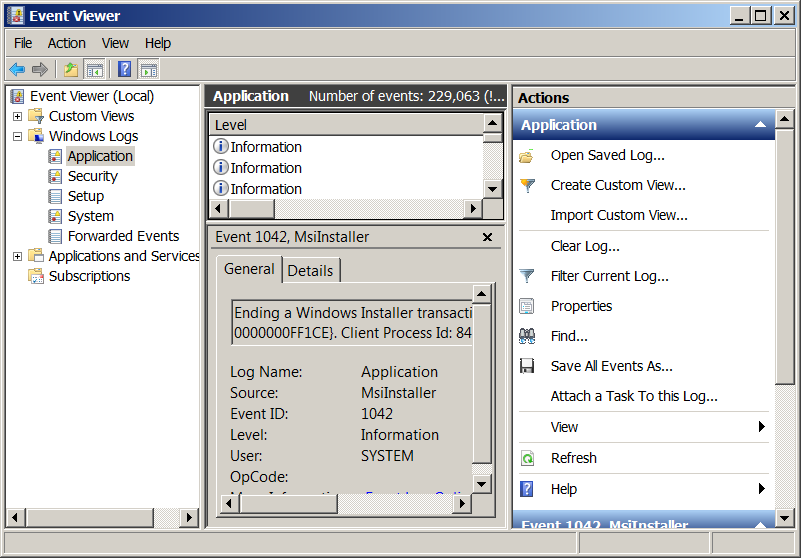
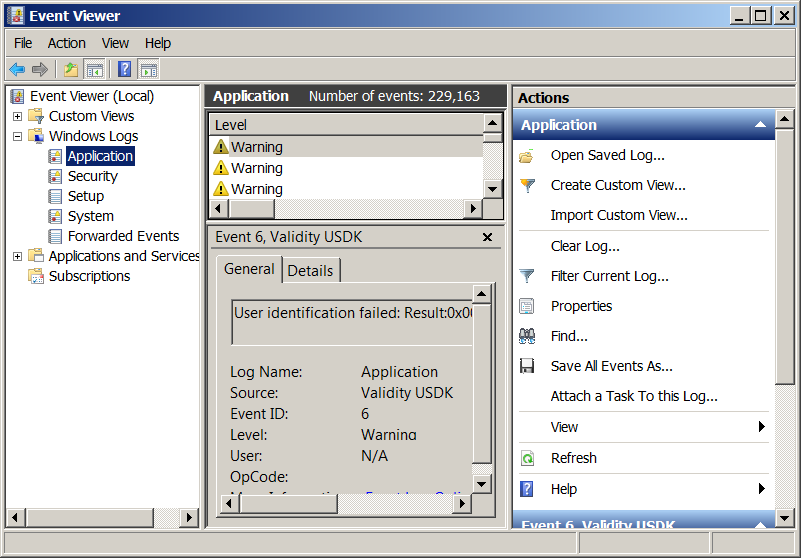
eventvwrmsc-event-viewer-windows-7-screenshot-view-windows-log-and-dianose-errors

If you’re a sysadmin which needs to deal with Microsoft Windows servers locally or remotely via Remote Desktop RDP client (MSTSC.EXE) or inside a Windows Domain Controller, you will have to frequently debug Windows isseus or Application caused errors by reviewing debug information stored in Event Logs.

Event Viewer is a precious tool to debug often errors with missing libraries or failing programs on Windows boot and thus on M$ Windows it is the Swiss Army knife of sysadmin.
However as staring Event Viewer using the GUI menus, takes a lot of step and looses you time, e.g., you have to navigate to menus:

1. Start button Picture of the Start button
2. clicking Control Panel
3. clicking System and Security
4. clicking Administrative Tools
5.then double-clicking Event Viewer.‌
6. Granting Administrator permission required If you’re prompted for an administrator password or confirmation

It is much handier to just start it with a shortcut:

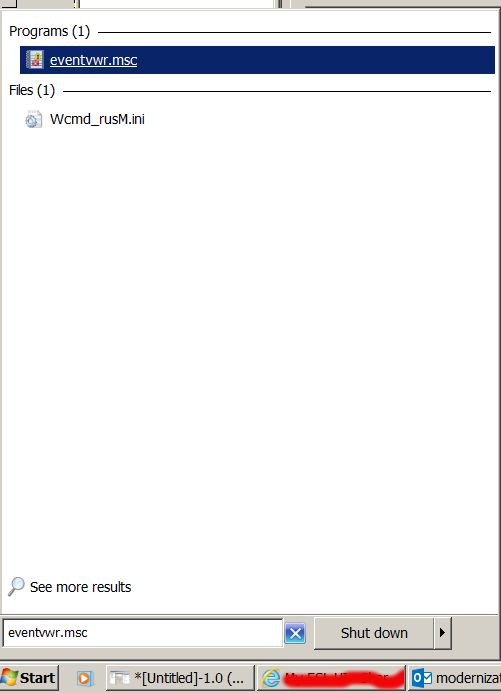
Press Windows (Button) + R
– To invoke run prompt

and type:

eventvwr.msc

In case if you’re running eventvwr.msc to connect to remote Windows Server run from command prompt (cmd.exe):

eventvwr-run-from-command-prompt-with-a-smart-shortcut-to-save-time-when-administrating-windows-servers

eventvwr.msc /computer=OTHER_Computer_Name

event-viewer-log-reader-and-debug-tool-for-windows-PC-and-windows-servers-adminsitration

Check Windows load avarage command – Get CPU usage from Windows XP / 7 / 8 / 2012 server cmd prompt

Wednesday, August 19th, 2015

Check_Windows-load-avarage-command-Get_CPU_usage_from_Windows_XP-7-8-2003-2010-2012_server_cmd_prompt

If you used to be a long years Linux / UNIX sysadmin and you suddenly have to also admistrate a bunch of Windows hosts via RDP (Remote Desktop Protocol)  / Teamviewer etc. and you need to document The Load Avarage of a Windows XP / 7 / 8 servers but you're puzzled how to get an overall load avarage of Windows host via command in a UNIX way like with the good old uptime  Linux / BSD command e.g.

 ruth:$ uptime
 11:43  up 713 days 22:44,  1 user,  load average: 0.22, 0.17, 0.15

Then its time to you to get used to WMICWMIC extends WMI for operation from several command-line interfaces and through batch scripts. wmic is a wonderful command for Command addicted Linux guys and gives a lot of opportunities to query and conduct various sysadmin tasks from Windows command prompt.

To get an loadavarage with wmic use:
 

C:\>wmic cpu get loadpercentage
LoadPercentage
1


or
 

@for /f "skip=1" %p in ('wmic cpu get loadpercentage') do @echo %p%
1%
%


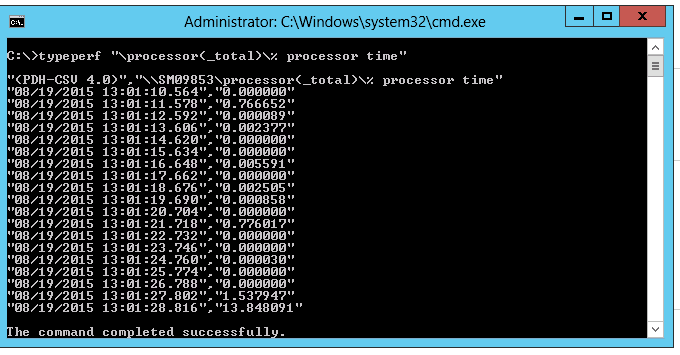
on Windows 7 / 8 and 10 as well Windows Server 2010 and Windows Server 2012 for more precise CPU loadavarage results, you can also use:
 

C:\> typeperf "\processor(_total)\% processor time"

"(PDH-CSV 4.0)","\\Win-Host\processor(_total)\% processor time"
"08/19/2015 12:52:53.343","0.002288"
"08/19/2015 12:52:54.357","0.000000"
"08/19/2015 12:52:55.371","0.000000"
"08/19/2015 12:52:56.385","0.000000"
"08/19/2015 12:52:57.399","0.000799"
"08/19/2015 12:52:58.413","0.000000"
"08/19/2015 12:52:59.427","0.000286"
"08/19/2015 12:53:00.441","0.000000"
"08/19/2015 12:53:01.455","0.000000"
"08/19/2015 12:53:02.469","0.008678"
"08/19/2015 12:53:03.483","0.000000"
"08/19/2015 12:53:04.497","0.002830"
"08/19/2015 12:53:05.511","0.000621"
"08/19/2015 12:53:06.525","0.768834"
"08/19/2015 12:53:07.539","0.000000"
"08/19/2015 12:53:08.553","1.538296"


Adding another level of security to your shared Debian Linux webhosting server with SuPHP

Tuesday, April 7th, 2015

suphp_improve-apache-security-protect-against-virus-internal-server-infections-suphp-webserver-logo

There are plenty of security schemes and strategies you can implement if you're a Shared Web Hosting company sysadmin however probably the most vital one is to install on Apache + PHP Webserver SuPHP module.

# apt-cache show suphp-common|grep -i descrip -A 4

Description: Common files for mod suphp Suphp consists of an Apache module (mod_suphp for either Apache 1.3.x or Apache 2.x) and a setuid root binary (suphp) that is called by the Apache module to change the uid of the process executing the PHP interpreter to the owner of the php script.

So what SuPHP actuall  does is to run separate CPanel / Kloxo etc. Users with separate username and groupid permissions coinciding with the user present in /etc/passwd , /etc/shadow files existing users, thus in case if someone hacks some of the many customer sites he would be able to only write files and directories under the user with which the security breach occured.

On servers where SuPHP is not installed, all  systemusers are using the same UserID / GuID to run PHP executable scripts under separate domains Virtualhost which are coinciding with Apache (on Debian / Ubuntu  uid, gid – www-data) or on (CentOS / RHEL / Fedora etc. – user apache) so once one site is defaced  exploited by a worm all or most server websites might end up infected with a Web Virus / Worm which will be trying to exploit even more sites of a type running silently in the background.  This is very common scenarios as currently there are donezs of PHP / CSS / Javasripts / XSS vulnerability exploited on VPS and Shared hosting servers due to failure of a customer to update his own CMS  scripts / Website  (Joomla, Wordpress, Drupal etc.) and the lack of resource to regularly monitor all customer activities / websites.

Therefore installing SuPHP Apache module is essential one to install on new serverslarge hosting providers as it saves the admin a lot of headache from spreading malware across all hosted servers sites ..
Some VPS admins that are security freaks tend to also install SuPHP module together with many chrooted Apache / LiteSpeed / Nginx webservers each of which running in a separate Jailed environment.

Of course using SuPHP besides giving a improved security layer to the webserver has its downsides such as increased load for the server and making Apache PHP scripts being interpretted a little bit slower than with plain Apache + PHP but performance difference while running a site on top of SuPHP is often not so drastic so you can live it up ..

Installing SuPHP on a Debian / Ubuntu servers is a piece of cake, just run the as root superuser, usual:
 

# apt-get install libapache2-mod-suphp


Once installed only thing to make is to turn off default installed Apache PHP module (without SuPHP compiled support and restart Apache webserver):
 

# a2dismod php5 …

# /etc/init.d/apache2 restart


To test the SuPHP is properly working on the Apache Webserver go into some of many hosted server websites DocumentRoot

And create new file called test_suphp.php with below content:

# vim test_suphp.php
<?php
system('id');
?>

Then open in browser http://whatever-website/test_suphp.php assuming that system(); function is not disabled for security reasons in php.ini you should get an User ID, GroupID bigger than reserved system IDs on GNU / Linux e.g. ID > UID / GID 99

Its also a good idea to take a look into SuPHP configuration file /etc/suphp/suphp.conf and tailor options according to your liking 

If different hosted client users home directories are into /home directory, set in suphp.conf

;Path all scripts have to be in

docroot=/home/


Also usually it is a good idea to set 

umask=0022 

mod_rewrite redirect rule 80 to 443 on Apache webserver

Wednesday, April 2nd, 2014

A classic sysadmin scenario is to configure new Apache webserver with requirement to have an SSL ceriticate installed and working on port 443 and all requests coming on port 80 to be redirected to https://.
On Apache this is done with simple mod_rewrite rule:

RewriteEngine On
RewriteCond %{HTTPS} off
RewriteRule (.*) https://%{HTTP_HOST}%{REQUEST_URI}

Before applying the rule don't forget to have Apache mod_rewrite enabled usually it is not enabled on default most Linux distributions by default.
On shared hostings if you don't have access to directly modify Apache configuration but have .htaccess enabled you can add above rules also to .htaccess

Add this to respective VirtualHost configuration and restart Apache and that's it. If after configuring it for some reason it is not working debug mod_rewrite issues by enabling mod_rewrite's rewrite.log

Other useful Apache mod_rewrite redirect rule is redirect a single landing page from HTTP to HTTP

RewriteEngine On
RewriteRule ^apache-redirect-http-to-https.html$ https://www.site-url.com/apache-redirect-http-to-https.html [R=301,L]

!Note! that in case where performance is a key requirement for a website it might be better to use the standard way to redirect HTTP to HTTPS protocol in Apache through:

ServerName www.site-url.com Redirect / https://www.site-url.com/

To learn more on mod_rewrite redirecting  check out this official documentation on Apache's official site.