Say you're having an haproxy load balancer cluster with two or more nodes and you are running the servers inside some complex organizational hybrid complex network that is a combination of a local DMZ lans, many switches, dedicated connectivity lines and every now and then it happens for the network to mysteriously go down. Usually simply setting monitoring on the network devices CISCO itself or the smart switches used is enough to give you an overview on what's going on but if haproxy is in the middle of the end application servers and in front of other Load balancers and network equipment sometimes it might happen that due to failure of a network equipment / routing issues or other strange unexpected reasons one of the 2 nodes connectivity might fail down via the configured dedicated additional Heartbeat lines that are usually configured in order to keep away the haproxy CRM Resource Manager cluster thus ending it up in a split brain scenarios.
Assuming that this is the case like it is with us you would definitely want to keep an eye on the connectivity of Connect Line1 and Connect Line2 inside some monitoring software like zabbix. As our company main monitoring software used to monitor our infrastructure is Zabbix in this little article, I'll briefly explain how to configre the network connectivity status change from haproxy node1 and haproxy node2 Load balancer cluster to be monitored via a simple ICMP ping echo checks.
Of course the easies way to configure an ICMP monitor via Zabbix is using EnableRemoteCommands=1 inside /etc/zabbix/zabbix-agentd.conf but if your infrastructure should be of High Security and PCI perhaps this options is prohibited to be used on the servers. This is why to achieve still the ICMP ping checks with EnableRemoteCommands=0 a separate simple bash user parameter script could be used. Read further to find out one way ICMP monitoring with a useparameter script can be achieved with Zabbix.
1. Create the userparameter check for heartbeat lines
root@haproxy1 zabbix_agentd.d]# cat userparameter_check_heartbeat_lines.conf
UserParameter=heartbeat.check,\
/etc/zabbix/scripts/check_heartbeat_lines.sh
root@haproxy2 zabbix_agentd.d]# cat userparameter_check_heartbeat_lines.conf
UserParameter=heartbeat.check,\
/etc/zabbix/scripts/check_heartbeat_lines.sh
2. Create check_heartbeat_lines.sh script which will be actually checking connectivity with simple ping
root@haproxy1 zabbix_agentd.d]# cat /etc/zabbix/scripts/check_heartbeat_lines.sh
#!/bin/bash
hb1=haproxy2-lb1
hb2=haproxy2-lb2
if ping -c 1 $hb1 &> /dev/null
then
echo "$hb1 1"
else
echo "$hb1 0"
fi
if ping -c 1 $hb2 &> /dev/null
then
echo "$hb2 1"
else
echo "$hb2 0"
fi
[root@haproxy1 zabbix_agentd.d]#
root@haproxy2 zabbix_agentd.d]# cat /etc/zabbix/scripts/check_heartbeat_lines.sh
#!/bin/bash
hb1=haproxy1-hb1
hb2=haproxy1-hb2
if ping -c 1 $hb1 &> /dev/null
then
echo "$hb1 1"
else
echo "$hb1 0"
fi
if ping -c 1 $hb2 &> /dev/null
then
echo "$hb2 1"
else
echo "$hb2 0"
fi
[root@haproxy2 zabbix_agentd.d]#
3. Test script heartbeat lines first time
Each of the nodes from the cluster are properly pingable via ICMP protocol
The script has to be run on both haproxy1 and haproxy2 Cluster (load) balancer nodes
[root@haproxy-hb1 zabbix_agentd.d]# /etc/zabbix/scripts/check_heartbeat_lines.sh
haproxy2-hb1 1
haproxy2-hb2 1
[root@haproxy-hb2 zabbix_agentd.d]# /etc/zabbix/scripts/check_heartbeat_lines.sh
haproxy1-hb1 1
haproxy1-hb2 1
The status of 1 returned by the script should be considered remote defined haproxy node is reachable / 0 means ping command does not return any ICMP status pings back.
4. Restart the zabbix-agent on both cluster node machines that will be conducting the ICMP ping check
[root@haproxy zabbix_agentd.d]# systemctl restart zabbix-agentd
[root@haproxy zabbix_agentd.d]# systemctl status zabbix-agentd
…
[root@haproxy zabbix_agentd.d]# tail -n 100 /var/log/zabbix_agentd.log
…
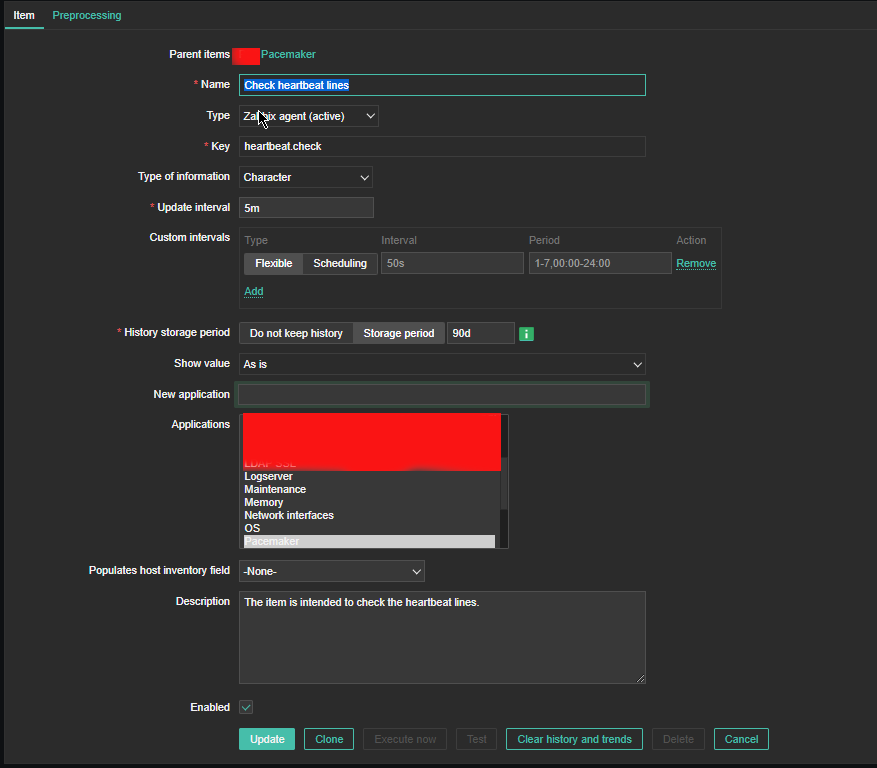
5. Create Item to process the userparam script
Create Item as follows:
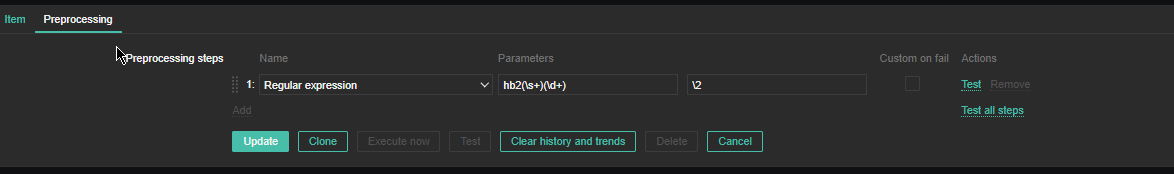
6. Create the Dependent Item required

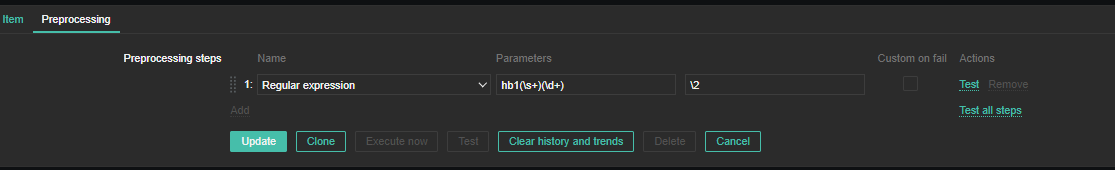
For processing you need to put the following simple regular expression
Name: Regular Expression
Parameters: hb1(\s+)(\d+)
Custom on fail: \2

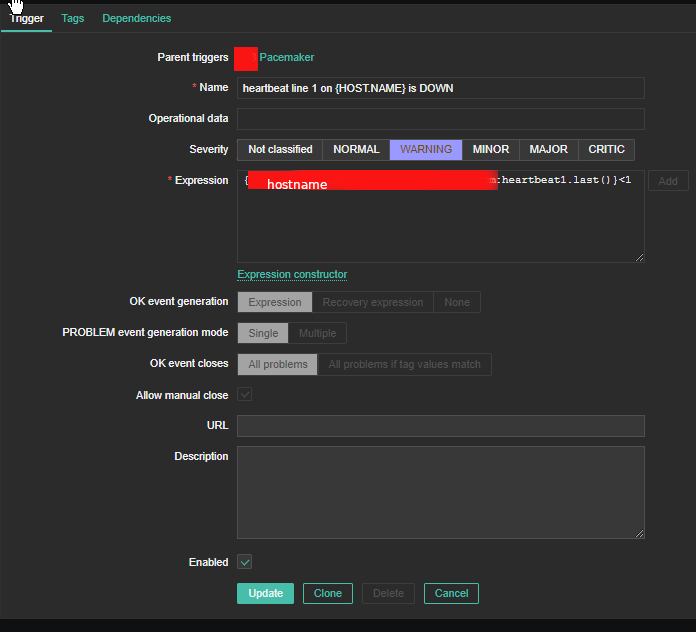
7. Create triggers that will be generating the Alert
Create the required triggers as well
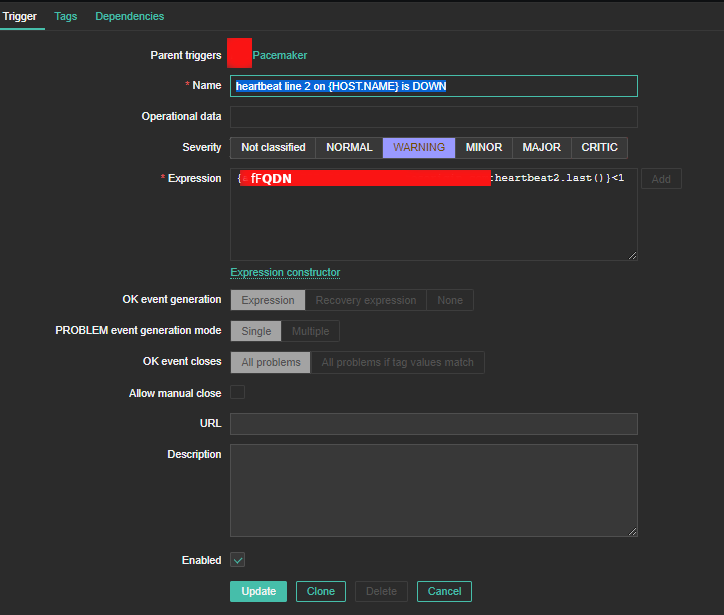
Main thing to configure here in Zabbix is below expression
Expression: {FQDN:heartbeat2.last()}<1
You can further configure Zabbix Alerts to mail yourself or send via Slack / MatterMost or Teams alarms in case of problems.