Posts Tagged ‘ICMP’

Monitor cluster heartbeat lines IP reahability via ping ICMP protocol with Zabbix

Wednesday, April 12th, 2023

https://pc-freak.net/images/zabbix-monitoring-icmp-ping-on-application-crm-clusters-with-userparameter-script-howto

Say you're having an haproxy load balancer cluster with two or more nodes and you are running the servers inside some complex organizational hybrid complex network that is a combination of a local DMZ lans, many switches, dedicated connectivity lines and every now and then it happens for the network to mysteriously go down. Usually simply setting monitoring on the network devices CISCO itself or the smart switches used is enough to give you an overview on what's going on but if haproxy is in the middle of the end application servers and in front of other Load balancers and network equipment sometimes it might happen that due to failure of a network equipment / routing issues or other strange unexpected reasons one of the 2 nodes connectivity might fail down via the configured dedicated additional Heartbeat lines that are usually configured in order to keep away the haproxy CRM Resource Manager cluster thus ending it up in a split brain scenarios.

Assuming that this is the case like it is with us you would definitely want to keep an eye on the connectivity of Connect Line1 and Connect Line2 inside some monitoring software like zabbix. As our company main monitoring software used to monitor our infrastructure is Zabbix in this little article, I'll briefly explain how to configre the network connectivity status change from haproxy node1 and haproxy node2 Load balancer cluster to be monitored via a simple ICMP ping echo checks.

Of course the easies way to configure an ICMP monitor via Zabbix is using EnableRemoteCommands=1 inside /etc/zabbix/zabbix-agentd.conf but if your infrastructure should be of High Security and PCI perhaps this options is prohibited to be used on the servers. This is why to achieve still the ICMP ping checks with EnableRemoteCommands=0 a separate simple bash user parameter script could be used. Read further to find out one way ICMP monitoring with a useparameter script can be achieved with Zabbix.


1. Create the userparameter check for heartbeat lines

root@haproxy1 zabbix_agentd.d]# cat userparameter_check_heartbeat_lines.conf
UserParameter=heartbeat.check,\
/etc/zabbix/scripts/check_heartbeat_lines.sh

root@haproxy2 zabbix_agentd.d]# cat userparameter_check_heartbeat_lines.conf
UserParameter=heartbeat.check,\
/etc/zabbix/scripts/check_heartbeat_lines.sh

2. Create check_heartbeat_lines.sh script which will be actually checking connectivity with simple ping

root@haproxy1 zabbix_agentd.d]# cat /etc/zabbix/scripts/check_heartbeat_lines.sh
#!/bin/bash
hb1=haproxy2-lb1
hb2=haproxy2-lb2
if ping -c 1 $hb1  &> /dev/null
then
  echo "$hb1 1"
else
  echo "$hb1 0"
fi
if ping -c 1 $hb2  &> /dev/null
then
  echo "$hb2 1"
else
  echo "$hb2 0"
fi

[root@haproxy1 zabbix_agentd.d]#

root@haproxy2 zabbix_agentd.d]# cat /etc/zabbix/scripts/check_heartbeat_lines.sh
#!/bin/bash
hb1=haproxy1-hb1
hb2=haproxy1-hb2
if ping -c 1 $hb1  &> /dev/null
then
  echo "$hb1 1"
else
  echo "$hb1 0"
fi
if ping -c 1 $hb2  &> /dev/null
then
  echo "$hb2 1"
else
  echo "$hb2 0"
fi

[root@haproxy2 zabbix_agentd.d]#


3. Test script heartbeat lines first time

Each of the nodes from the cluster are properly pingable via ICMP protocol

The script has to be run on both haproxy1 and haproxy2 Cluster (load) balancer nodes

[root@haproxy-hb1 zabbix_agentd.d]# /etc/zabbix/scripts/check_heartbeat_lines.sh
haproxy2-hb1 1
haproxy2-hb2 1

[root@haproxy-hb2 zabbix_agentd.d]# /etc/zabbix/scripts/check_heartbeat_lines.sh
haproxy1-hb1 1
haproxy1-hb2 1


The status of 1 returned by the script should be considered remote defined haproxy node is reachable / 0 means ping command does not return any ICMP status pings back.

4. Restart the zabbix-agent on both cluster node machines that will be conducting the ICMP ping check

[root@haproxy zabbix_agentd.d]# systemctl restart zabbix-agentd
[root@haproxy zabbix_agentd.d]# systemctl status zabbix-agentd

[root@haproxy zabbix_agentd.d]# tail -n 100 /var/log/zabbix_agentd.log


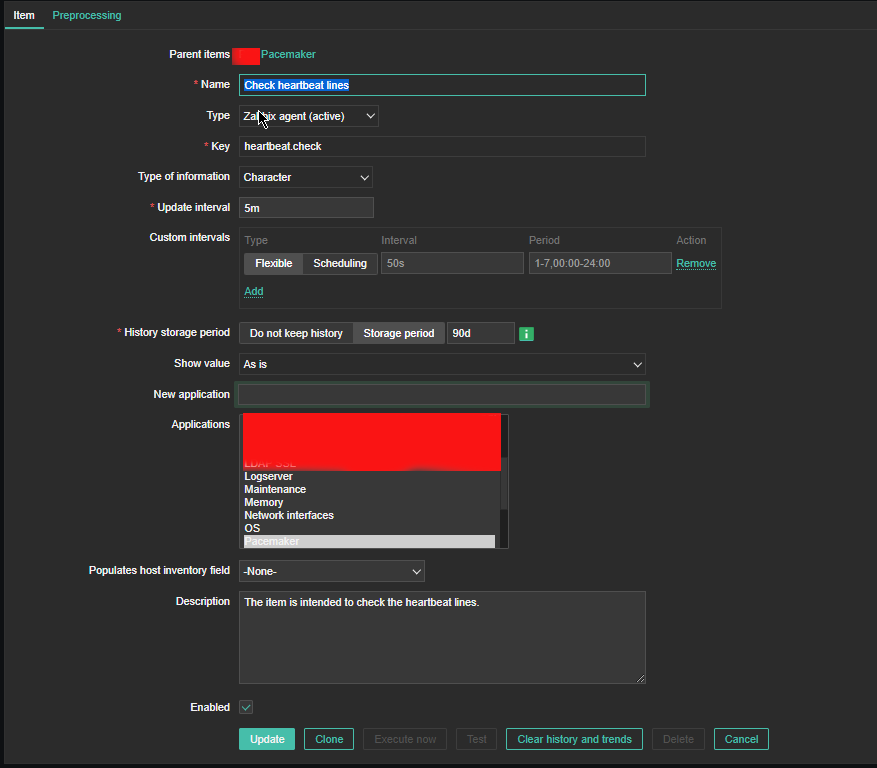
5. Create Item to process the userparam script

Create Item as follows:

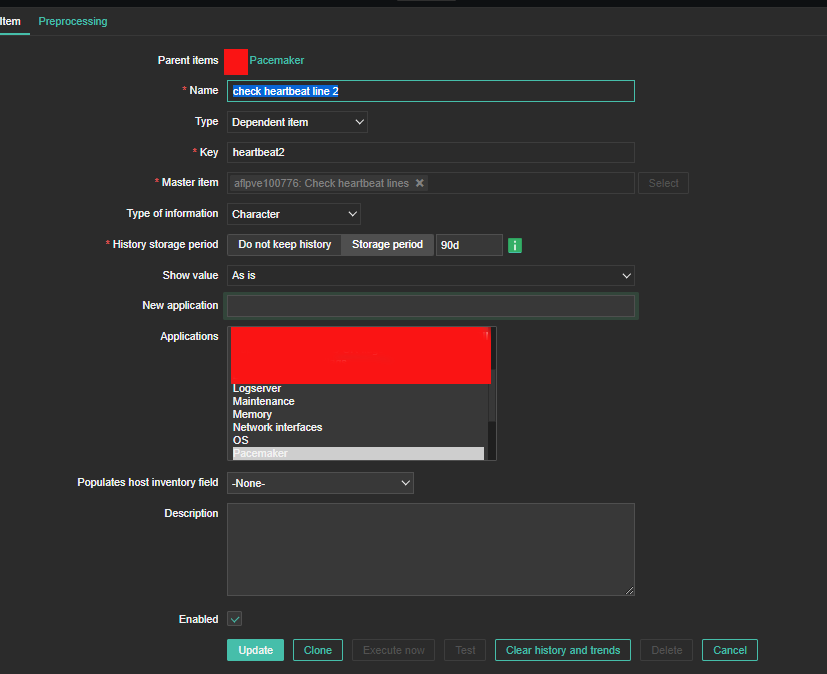
6. Create the Dependent Item required
 

zabbix-heartbeat-check-screenshots/heartbeat-line1-preprocessing

For processing you need to put the following simple regular expression

Name: Regular Expression
Parameters: hb1(\s+)(\d+)
Custom on fail: \2

zabbix-heartbeat-check-screenshots/heartbeat-line2-preprocessing1

zabbix-heartbeat-check-screenshots/heartbeat-lines-triggers


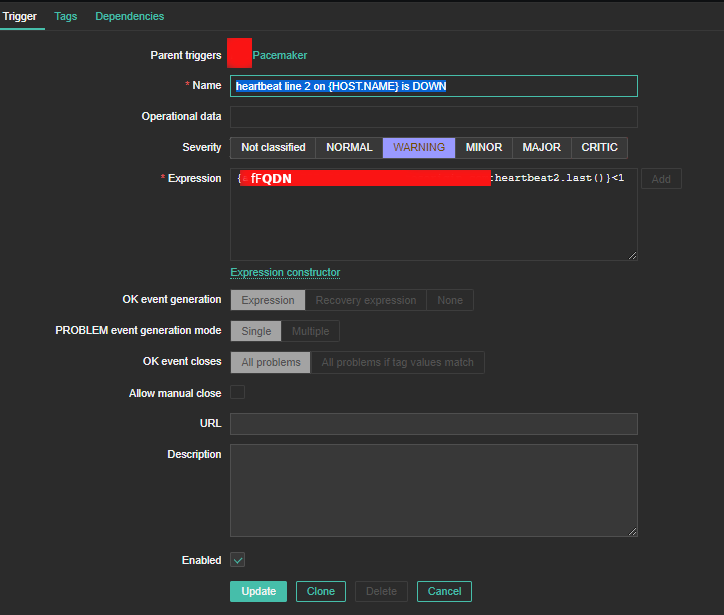
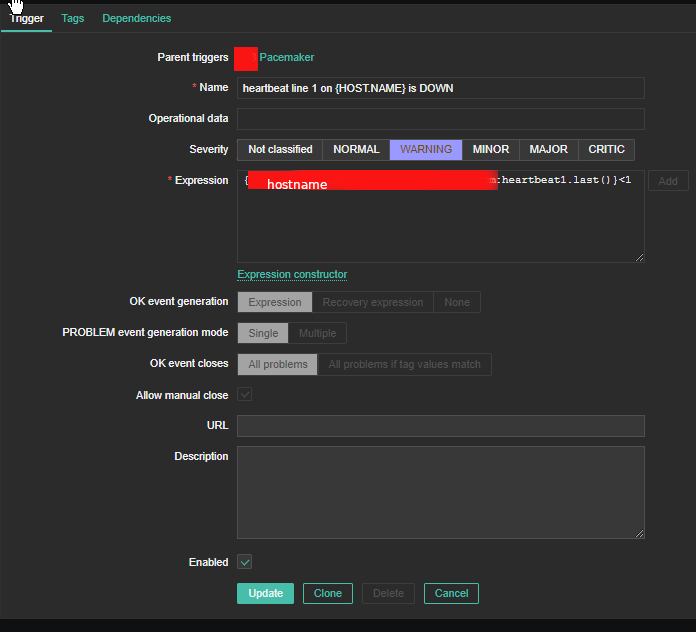
7. Create triggers that will be generating the Alert

Create the required triggers as well

zabbix-heartbeat-check-screenshots/heartbeat2-line
Main thing to configure here in Zabbix is below expression

Expression: {FQDN:heartbeat2.last()}<1

triggers_heartbeat1

You can further configure Zabbix Alerts to mail yourself or send via Slack / MatterMost or Teams alarms in case of problems.

Optimizing Linux TCP/IP Networking to increase Linux Servers Performance

Tuesday, April 8th, 2008

optimize-linux-servers-for-network-performance-to-increase-speed-and-decrease-hardware-costs-_tyan-exhibits-hpc-optimized-server-platforms-featuring-intel-xeon-processor-e7-4800-v3-e5-2600-supercomputing-15_full

Some time ago I thought of ways to optimize my Linux Servers network performance.

Even though there are plenty of nice articles on the topic on how to better optimize Linux server performance by tunning up the kernel sysctl (variables).

Many of the articles I found was not structed in enough understandable way so I decided togoogle around and  found few interesting websites which gives a good overview on how one can speed up a bit and decrease overall server loads by simply tuning few basic kernel sysctl variables.

Below article is a product of my research on the topic on how to increase my GNU / Linux servers performance which are mostly running LAMP (Linux / Apache / MySQL / PHP) together with Qmail mail servers.

The article is focusing on Networking as networking is usual bottleneck for performance.
Below are the variables I found useful for optimizing the Linux kernel Network stack.

Implementing the variables might reduce your server load or if not decrease server load times and CPU utilization, they would at lease increase thoroughput so more users will be able to access your servers with (hopefully) less interruptions.
That of course would save you some Hardware costs and raise up your Servers efficiency.

Here are the variables themselves and some good example:
 

# values.net.ipv4.ip_forward = 0 ( Turn off IP Forwarding )

net.ipv4.conf.default.rp_filter = 1

# ( Control Source route verification )
net.ipv4.conf.default.accept_redirects = 0

# ( Disable ICMP redirects )
net.ipv4.conf.all.accept_redirects = 0 ( same as above )
net.ipv4.conf.default.accept_source_route = 0

# ( Disable IP source routing )
net.ipv4.conf.all.accept_source_route = 0
( - || - )net.ipv4.tcp_fin_timeout = 40

# ( Decrease FIN timeout ) - Useful on busy/high load
serversnet.ipv4.tcp_keepalive_time = 4000 ( keepalive tcp timeout )
net.core.rmem_default = 786426 - Receive memory stack size ( a good idea to increase it if your server receives big files )
net.ipv4.tcp_rmem = "4096 87380 4194304"
net.core.wmem_default = 8388608 ( Reserved Memory per connection )
net.core.wmem_max = 8388608
net.core.optmem_max = 40960
( maximum amount of option memory buffers )

# like a homework investigate by yourself what the variables below stand for :)
net.ipv4.tcp_max_tw_buckets = 360000
net.ipv4.tcp_reordering = 5
net.core.hot_list_length = 256
net.core.netdev_max_backlog = 1024


# Below are newly added experimental
#net.core.rmem_max = 16777216
#net.core.wmem_max = 16777216
##kernel.msgmni = 1024
##kernel.sem = 250 256000 32 1024
##vm.swappiness=0
kernel.sched_migration_cost=5000000


Also a good sysctl.conf file which one might want to substitite or use as a skele for some productive server is ready for download here


Even if you can't reap out great CPU reduction benefits from integrating above values or similar ones, your overall LAMP performance to end customers should increase – at some occasions dramatically, at others little bit but still noticable.

If you're unsure on exact kernel variable values to use check yourself what should be the best values that fits you according to your server Hardware – usually this is done by experimenting and reading the kernel documentation as provided for each one of uplisted variables.

Above sysctl.conf is natively created to run on Debian and on other distributions like CentOS, Fedora Slackware some values might either require slight modifications.

Hope this helps and gives you some idea of how network optimization in Linux is usually done. Happy (hacking) tweakening !

Find all running hosts, used IPs and ports on your local wireless / ethernet network or how to do a basic network security audit with nmap

Monday, September 4th, 2017

Find all running hosts / used IPs on your local wireless or ethernet network

nmap-scn-local-network-find-all-running-hosts-used-IPs-on-your-wireless-ethernet-network

If you're using a Free Software OS such as GNU / Linux or some other proprietary OS such as Mac OS X or Windows and you need a quick way to check all running IPs hosts / nodes locally on your current connected Ethernet or Wireless network, here is how to do it with nmap (Network exploration and security tool port scanner).

So why would you do scan that? 

Well just for fun, out of curiousity or just because you want to inspect your local network whether someone unexpected cracker did not break and is not using your Wi-Fi or Ethernet local network and badly snoring your network listening for passwords.

Before you start you should have installed NMAP network scanner on your GNU / Linux, to do so on 

Redhat Based Linux (Fedora / CentOS / Redhat Enterprise RHEL):


yum -y install nmap


On Deb based GNU / Linux-es such as Ubuntu / Mint / Debian etc.


apt-get install –yes nmap


To install nmap on FreeBSD / NetBSD / OpenBSD OS issue from console or terminal:


cd /usr/ports/security/nmap
make install clean 


or if you prefer to install it from latest binary instead of compiling


pkg_add -vr nmap


On a proprietary Mac OS X (I don't recommend you to use this obnoxious OS which is designed as a proprpietary software to steal your freedom and control you, but anyways for Mac OS victims), you can do it to with Macs equivalent tool of apt-get / yum called homebrew:

Open Mac OS X terminal and to install homebrew run:


ruby -e "$(curl -fsSL https://raw.githubusercontent.com/Homebrew/install/master/install)"
brew install nmap
brew search nmap
brew info nmap


If you want to do it system wide become root (super user) from Mac terminal with


su root


and run above commands as administrator user.

Windows users might take a look at Nmap for Windows or use the M$ Windows native portqry command line port scanner

Test whether nmap is properly installed and ready to use with command:


nmap –help
Nmap 6.00 ( http://nmap.org )
Usage: nmap [Scan Type(s)] [Options] {target specification}
TARGET SPECIFICATION:
  Can pass hostnames, IP addresses, networks, etc.
  Ex: scanme.nmap.org, microsoft.com/24, 192.168.0.1; 10.0.0-255.1-254
  -iL <inputfilename>: Input from list of hosts/networks
  -iR <num hosts>: Choose random targets
  –exclude <host1[,host2][,host3],…>: Exclude hosts/networks
  –excludefile <exclude_file>: Exclude list from file
HOST DISCOVERY:
  -sL: List Scan – simply list targets to scan
  -sn: Ping Scan – disable port scan
  -Pn: Treat all hosts as online — skip host discovery
  -PS/PA/PU/PY[portlist]: TCP SYN/ACK, UDP or SCTP discovery to given ports
  -PE/PP/PM: ICMP echo, timestamp, and netmask request discovery probes
  -PO[protocol list]: IP Protocol Ping
  -n/-R: Never do DNS resolution/Always resolve [default: sometimes]
  –dns-servers <serv1[,serv2],…>: Specify custom DNS servers
  –system-dns: Use OS's DNS resolver
  –traceroute: Trace hop path to each host
SCAN TECHNIQUES:
  -sS/sT/sA/sW/sM: TCP SYN/Connect()/ACK/Window/Maimon scans
  -sU: UDP Scan
  -sN/sF/sX: TCP Null, FIN, and Xmas scans
  –scanflags <flags>: Customize TCP scan flags
  -sI <zombie host[:probeport]>: Idle scan
  -sY/sZ: SCTP INIT/COOKIE-ECHO scans
  -sO: IP protocol scan
  -b <FTP relay host>: FTP bounce scan
PORT SPECIFICATION AND SCAN ORDER:
  -p <port ranges>: Only scan specified ports
    Ex: -p22; -p1-65535; -p U:53,111,137,T:21-25,80,139,8080,S:9
  -F: Fast mode – Scan fewer ports than the default scan
  -r: Scan ports consecutively – don't randomize
  –top-ports <number>: Scan <number> most common ports
  –port-ratio <ratio>: Scan ports more common than <ratio>
SERVICE/VERSION DETECTION:
  -sV: Probe open ports to determine service/version info
  –version-intensity <level>: Set from 0 (light) to 9 (try all probes)
  –version-light: Limit to most likely probes (intensity 2)
  –version-all: Try every single probe (intensity 9)
  –version-trace: Show detailed version scan activity (for debugging)
SCRIPT SCAN:
  -sC: equivalent to –script=default
  –script=<Lua scripts>: <Lua scripts> is a comma separated list of 
           directories, script-files or script-categories
  –script-args=<n1=v1,[n2=v2,…]>: provide arguments to scripts
  –script-args-file=filename: provide NSE script args in a file
  –script-trace: Show all data sent and received
  –script-updatedb: Update the script database.
  –script-help=<Lua scripts>: Show help about scripts.
           <Lua scripts> is a comma separted list of script-files or
           script-categories.
OS DETECTION:
  -O: Enable OS detection
  –osscan-limit: Limit OS detection to promising targets
  –osscan-guess: Guess OS more aggressively
TIMING AND PERFORMANCE:
  Options which take <time> are in seconds, or append 'ms' (milliseconds),
  's' (seconds), 'm' (minutes), or 'h' (hours) to the value (e.g. 30m).
  -T<0-5>: Set timing template (higher is faster)
  –min-hostgroup/max-hostgroup <size>: Parallel host scan group sizes
  –min-parallelism/max-parallelism <numprobes>: Probe parallelization
  –min-rtt-timeout/max-rtt-timeout/initial-rtt-timeout <time>: Specifies
      probe round trip time.
  –max-retries <tries>: Caps number of port scan probe retransmissions.
  –host-timeout <time>: Give up on target after this long
  –scan-delay/–max-scan-delay <time>: Adjust delay between probes
  –min-rate <number>: Send packets no slower than <number> per second
  –max-rate <number>: Send packets no faster than <number> per second
FIREWALL/IDS EVASION AND SPOOFING:
  -f; –mtu <val>: fragment packets (optionally w/given MTU)
  -D <decoy1,decoy2[,ME],…>: Cloak a scan with decoys
  -S <IP_Address>: Spoof source address
  -e <iface>: Use specified interface
  -g/–source-port <portnum>: Use given port number
  –data-length <num>: Append random data to sent packets
  –ip-options <options>: Send packets with specified ip options
  –ttl <val>: Set IP time-to-live field
  –spoof-mac <mac address/prefix/vendor name>: Spoof your MAC address
  –badsum: Send packets with a bogus TCP/UDP/SCTP checksum
OUTPUT:
  -oN/-oX/-oS/-oG <file>: Output scan in normal, XML, s|<rIpt kIddi3,
     and Grepable format, respectively, to the given filename.
  -oA <basename>: Output in the three major formats at once
  -v: Increase verbosity level (use -vv or more for greater effect)
  -d: Increase debugging level (use -dd or more for greater effect)
  –reason: Display the reason a port is in a particular state
  –open: Only show open (or possibly open) ports
  –packet-trace: Show all packets sent and received
  –iflist: Print host interfaces and routes (for debugging)
  –log-errors: Log errors/warnings to the normal-format output file
  –append-output: Append to rather than clobber specified output files
  –resume <filename>: Resume an aborted scan
  –stylesheet <path/URL>: XSL stylesheet to transform XML output to HTML
  –webxml: Reference stylesheet from Nmap.Org for more portable XML
  –no-stylesheet: Prevent associating of XSL stylesheet w/XML output
MISC:
  -6: Enable IPv6 scanning
  -A: Enable OS detection, version detection, script scanning, and traceroute
  –datadir <dirname>: Specify custom Nmap data file location
  –send-eth/–send-ip: Send using raw ethernet frames or IP packets
  –privileged: Assume that the user is fully privileged
  –unprivileged: Assume the user lacks raw socket privileges
  -V: Print version number
  -h: Print this help summary page.
EXAMPLES:
  nmap -v -A scanme.nmap.org
  nmap -v -sn 192.168.0.0/16 10.0.0.0/8
  nmap -v -iR 10000 -Pn -p 80
SEE THE MAN PAGE (http://nmap.org/book/man.html) FOR MORE OPTIONS AND EXAMPLES


Most local router local networks are running under an IP range of 192.168.0.1/24 (192.168.0.1.254) or 192.168.1.1/24 or at some weird occasions depending on how the router is configured it might be something like 192.168.10.0/24 to be sure on what kind of network your computer is configured, you can check with ifconfig command, what kind of network IP has the router assigned to your computer, here is output from my Debian GNU / Linux /sbin/ifconfig


 hipo@noah:~$ /sbin/ifconfig 
lo        Link encap:Local Loopback  
          inet addr:127.0.0.1  Mask:255.0.0.0
          inet6 addr: ::1/128 Scope:Host
          UP LOOPBACK RUNNING  MTU:16436  Metric:1
          RX packets:336 errors:0 dropped:0 overruns:0 frame:0
          TX packets:336 errors:0 dropped:0 overruns:0 carrier:0
          collisions:0 txqueuelen:0 
          RX bytes:26656 (26.0 KiB)  TX bytes:26656 (26.0 KiB)


wlan0     Link encap:Ethernet  HWaddr 00:1c:bf:bd:27:59  
          inet addr:192.168.0.103  Bcast:192.168.0.255  Mask:255.255.255.0
          inet6 addr: fe80::21c:bfff:ffbd:2759/64 Scope:Link
          UP BROADCAST RUNNING MULTICAST  MTU:1500  Metric:1
          RX packets:112836 errors:0 dropped:0 overruns:0 frame:0
          TX packets:55363 errors:0 dropped:0 overruns:0 carrier:0
          collisions:0 txqueuelen:1000 
          RX bytes:141318655 (134.7 MiB)  TX bytes:7391330 (7.0 MiB)


As evident from above output my router assigns IPs via DHCP once authenticated into the Wi-Fi router under standard IP range of 192.168.0.0/24

So under this IP range case, to inspect my small local networkconnected computer I had to run from gnome-terminal or under a /dev/ttyX virtual console:


hipo@noah:~$ nmap -sn 192.168.0.0/24

Starting Nmap 6.00 ( http://nmap.org ) at 2017-09-04 12:45 EEST
Nmap scan report for pcfreak (192.168.0.1)
Host is up (0.011s latency).
Nmap scan report for 192.168.0.103
Host is up (0.00011s latency).
Nmap done: 256 IP addresses (2 hosts up) scanned in 2.53 seconds


-sn argument instructs nmap to do the so called ping scan, e.g. not to do a port s
can after host discovery but just print available hosts that are responding

Some bigger corporate networks are configured to run a couple of local networks simultaneously such as 192.168.168.0.0/24, 192.168.1.0/24, 192.168.2.0/24 etc.

So if that's the case you can add more virtual IPs to your ifconfig after becoming root super user with:


hipo@noah:~$ su root 
Password: 
root@noah:/home/hipo# 


And then run:


/sbin/ifconfig wlan0:0 192.168.1.110 netmask 255.255.255.0
/sbin/ifconfig wlan0:1 192.168.2.110 netmask 255.255.255.0


etc.

Note that here I purposefully choose .110 IP because often the 192.168.1.1 is an IP assigned to the router and that might cause some IP conflicts and trigger alarms in the router security which I want to avoid.

To check just added extra Virtual IPs on wlan0 wireless interface (note that depending on your Wi-Fi card and your driver this interface might come under a different name on your computer):


root@noah# /sbin/ifconfig |grep -i wlan0 -A 1
wlan0     Link encap:Ethernet  HWaddr 00:1c:bf:bd:25:59  
          inet addr:192.168.0.103  Bcast:192.168.0.255  Mask:255.255.255.0

wlan0:0   Link encap:Ethernet  HWaddr 00:1c:bf:bd:25:59  
          inet addr:192.168.1.110  Bcast:192.168.1.255  Mask:255.255.255.0

wlan0:1   Link encap:Ethernet  HWaddr 00:1c:bf:bd:27:59  
          inet addr:192.168.2.110  Bcast:192.168.2.255  Mask:255.255.255.0


If you're scanning not on your own network but on a public connected network you might prefer to not use the ping scan as this might identify you in router's firewall as possible intruder and could cause you headaches, besides that some network connected nodes are connected to not respond on a ping scan (some networks purposefully disable pings at all) to avoid possibility of the so called ping flood that might overload a router buffer or bring down hosts on the network beinf flooded.

If you have doubts that a network has ping disabled and it shows no result you can give a try to the so called SYN / FIN Stealth packet scan with added requirement to scan for UDP open ports (-sS) argument


root@noah:/~# nmap -sS -sU -sT 192.168.0.1-255

Starting Nmap 6.00 ( http://nmap.org ) at 2017-09-04 13:31 EEST
Nmap scan report for pcfreak (192.168.0.1)
Host is up (0.012s latency).
Not shown: 998 closed ports
PORT     STATE SERVICE
80/tcp   open  http
1900/tcp open  upnp
MAC Address: 10:FE:ED:43:CF:0E (Unknown)

Nmap scan report for 192.168.0.100
Host is up (0.0036s latency).
Not shown: 998 closed ports
PORT      STATE SERVICE
625/tcp   open  apple-xsrvr-admin
49153/tcp open  unknown
MAC Address: 84:38:35:5F:28:75 (Unknown)

Nmap scan report for 192.168.0.103
Host is up (0.000012s latency).
Not shown: 999 closed ports
PORT   STATE SERVICE
22/tcp open  ssh


You might also like to add some verbosy (that would generate a lot of output so be careful):

In case if above scan fails due to firewalls and you have a ping scan disabled on the network too you might also try out the so called nmap connect TCP connect scan (-sT), that would avoid the SYN scan. The -sT is useful also if you're not possessing root superprivileges on nmap running host.


nmap -sS -sU 192.168.0.1-255


Note that connect scan could take ages as nmap tries to connect every port from default port scanned ranged on remote found hosts that are reporting as up and running.

If the shown results lead you find some unknown computer / tablet / mobile / phone device connected to your network, then connect to your router and thoroughfully inspect the traffic flowing through it, if you find intruder cut him off and change immediately your router passwords and monitor your network periodically to make sure the unwanted guest did not go back in future.

There is much more you can do with nmap so if you have some extra time and interest into penetration testing I recommend you check out Nmap Book (The Official Nmap project guide to Network Discovery and Security Scanning)

How to check if your Linux WebServer is under a DoS attack

Friday, July 22nd, 2011

There are few commands I usually use to track if my server is possibly under a Denial of Service attack or under Distributed Denial of Service

Sys Admins who still have not experienced the terrible times of being under a DoS attack are happy people for sure …

1. How to Detect a TCP/IP Denial of Service Attack This are the commands I use to find out if a loaded Linux server is under a heavy DoS attack, one of the most essential one is of course netstat.
To check if a server is under a DoS attack with netstat, it’s common to use:

linux:~# netstat -ntu | awk '{print $5}' | cut -d: -f1 | sort | uniq -c | sort -n|wc -l

If the output of below command returns a result like 2000 or 3000 connections!, then obviously it’s very likely the server is under a DoS attack.

To check all the IPS currently connected to the Apache Webserver and get a very brief statistics on the number of times each of the IPs connected to my server, I use the cmd:

linux:~# netstat -ntu | awk '{print $5}' | cut -d: -f1 | sort | uniq -c | sort -n
221 80.143.207.107 233 145.53.103.70 540 82.176.164.36

As you could see from the above command output the IP 80.143.207.107 is either connected 221 times to the server or is in state of connecting or disconnecting to the node.

Another possible way to check, if a Linux or BSD server is under a Distributed DoS is with the list open files command lsof
Here is how lsof can be used to list the approximate number of ESTABLISHED connections to port 80.

linux:~# lsof -i TCP:80
litespeed 241931 nobody 17u IPv4 18372655 TCP server.www.pc-freak.net:http (LISTEN)
litespeed 241931 nobody 25u IPv4 18372659 TCP 85.17.159.89:http (LISTEN)
litespeed 241931 nobody 30u IPv4 29149647 TCP server.www.pc-freak.net:http->83.101.6.41:54565 (ESTABLISHED)
litespeed 241931 nobody 33u IPv4 18372647 TCP 85.17.159.93:http (LISTEN)
litespeed 241931 nobody 34u IPv4 29137514 TCP server.www.pc-freak.net:http->83.101.6.41:50885 (ESTABLISHED)
litespeed 241931 nobody 35u IPv4 29137831 TCP server.www.pc-freak.net:http->83.101.6.41:52312 (ESTABLISHED)
litespeed 241931 nobody 37w IPv4 29132085 TCP server.www.pc-freak.net:http->83.101.6.41:50000 (ESTABLISHED)

Another way to get an approximate number of established connections to let’s say Apache or LiteSpeed webserver with lsof can be achieved like so:

linux:~# lsof -i TCP:80 |wc -l
2100

I find it handy to keep track of above lsof command output every few secs with gnu watch , like so:

linux:~# watch "lsof -i TCP:80"

2. How to Detect if a Linux server is under an ICMP SMURF attack

ICMP attack is still heavily used, even though it’s already old fashioned and there are plenty of other Denial of Service attack types, one of the quickest way to find out if a server is under an ICMP attack is through the command:

server:~# while :; do netstat -s| grep -i icmp | egrep 'received|sent' ; sleep 1; done
120026 ICMP messages received
1769507 ICMP messages sent
120026 ICMP messages received
1769507 ICMP messages sent

As you can see the above one liner in a loop would check for sent and recieved ICMP packets every few seconds, if there are big difference between in the output returned every few secs by above command, then obviously the server is under an ICMP attack and needs to hardened.

3. How to detect a SYN flood with netstat

linux:~# netstat -nap | grep SYN | wc -l
1032

1032 SYNs per second is quite a high number and except if the server is not serving let’s say 5000 user requests per second, therefore as the above output reveals it’s very likely the server is under attack, if however I get results like 100/200 SYNs, then obviously there is no SYN flood targetting the machine 😉

Another two netstat command application, which helps determining if a server is under a Denial of Service attacks are:

server:~# netstat -tuna |wc -l
10012

and

server:~# netstat -tun |wc -l
9606

Of course there also some other ways to check the count the IPs who sent SYN to the webserver, for example:

server:~# netstat -n | grep :80 | grep SYN |wc -l

In many cases of course the top or htop can be useful to find, if many processes of a certain type are hanging around.

4. Checking if UDP Denial of Service is targetting the server

server:~# netstat -nap | grep 'udp' | awk '{print $5}' | cut -d: -f1 | sort |uniq -c |sort -n

The above command will list information concerning possible UDP DoS.

The command can easily be accustomed also to check for both possible TCP and UDP denial of service, like so:

server:~# netstat -nap | grep 'tcp|udp' | awk '{print $5}' | cut -d: -f1 | sort |uniq -c |sort -n
104 109.161.198.86
115 112.197.147.216
129 212.10.160.148
227 201.13.27.137
3148 91.121.85.220

If after getting an IP that has too many connections to the server and is almost certainly a DoS host you would like to filter this IP.

You can use the /sbin/route command to filter it out, using route will probably be a better choice instead of iptables, as iptables would load up the CPU more than simply cutting the route to the server.

Here is how I remove hosts to not be able to route packets to my server:

route add 110.92.0.55 reject

The above command would null route the access of IP 110.92.0.55 to my server.

Later on to look up for a null routed IP to my host, I use:

route -n |grep -i 110.92.0.55

Well hopefully this should be enough to give a brief overview on how, one can dig in his server and find if he is under a Distributed Denial of Service, hope it’s helpful to somebody out there.
Cheers 😉

How to disable ICMP ping protocol on Linux router with iptables to protect against ping Flood Denial of Service

Monday, October 14th, 2013

how to disable ping icmp protocol on linux server - how to drop incoming ping floods
Its useful to disable ICMP reply sometimes on Linux, especially if you have to deal with abusive script kiddies trying to DoS your host using ICMP Ping flood. Though ICMP Ping Flood is no longer so used as it used to be in past still there are some malicious users trying to use it to revenge a company for being mis-treated or simply because someone paid them to do financial loss to a company through DDoS-ing there internet portal or whatever …

From position of system administrator implementing a tiny one liner iptables rule protects severely against basic ICMP Ping Flood, the rule will not be hard to pass by experienced attacker but still will stop a lot of shit ICMP traffic:

Here is rule:

fw-server:~# iptables -I INPUT -j DROP -p icmp --icmp-type echo-request

Sometimes its necessary Filter IPs of certain hosts trying to DoS you to do so:

fw-server:~# iptables -I INPUT -s xxx.xxx.xxx.xxx -j DROP -p icmp --icmp-type echo-request

To disable ICMP ping requests on IPv6 protocol:

fw-server:~#ip6tables -I INPUT -p icmpv6 --icmp-type 8 -j DROP Note that above firewall rule does not drop all ICMP requests (as there are ICMP requests) necessary for standard TCP/IP or UDP applications to properly operate, but it DROPs packets of ICMP type (echo request).

If later its necessary to temporary enable ping on server quickest way is to FLUSH all INPUT chain temporary, i.e.:

fw-server:~# iptables -F INPUT

Whether necessary to just delete the PING echo-request DROP rule one can also use:

fw-server:~# iptables --list

and

fw-server:~# iptables -D INPUT 10

Here 10 number is the number of line number where DROP icmp rule is showing.

Well that's it now your server will be a bit more secure 😉 Enjoy

Enabling Active FTP connections on CentOS 5.5

Tuesday, January 4th, 2011

If you experience problems with making your CentoOS 5.5 work with active ftp connections , e.g. every connection you make to the FTP needs to be in a passive mode or the file transfer or FTP directory listing doesn’t initialize at all, here is how you can solve it:

Edit the file /etc/sysconfig/iptables-config and change their the line:

IPTABLES_MODULES="ip_conntrack_netbios_ns"

to look like:

IPTABLES_MODULES=”ip_conntrack_netbios_ns ip_nat_ftp ip_conntrack_ftp”

Adding the two modules ip_nat_ftp and ip_conntrack_ftp will instruct the CentOS’s /etc/init.d/iptables firewall rules to initialize the kernel modules ip_nat_ftp and ip_conntrack_ftp

This modules solves problems with Active FTP not working caused by a host running behind a firewall router or behind a NAT.

This will hopefully resolve your issues with Active FTP not working on CentOS.

If loading this two kernel modules doesn’t solve the issues and you’re running vsftpd FTP server, then it’s likely that the Active FTP non-working problems are caused by your VSFTPD configuration.

If that’s the case something that might help is setting in /etc/vsftpd/vsftpd.conf the following variables:

pasv_enable=NO
pasv_promiscuous=YES

Of course as a final step you will need to restart the iptables firewall:

[root@centos: ~]# /etc/init.d/iptables restart
Flushing firewall rules: [ OK ]
Setting chains to policy ACCEPT: filter [ OK ]
Unloading iptables modules: [ OK ]
Applying iptables firewall rules: [ OK ]
Loading additional iptables modules: ip_conntrack_netbios_ns
ip_nat_ftp ip_conntrack_ftp [ OK ]

As you can see the two modules ip_nat_ftp and ip_conntrack_ftp are now loaded as additional modules.
Moreover if you have also modified your vsftpd.conf you need to restart the vsftpd via the init script:

[root@centos: ~]# /etc/init.d/vsftpd restart
Shutting down vsftpd: [ OK ]
Starting vsftpd for vsftpd: [ OK ]

If adding this two modules and adding this two extra variables in vsftpd configuration doesn’t help with making your FTP server to work in Active FTP mode , it’s very likely that the whole troubles comes from the firewall configuration, so an edit of /etc/sysconfig/iptables would be necessary;

To find out if the firewall is the source of the FTP not able to enter active mode, stop your firewall for a while by issuing the cmd:

[root@centos:~]# /etc/init.d/iptables stop

If iptables is the source of thepassive ftp troubles, an iptables rules similar to this should make your firewall allow active ftp connections;

*filter :INPUT ACCEPT [0:0]
:FORWARD ACCEPT [0:0]
:OUTPUT ACCEPT
[0:0] -A INPUT -i lo -j ACCEPT -A INPUT -d 127.0.0.0/255.0.0.0 -i ! lo -j REJECT –reject-with icmp-port-unreachable
-A INPUT -m state –state RELATED,ESTABLISHED -j ACCEPT
-A INPUT -p tcp -m tcp –dport 80 -j ACCEPT
-A INPUT -p tcp -m state –state NEW -m tcp –dport 44444 -j ACCEPT
-A INPUT -p tcp -m state –state NEW -m tcp –dport 21 -j ACCEPT -A INPUT -p icmp -m icmp –icmp-type 8 -j ACCEPT
-A INPUT -j REJECT –reject-with icmp-port-unreachable -A FORWARD -j REJECT –reject-with icmp-port-unreachable
-A OUTPUT -j ACCEPT -A OUTPUT -p tcp -m tcp –dport 21 -m state –state ESTABLISHED,RELATED -j ACCEPT


How to start a process in background and keep it running after the console / terminal is closed on Linux and FreeBSD

Tuesday, November 29th, 2011

The classical way to keep a process running in background after log out of a shell is using screen
Anyways using screen is not the only way to detach a running process , GNU / Linux and BSDs (Free, Open, Net BSDs) had a command nohup which aim is to run a command immune to hangups, with output to a non-tty

Let’s say one wants to keep track (log) constantly ICMP traffic to a certain host with ping command on a UNIX server / desktop which doesn’t have the screen manager … terminal emulation program installed. Achieving this task is possible with nohup cmd by backgrounding the ping process, like so:

guoi@host:~$ nohup ping google.com >ping.log &[1] 45931hipo@host:~$ nohup: ignoring input and redirecting stderr to stdout

Afterwards even after closing up the opened ssh session or console (tty) / terminal (pts) on which the ping process is background nohup prevents the ping to be sent kill SIGNAL so the process continues running in the background.

Later on to check in real time the statistics of the continuous ICMP ping requests tail, less, or cat can be used for example watching the tail:

hipo@host:~$ tail -f ping.log
64 bytes from fx-in-f106.1e100.net (74.125.39.106): icmp_req=562 ttl=51 time=44.0 ms
64 bytes from fx-in-f106.1e100.net (74.125.39.106): icmp_req=563 ttl=51 time=43.8 ms
64 bytes from fx-in-f106.1e100.net (74.125.39.106): icmp_req=564 ttl=51 time=43.3 ms
64 bytes from fx-in-f106.1e100.net (74.125.39.106): icmp_req=565 ttl=51 time=43.1 ms
64 bytes from fx-in-f106.1e100.net (74.125.39.106): icmp_req=566 ttl=51 time=43.4 ms
64 bytes from fx-in-f106.1e100.net (74.125.39.106): icmp_req=567 ttl=51 time=43.6 ms

I’m using Linux / BSD for quite a lot of time and never before put in use the nohup cmd I guess there are more ppl who never heard of this handy UNIX basic command. Hope I’m not the only one who never heard about it and its useful knowledge to someone out. Cheers 😉

How to check Host is up with Nagios for servers with disabled ICMP (ping) protocol

Friday, July 15th, 2011

At the company where I administrate some servers, they’re running Nagios to keep track of the servers status and instantly report if problems with connectivity to certain servers occurs.

Now one of the servers which had configured UP host checks is up, but because of heavy ICMP denial of service attacks to the servers the ICMP protocol ping is completely disabled.

In Nagios this host was constantly showing as DOWN in the usual red color, so nagios reported issue even though all services on the client are running fine.

As this is quite annoying, I checked if Nagios supports host checking without doing the ICMP ping test. It appeared it does through something called in nagios Submit passive check result for host

Enabling the “Submit passive check result for this host” could be done straight from Nagios’s web interface (so I don’t even have to edit configurations! ;).
Here is how I did it. In Nagios I had to navigate to:

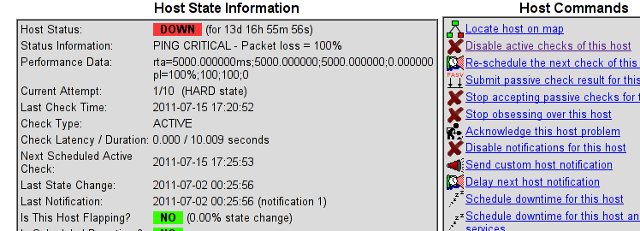
Hosts -> Click over my host (hosting1) which showed in red as down

Nagios disable ICMP ping report for hosts

You see my down host which I clicked over showing in red in above pic.

On next Nagios screen I had to select, Disable active checks of this host

Nagios Disable active ICMP checks of this host
and press on the Commit button.

Next following text appears on browser:

Your command request was successfully submitted to Nagios for processing.

Note: It may take a while before the command is actually processed.

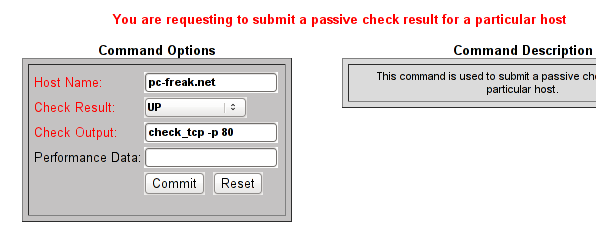
Afterwards I had to click on Submit passive check result for this host and in:
Check Output to type in:

check_tcp -p 80

Here is the Screenshot of the Command Options dialog:

Nagios submit passive check with check TCP -p 80

That’s all now Nagious should start checking the down host by doing a query if the webserver on port 80 is up and running instead of pinging it.
As well as the server is no longer shown in the Nagio’s Down host list.