Posts Tagged ‘frontend’

How to disable haproxy log for certain frontend / backend or stop haproxy logging completely

Wednesday, September 14th, 2022

haproxy-disable-logging-for-single-frontend-or-backend-or-stop-message-logging-completely-globally

In my previous article I've shortly explained on how it is possible to configure multiple haproxy instances to log in separate log files as well as how to configure a specific frontend to log inside a separate file. Sometimes it is simply unnecessery to keep any kind of log file for haproxy to spare disk space or even for anonymity of traffic. Hence in this tiny article will explain how to disable globally logging for haproxy and how logging for a certain frontend or backend could be stopped.

1. Disable globally logging of haproxy service
 

Disabling globally logging for haproxy in case if you don't need the log is being achieved by redirecting the log variable to /dev/null handler and to also mute the reoccurring alert, notice and info messages, that are produced in case of some extra ordinary events during start / stop of haproxy or during mising backends etc. you can send those messages to local0 and loca1 handlers which will be discarded later by rsyslogd configuration, for example thsi can be achieved with a configuration like:
 

global     log /dev/log    local0 info alert     log /dev/log    local1 notice alert  defaults log global mode http option httplog option dontlognull


<level>    is optional and can be specified to filter outgoing messages. By
           default, all messages are sent. If a level is specified, only
           messages with a severity at least as important as this level
           will be sent. An optional minimum level can be specified. If it
           is set, logs emitted with a more severe level than this one will
           be capped to this level. This is used to avoid sending "emerg"
           messages on all terminals on some default syslog configurations.
           Eight levels are known :
             emerg  alert  crit   err    warning notice info  debug


By using the log level you can also tell haproxy to omit from logging errors from log if for some reasons haproxy receives a lot of errors and this is flooding your logs, like this:

    backend Backend_Interface
  http-request set-log-level err
  no log


But sometimes you might need to disable it for a single frontend only and comes the question.


2. How to disable logging for a single frontend interface?

I thought that might be more complex but it was pretty easy with the option dontlog-normal haproxy.cfg variable:

Here is sample configuration with frontend and backend on how to instrucruct the haproxy frontend to disable all logging for the frontend
 

frontend ft_Frontend_Interface
#        log  127.0.0.1 local4 debug
        bind 10.44.192.142:12345
       
option dontlog-normal
        mode tcp
        option tcplog

              timeout client 350000
        log-format [%t]\ %ci:%cp\ %fi:%fp\ %b/%s:%sp\ %Tw/%Tc/%Tt\ %B\ %ts\ %ac/%fc/%bc/%sc/%rc\ %sq/%bq
        default_backend bk_WLP_echo_port_service

backend bk_Backend_Interface
                        timeout server 350000
                        timeout connect 35000
        server serverhost1 10.10.192.12:12345 weight 1 check port 12345
        server serverhost2 10.10.192.13:12345 weight 3 check port 12345


As you can see from those config, we have also enabled as a check port 12345 which is the application port service if something goes wrong with the application and 12345 is not anymore responding the respective server will get excluded automatically by haproxy and only one of machines will serve, the weight tells it which server will have the preference to serve the traffic the weight ratio will be 1 request will end up on one machine and 3 requests on the other machine.


3. How to disable single configured backend to not log anything but still have a log for the frontend
 

Omit the use of option dontlog normal from frontend inside the backend just set  no log:

backend bk_Backend_Interface
                       
 no log
                        timeout server 350000
                        timeout connect 35000
        server serverhost1 10.10.192.12:12345 weight 1 check port 12345
        server serverhost2 10.10.192.13:12345 weight 3 check port 12345

That's all reload haproxy service on the machine and backend will no longer log to your default configured log file via the respective local0 – local6 handler.

How to monitor Haproxy Application server backends with Zabbix userparameter autodiscovery scripts

Friday, May 13th, 2022

zabbix-backend-monitoring-logo

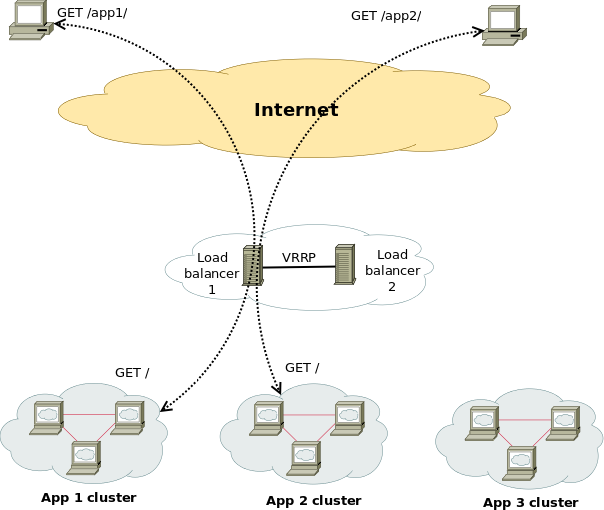
Haproxy is doing quite a good job in High Availability tasks where traffic towards multiple backend servers has to be redirected based on the available one to sent data from the proxy to. 

Lets say haproxy is configured to proxy traffic for App backend machine1 and App backend machine2.

Usually in companies people configure a monitoring like with Icinga or Zabbix / Grafana to keep track on the Application server is always up and running. Sometimes however due to network problems (like burned Network Switch / router or firewall misconfiguration) or even an IP duplicate it might happen that Application server seems to be reporting reachable from some monotoring tool on it but unreachable from  Haproxy server -> App backend machine2 but reachable from App backend machine1. And even though haproxy will automatically switch on the traffic from backend machine2 to App machine1. It is a good idea to monitor and be aware that one of the backends is offline from the Haproxy host.
In this article I'll show you how this is possible by using 2 shell scripts and userparameter keys config through the autodiscovery zabbix legacy feature.
Assumably for the setup to work you will need to have as a minimum a Zabbix server installation of version 5.0 or higher.

1. Create the required  haproxy_discovery.sh  and haproxy_stats.sh scripts 

You will have to install the two scripts under some location for example we can put it for more clearness under /etc/zabbix/scripts

[root@haproxy-server1 ]# mkdir /etc/zabbix/scripts

[root@haproxy-server1 scripts]# vim haproxy_discovery.sh 
#!/bin/bash
#
# Get list of Frontends and Backends from HAPROXY
# Example: ./haproxy_discovery.sh [/var/lib/haproxy/stats] FRONTEND|BACKEND|SERVERS
# First argument is optional and should be used to set location of your HAPROXY socket
# Second argument is should be either FRONTEND, BACKEND or SERVERS, will default to FRONTEND if not set
#
# !! Make sure the user running this script has Read/Write permissions to that socket !!
#
## haproxy.cfg snippet
#  global
#  stats socket /var/lib/haproxy/stats  mode 666 level admin

HAPROXY_SOCK=""/var/run/haproxy/haproxy.sock
[ -n “$1” ] && echo $1 | grep -q ^/ && HAPROXY_SOCK="$(echo $1 | tr -d '\040\011\012\015')"

if [[ “$1” =~ (25[0-5]|2[0-4][0-9]|[01]?[0-9][0-9]?)\.(25[0-5]|2[0-4][0-9]|[01]?[0-9][0-9]?)\.(25[0-5]|2[0-4][0-9]|[01]?[0-9][0-9]?)\.(25[0-5]|2[0-4][0-9]|[01]?[0-9][0-9]?):[0-9]{1,5} ]];
then
    HAPROXY_STATS_IP="$1"
    QUERYING_METHOD="TCP"
fi

QUERYING_METHOD="${QUERYING_METHOD:-SOCKET}"

query_stats() {
    if [[ ${QUERYING_METHOD} == “SOCKET” ]]; then
        echo "show stat" | socat ${HAPROXY_SOCK} stdio 2>/dev/null
    elif [[ ${QUERYING_METHOD} == “TCP” ]]; then
        echo "show stat" | nc ${HAPROXY_STATS_IP//:/ } 2>/dev/null
    fi
}

get_stats() {
        echo "$(query_stats)" | grep -v "^#"
}

[ -n “$2” ] && shift 1
case $1 in
        B*) END="BACKEND" ;;
        F*) END="FRONTEND" ;;
        S*)
                for backend in $(get_stats | grep BACKEND | cut -d, -f1 | uniq); do
                        for server in $(get_stats | grep "^${backend}," | grep -v BACKEND | grep -v FRONTEND | cut -d, -f2); do
                                serverlist="$serverlist,\n"'\t\t{\n\t\t\t"{#BACKEND_NAME}":"'$backend'",\n\t\t\t"{#SERVER_NAME}":"'$server'"}'
                        done
                done
                echo -e '{\n\t"data":[\n’${serverlist#,}’]}'
                exit 0
        ;;
        *) END="FRONTEND" ;;
esac

for frontend in $(get_stats | grep "$END" | cut -d, -f1 | uniq); do
    felist="$felist,\n"'\t\t{\n\t\t\t"{#'${END}'_NAME}":"'$frontend'"}'
done
echo -e '{\n\t"data":[\n’${felist#,}’]}'


[root@haproxy-server1 scripts]# vim haproxy_stats.sh 
#!/bin/bash
set -o pipefail

if [[ “$1” = /* ]]
then
  HAPROXY_SOCKET="$1"
  shift 0
else
  if [[ “$1” =~ (25[0-5]|2[0-4][0-9]|[01]?[0-9][0-9]?)\.(25[0-5]|2[0-4][0-9]|[01]?[0-9][0-9]?)\.(25[0-5]|2[0-4][0-9]|[01]?[0-9][0-9]?)\.(25[0-5]|2[0-4][0-9]|[01]?[0-9][0-9]?):[0-9]{1,5} ]];
  then
    HAPROXY_STATS_IP="$1"
    QUERYING_METHOD="TCP"
    shift 1
  fi
fi

pxname="$1"
svname="$2"
stat="$3"

DEBUG=${DEBUG:-0}
HAPROXY_SOCKET="${HAPROXY_SOCKET:-/var/run/haproxy/haproxy.sock}"
QUERYING_METHOD="${QUERYING_METHOD:-SOCKET}"
CACHE_STATS_FILEPATH="${CACHE_STATS_FILEPATH:-/var/tmp/haproxy_stats.cache}"
CACHE_STATS_EXPIRATION="${CACHE_STATS_EXPIRATION:-1}" # in minutes
CACHE_INFO_FILEPATH="${CACHE_INFO_FILEPATH:-/var/tmp/haproxy_info.cache}" ## unused
CACHE_INFO_EXPIRATION="${CACHE_INFO_EXPIRATION:-1}" # in minutes ## unused
GET_STATS=${GET_STATS:-1} # when you update stats cache outsise of the script
SOCAT_BIN="$(which socat)"
NC_BIN="$(which nc)"
FLOCK_BIN="$(which flock)"
FLOCK_WAIT=15 # maximum number of seconds that "flock" waits for acquiring a lock
FLOCK_SUFFIX='.lock'
CUR_TIMESTAMP="$(date '+%s')"

debug() {
  [ “${DEBUG}” -eq 1 ] && echo "DEBUG: $@" >&2 || true
}

debug "SOCAT_BIN        => $SOCAT_BIN"
debug "NC_BIN           => $NC_BIN"
debug "FLOCK_BIN        => $FLOCK_BIN"
debug "FLOCK_WAIT       => $FLOCK_WAIT seconds"
debug "CACHE_FILEPATH   => $CACHE_FILEPATH"
debug "CACHE_EXPIRATION => $CACHE_EXPIRATION minutes"
debug "HAPROXY_SOCKET   => $HAPROXY_SOCKET"
debug "pxname   => $pxname"
debug "svname   => $svname"
debug "stat     => $stat"

# check if socat is available in path
if [ “$GET_STATS” -eq 1 ] && [[ $QUERYING_METHOD == “SOCKET” && -z “$SOCAT_BIN” ]] || [[ $QUERYING_METHOD == “TCP” &&  -z “$NC_BIN” ]]
then
  echo 'ERROR: cannot find socat binary'
  exit 126
fi

# if we are getting stats:
#   check if we can write to stats cache file, if it exists
#     or cache file path, if it does not exist
#   check if HAPROXY socket is writable
# if we are NOT getting stats:
#   check if we can read the stats cache file
if [ “$GET_STATS” -eq 1 ]
then
  if [ -e “$CACHE_FILEPATH” ] && [ ! -w “$CACHE_FILEPATH” ]
  then
    echo 'ERROR: stats cache file exists, but is not writable'
    exit 126
  elif [ ! -w ${CACHE_FILEPATH%/*} ]
  then
    echo 'ERROR: stats cache file path is not writable'
    exit 126
  fi
  if [[ $QUERYING_METHOD == “SOCKET” && ! -w $HAPROXY_SOCKET ]]
  then
    echo "ERROR: haproxy socket is not writable"
    exit 126
  fi
elif [ ! -r “$CACHE_FILEPATH” ]
then
  echo 'ERROR: cannot read stats cache file'
  exit 126
fi

# index:name:default
MAP="
1:pxname:@
2:svname:@
3:qcur:9999999999
4:qmax:0
5:scur:9999999999
6:smax:0
7:slim:0
8:stot:@
9:bin:9999999999
10:bout:9999999999
11:dreq:9999999999
12:dresp:9999999999
13:ereq:9999999999
14:econ:9999999999
15:eresp:9999999999
16:wretr:9999999999
17:wredis:9999999999
18:status:UNK
19:weight:9999999999
20:act:9999999999
21:bck:9999999999
22:chkfail:9999999999
23:chkdown:9999999999
24:lastchg:9999999999
25:downtime:0
26:qlimit:0
27:pid:@
28:iid:@
29:sid:@
30:throttle:9999999999
31:lbtot:9999999999
32:tracked:9999999999
33:type:9999999999
34:rate:9999999999
35:rate_lim:@
36:rate_max:@
37:check_status:@
38:check_code:@
39:check_duration:9999999999
40:hrsp_1xx:@
41:hrsp_2xx:@
42:hrsp_3xx:@
43:hrsp_4xx:@
44:hrsp_5xx:@
45:hrsp_other:@
46:hanafail:@
47:req_rate:9999999999
48:req_rate_max:@
49:req_tot:9999999999
50:cli_abrt:9999999999
51:srv_abrt:9999999999
52:comp_in:0
53:comp_out:0
54:comp_byp:0
55:comp_rsp:0
56:lastsess:9999999999
57:last_chk:@
58:last_agt:@
59:qtime:0
60:ctime:0
61:rtime:0
62:ttime:0
"

_STAT=$(echo -e "$MAP" | grep :${stat}:)
_INDEX=${_STAT%%:*}
_DEFAULT=${_STAT##*:}

debug "_STAT    => $_STAT"
debug "_INDEX   => $_INDEX"
debug "_DEFAULT => $_DEFAULT"

# check if requested stat is supported
if [ -z “${_STAT}” ]
then
  echo "ERROR: $stat is unsupported"
  exit 127
fi

# method to retrieve data from haproxy stats
# usage:
# query_stats "show stat"
query_stats() {
    if [[ ${QUERYING_METHOD} == “SOCKET” ]]; then
        echo $1 | socat ${HAPROXY_SOCKET} stdio 2>/dev/null
    elif [[ ${QUERYING_METHOD} == “TCP” ]]; then
        echo $1 | nc ${HAPROXY_STATS_IP//:/ } 2>/dev/null
    fi
}

# a generic cache management function, that relies on 'flock'
check_cache() {
  local cache_type="${1}"
  local cache_filepath="${2}"
  local cache_expiration="${3}"  
  local cache_filemtime
  cache_filemtime=$(stat -c '%Y' "${cache_filepath}" 2> /dev/null)
  if [ $((cache_filemtime+60*cache_expiration)) -ge ${CUR_TIMESTAMP} ]
  then
    debug "${cache_type} file found, results are at most ${cache_expiration} minutes stale.."
  elif "${FLOCK_BIN}" –exclusive –wait "${FLOCK_WAIT}" 200
  then
    cache_filemtime=$(stat -c '%Y' "${cache_filepath}" 2> /dev/null)
    if [ $((cache_filemtime+60*cache_expiration)) -ge ${CUR_TIMESTAMP} ]
    then
      debug "${cache_type} file found, results have just been updated by another process.."
    else
      debug "no ${cache_type} file found, querying haproxy"
      query_stats "show ${cache_type}" > "${cache_filepath}"
    fi
  fi 200> "${cache_filepath}${FLOCK_SUFFIX}"
}

# generate stats cache file if needed
get_stats() {
  check_cache 'stat' "${CACHE_STATS_FILEPATH}" ${CACHE_STATS_EXPIRATION}
}

# generate info cache file
## unused at the moment
get_info() {
  check_cache 'info' "${CACHE_INFO_FILEPATH}" ${CACHE_INFO_EXPIRATION}
}

# get requested stat from cache file using INDEX offset defined in MAP
# return default value if stat is ""
get() {
  # $1: pxname/svname
  local _res="$("${FLOCK_BIN}" –shared –wait "${FLOCK_WAIT}" "${CACHE_STATS_FILEPATH}${FLOCK_SUFFIX}" grep $1 "${CACHE_STATS_FILEPATH}")"
  if [ -z “${_res}” ]
  then
    echo "ERROR: bad $pxname/$svname"
    exit 127
  fi
  _res="$(echo $_res | cut -d, -f ${_INDEX})"
  if [ -z “${_res}” ] && [[ “${_DEFAULT}” != “@” ]]
  then
    echo "${_DEFAULT}"  
  else
    echo "${_res}"
  fi
}

# not sure why we'd need to split on backslash
# left commented out as an example to override default get() method
# status() {
#   get "^${pxname},${svnamem}," $stat | cut -d\  -f1
# }

# this allows for overriding default method of getting stats
# name a function by stat name for additional processing, custom returns, etc.
if type get_${stat} >/dev/null 2>&1
then
  debug "found custom query function"
  get_stats && get_${stat}
else
  debug "using default get() method"
  get_stats && get "^${pxname},${svname}," ${stat}
fi


! NB ! Substitute in the script /var/run/haproxy/haproxy.sock with your haproxy socket location

You can download the haproxy_stats.sh here and haproxy_discovery.sh here

2. Create the userparameter_haproxy_backend.conf

[root@haproxy-server1 zabbix_agentd.d]# cat userparameter_haproxy_backend.conf 
#
# Discovery Rule
#

# HAProxy Frontend, Backend and Server Discovery rules
UserParameter=haproxy.list.discovery[*],sudo /etc/zabbix/scripts/haproxy_discovery.sh SERVER
UserParameter=haproxy.stats[*],sudo /etc/zabbix/scripts/haproxy_stats.sh  $2 $3 $4

# support legacy way

UserParameter=haproxy.stat.downtime[*],sudo /etc/zabbix/scripts/haproxy_stats.sh  $2 $3 downtime

UserParameter=haproxy.stat.status[*],sudo /etc/zabbix/scripts/haproxy_stats.sh  $2 $3 status

UserParameter=haproxy.stat.last_chk[*],sudo /etc/zabbix/scripts/haproxy_stats.sh  $2 $3 last_chk


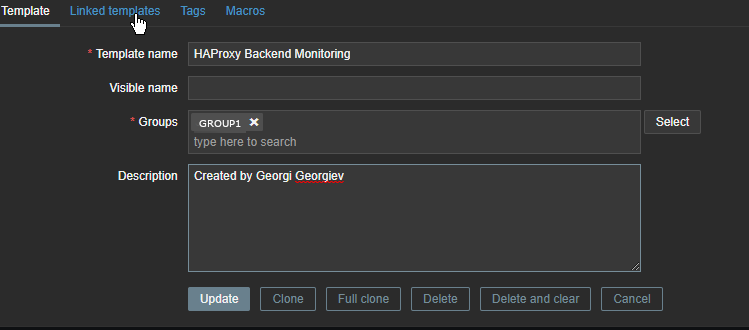
3. Create new simple template for the Application backend Monitoring and link it to monitored host

create-configuration-template-backend-monitoring

create-template-backend-monitoring-macros


Go to Configuration -> Hosts (find the host) and Link the template to it


4. Restart Zabbix-agent, in while check autodiscovery data is in Zabbix Server

[root@haproxy-server1 ]# systemctl restart zabbix-agent


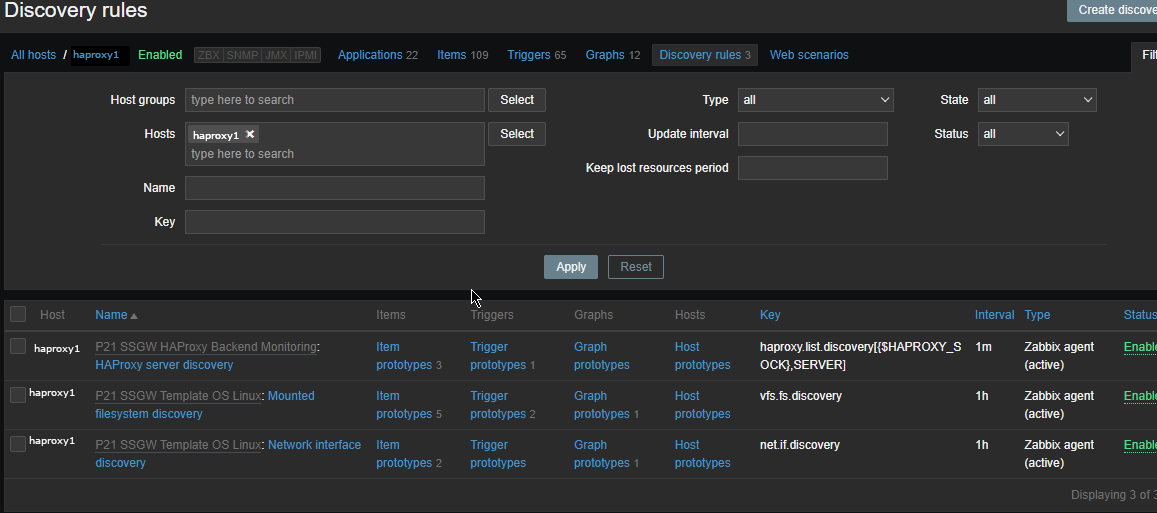
Check in zabbix the userparameter data arrives, it should not be required to add any Items or Triggers as autodiscovery zabbix feature should automatically create in the server what is required for the data regarding backends to be in.

To view data arrives go to Zabbix config menus:

Configuration -> Hosts -> Hosts: (lookup for the haproxy-server1 hostname)

zabbix-discovery_rules-screenshot

The autodiscovery should have automatically created the following prototypes

zabbix-items-monitoring-prototypes
Now if you look inside Latest Data for the Host you should find some information like:

HAProxy Backend [backend1] (3 Items)
        
HAProxy Server [backend-name_APP/server1]: Connection Response
2022-05-13 14:15:04            History
        
HAProxy Server [backend-name/server2]: Downtime (hh:mm:ss)
2022-05-13 14:13:57    20:30:42        History
        
HAProxy Server [bk_name-APP/server1]: Status
2022-05-13 14:14:25    Up (1)        Graph
        ccnrlb01    HAProxy Backend [bk_CCNR_QA_ZVT] (3 Items)
        
HAProxy Server [bk_name-APP3/server1]: Connection Response
2022-05-13 14:15:05            History
        
HAProxy Server [bk_name-APP3/server1]: Downtime (hh:mm:ss)
2022-05-13 14:14:00    20:55:20        History
        
HAProxy Server [bk_name-APP3/server2]: Status
2022-05-13 14:15:08    Up (1)

To make alerting in case if a backend is down which usually you would like only left thing is to configure an Action to deliver alerts to some email address.

Webserver farm behind Load Balancer Proxy or how to preserve incoming internet IP to local net IP Apache webservers by adding additional haproxy header with remoteip

Monday, April 18th, 2022

logo-haproxy-apache-remoteip-configure-and-check-to-have-logged-real-ip-address-inside-apache-forwarded-from-load-balancer

Having a Proxy server for Load Balancing is a common solutions to assure High Availability of Web Application service behind a proxy.
You can have for example 1 Apache HTTPD webservers serving traffic Actively on one Location (i.e. one city or Country) and 3 configured in the F5 LB or haproxy to silently keep up and wait for incoming connections as an (Active Failure) Backup solution

Lets say the Webservers usually are set to have local class C IPs as 192.168.0.XXX or 10.10.10.XXX and living in isolated DMZed well firewalled LAN network and Haproxy is configured to receive traffic via a Internet IP 109.104.212.13 address and send the traffic in mode tcp via a NATTed connection (e.g. due to the network address translation the source IP of the incoming connections from Intenet clients appears as the NATTed IP 192.168.1.50.

The result is that all incoming connections from haproxy -> webservers will be logged in Webservers /var/log/apache2/access.log wrongly as incoming from source IP: 192.168.1.50, meaning all the information on the source Internet Real IP gets lost.

load-balancer-high-availailibility-haproxy-apache
 

How to pass Real (Internet) Source IPs from Haproxy "mode tcp" to Local LAN Webservers  ?
 

Usually the normal way to work around this with Apache Reverse Proxies configured is to use HTTP_X_FORWARDED_FOR variable in haproxy when using HTTP traffic application that is proxied (.e.g haproxy.cfg has mode http configured), you have to add to listen listener_name directive or frontend Frontend_of_proxy

option forwardfor
option http-server-close

However unfortunately, IP Header preservation with X_FORWADED_FOR  HTTP-Header is not possible when haproxy is configured to forward traffic using mode tcp.

Thus when you're forced to use mode tcp to completely pass any traffic incoming to Haproxy from itself to End side, the solution is to
 

  • Use mod_remoteip infamous module that is part of standard Apache installs both on apache2 installed from (.deb) package  or httpd rpm (on redhats / centos).


1. Configure Haproxies to send received connects as send-proxy traffic


The idea is very simple all the received requests from outside clients to Haproxy are to be send via the haproxy to the webserver in a PROXY protocol string, this is done via send-proxy

             send-proxy  – send a PROXY protocol string

Rawly my current /etc/haproxy/haproxy.cfg looks like this:
 

global
        log /dev/log    local0
        log /dev/log    local1 notice
        chroot /var/lib/haproxy
        user haproxy
        group haproxy
        daemon
        maxconn 99999
        nbproc          1
        nbthread 2
        cpu-map         1 0
        cpu-map         2 1


defaults
        log     global
       mode    tcp


        timeout connect 5000
        timeout connect 30s
        timeout server 10s

    timeout queue 5s
    timeout tunnel 2m
    timeout client-fin 1s
    timeout server-fin 1s

                option forwardfor

    retries                 15


frontend http-in
                mode tcp

                option tcplog
        log global

                option logasap
                option forwardfor
                bind 109.104.212.130:80
    fullconn 20000
default_backend http-websrv
backend http-websrv
        balance source
                maxconn 3000

stick match src
    stick-table type ip size 200k expire 30m
        stick on src


        server ha1server-1 192.168.0.205:80 check send-proxy weight 254 backup
        server ha1server-2 192.168.1.15:80 check send-proxy weight 255
        server ha1server-3 192.168.2.30:80 check send-proxy weight 252 backup
        server ha1server-4 192.168.1.198:80 check send-proxy weight 253 backup
                server ha1server-5 192.168.0.1:80 maxconn 3000 check send-proxy weight 251 backup


frontend https-in
                mode tcp

                option tcplog
                log global

                option logasap
                option forwardfor
        maxconn 99999
           bind 109.104.212.130:443
        default_backend https-websrv
                backend https-websrv
        balance source
                maxconn 3000
        stick on src
    stick-table type ip size 200k expire 30m


                server ha1server-1 192.168.0.205:443 maxconn 8000 check send-proxy weight 254 backup
                server ha1server-2 192.168.1.15:443 maxconn 10000 check send-proxy weight 255
        server ha1server-3 192.168.2.30:443 maxconn 8000 check send-proxy weight 252 backup
        server ha1server-4 192.168.1.198:443 maxconn 10000 check send-proxy weight 253 backup
                server ha1server-5 192.168.0.1:443 maxconn 3000 check send-proxy weight 251 backup

listen stats
    mode http
    option httplog
    option http-server-close
    maxconn 10
    stats enable
    stats show-legends
    stats refresh 5s
    stats realm Haproxy\ Statistics
    stats admin if TRUE


After preparing your haproxy.cfg and reloading haproxy in /var/log/haproxy.log you should have the Real Source IPs logged in:
 

root@webserver:~# tail -n 10 /var/log/haproxy.log
Apr 15 22:47:34 pcfr_hware_local_ip haproxy[2914]: 159.223.65.16:58735 [15/Apr/2022:22:47:34.586] https-in https-websrv/ha1server-2 1/0/+0 +0 — 7/7/7/7/0 0/0
Apr 15 22:47:34 pcfr_hware_local_ip haproxy[2914]: 20.113.133.8:56405 [15/Apr/2022:22:47:34.744] https-in https-websrv/ha1server-2 1/0/+0 +0 — 7/7/7/7/0 0/0
Apr 15 22:47:35 pcfr_hware_local_ip haproxy[2914]: 54.36.148.248:15653 [15/Apr/2022:22:47:35.057] https-in https-websrv/ha1server-2 1/0/+0 +0 — 7/7/7/7/0 0/0
Apr 15 22:47:35 pcfr_hware_local_ip haproxy[2914]: 185.191.171.35:26564 [15/Apr/2022:22:47:35.071] https-in https-websrv/ha1server-2 1/0/+0 +0 — 8/8/8/8/0 0/0
Apr 15 22:47:35 pcfr_hware_local_ip haproxy[2914]: 213.183.53.58:42984 [15/Apr/2022:22:47:35.669] https-in https-websrv/ha1server-2 1/0/+0 +0 — 6/6/6/6/0 0/0
Apr 15 22:47:35 pcfr_hware_local_ip haproxy[2914]: 159.223.65.16:54006 [15/Apr/2022:22:47:35.703] https-in https-websrv/ha1server-2 1/0/+0 +0 — 7/7/7/7/0 0/0
Apr 15 22:47:36 pcfr_hware_local_ip haproxy[2914]: 192.241.113.203:30877 [15/Apr/2022:22:47:36.651] https-in https-websrv/ha1server-2 1/0/+0 +0 — 4/4/4/4/0 0/0
Apr 15 22:47:36 pcfr_hware_local_ip haproxy[2914]: 185.191.171.9:6776 [15/Apr/2022:22:47:36.683] https-in https-websrv/ha1server-2 1/0/+0 +0 — 5/5/5/5/0 0/0
Apr 15 22:47:36 pcfr_hware_local_ip haproxy[2914]: 159.223.65.16:64310 [15/Apr/2022:22:47:36.797] https-in https-websrv/ha1server-2 1/0/+0 +0 — 6/6/6/6/0 0/0
Apr 15 22:47:36 pcfr_hware_local_ip haproxy[2914]: 185.191.171.3:23364 [15/Apr/2022:22:47:36.834] https-in https-websrv/ha1server-2 1/1/+1 +0 — 7/7/7/7/0 0/0


2. Enable remoteip proxy protocol on Webservers

Login to each Apache HTTPD and to enable remoteip module run:
 

# a2enmod remoteip


On Debians, the command should produce a right symlink to mods-enabled/ directory
 

# ls -al /etc/apache2/mods-enabled/*remote*
lrwxrwxrwx 1 root root 31 Mar 30  2021 /etc/apache2/mods-enabled/remoteip.load -> ../mods-available/remoteip.load


3. Modify remoteip.conf file and allow IPs of haproxies or F5s


Configure RemoteIPTrustedProxy for every Source IP of haproxy to allow it to send X-Forwarded-For header to Apache,

Here are few examples, from my apache working config on Debian 11.2 (Bullseye):
 

webserver:~# cat remoteip.conf
RemoteIPHeader X-Forwarded-For
RemoteIPTrustedProxy 192.168.0.1
RemoteIPTrustedProxy 192.168.0.205
RemoteIPTrustedProxy 192.168.1.15
RemoteIPTrustedProxy 192.168.0.198
RemoteIPTrustedProxy 192.168.2.33
RemoteIPTrustedProxy 192.168.2.30
RemoteIPTrustedProxy 192.168.0.215
#RemoteIPTrustedProxy 51.89.232.41

On RedHat / Fedora other RPM based Linux distrubutions, you can do the same by including inside httpd.conf or virtualhost configuration something like:
 

<IfModule remoteip_module>
      RemoteIPHeader X-Forwarded-For
      RemoteIPInternalProxy 192.168.0.0/16
      RemoteIPTrustedProxy 192.168.0.215/32
</IfModule>


4. Enable RemoteIP Proxy Protocol in apache2.conf / httpd.conf or Virtualhost custom config
 

Modify both haproxy / haproxies config as well as enable the RemoteIP module on Apache webservers (VirtualHosts if such used) and either in <VirtualHost> block or in main http config include:

RemoteIPProxyProtocol On


5. Change default configured Apache LogFormat

In Domain Vhost or apache2.conf / httpd.conf

Default logging Format will be something like:
 

LogFormat "%h %l %u %t \"%r\" %>s %O \"%{Referer}i\" \"%{User-Agent}i\"" combined


or
 

LogFormat "%v:%p %h %l %u %t \"%r\" %>s %O \"%{Referer}i\" \"%{User-Agent}i\"" combined


Once you find it in /etc/apache2/apache2.conf / httpd.conf or Vhost, you have to comment out this by adding shebang infont of sentence make it look as follows:
 

LogFormat "%v:%p %a %l %u %t \"%r\" %>s %O \"%{Referer}i\" \"%{User-Agent}i\"" vhost_combined
LogFormat "%a %l %u %t \"%r\" %>s %O \"%{Referer}i\" \"%{User-Agent}i\"" combined
LogFormat "%a %l %u %t \"%r\" %>s %O" common
LogFormat "%{Referer}i -> %U" referer
LogFormat "%{User-agent}i" agent


The Changed LogFormat instructs Apache to log the client IP as recorded by mod_remoteip (%a) rather than hostname (%h). For a full explanation of all the options check the official HTTP Server documentation page apache_mod_config on Custom Log Formats.

and reload each Apache server.

on Debian:

# apache2ctl -k reload

On CentOS

# systemctl restart httpd


6. Check proxy protocol is properly enabled on Apaches


remoteip module will enable Apache to expect a proxy connect header passed to it otherwise it will respond with Bad Request, because it will detect a plain HTML request instead of Proxy Protocol CONNECT, here is the usual telnet test to fetch the index.htm page.

root@webserver:~# telnet localhost 80
Trying 127.0.0.1…
Connected to localhost.
Escape character is '^]'.
GET / HTTP/1.1

HTTP/1.1 400 Bad Request
Date: Fri, 15 Apr 2022 19:04:51 GMT
Server: Apache/2.4.51 (Debian)
Content-Length: 312
Connection: close
Content-Type: text/html; charset=iso-8859-1

<!DOCTYPE HTML PUBLIC "-//IETF//DTD HTML 2.0//EN">
<html><head>
<title>400 Bad Request</title>
</head><body>
<h1>Bad Request</h1>
<p>Your browser sent a request that this server could not understand.<br />
</p>
<hr>
<address>Apache/2.4.51 (Debian) Server at grafana.pc-freak.net Port 80</address>
</body></html>
Connection closed by foreign host.


root@webserver:~# telnet localhost 80
Trying 127.0.0.1…
Connected to localhost.
Escape character is '^]'.
HEAD / HTTP/1.1

HTTP/1.1 400 Bad Request
Date: Fri, 15 Apr 2022 19:05:07 GMT
Server: Apache/2.4.51 (Debian)
Connection: close
Content-Type: text/html; charset=iso-8859-1

Connection closed by foreign host.


To test it with telnet you can follow the Proxy CONNECT syntax and simulate you're connecting from a proxy server, like that:
 

root@webserver:~# telnet localhost 80
Trying 127.0.0.1…
Connected to localhost.
Escape character is '^]'.
CONNECT localhost:80 HTTP/1.0

HTTP/1.1 301 Moved Permanently
Date: Fri, 15 Apr 2022 19:13:38 GMT
Server: Apache/2.4.51 (Debian)
Location: https://zabbix.pc-freak.net
Cache-Control: max-age=900
Expires: Fri, 15 Apr 2022 19:28:38 GMT
Content-Length: 310
Connection: close
Content-Type: text/html; charset=iso-8859-1

<!DOCTYPE HTML PUBLIC "-//IETF//DTD HTML 2.0//EN">
<html><head>
<title>301 Moved Permanently</title>
</head><body>
<h1>Moved Permanently</h1>
<p>The document has moved <a href="https://zabbix.pc-freak.net">here</a>.</p>
<hr>
<address>Apache/2.4.51 (Debian) Server at localhost Port 80</address>
</body></html>
Connection closed by foreign host.

You can test with curl simulating the proxy protocol CONNECT with:

root@webserver:~# curl –insecure –haproxy-protocol https://192.168.2.30

<!DOCTYPE HTML PUBLIC "-//W3C//DTD HTML 4.01 Transitional//EN"
"http://w3.org/TR/html4/loose.dtd">
<html>
<head>
<meta name="generator" content="pc-freak.net tidy">
<script src="https://ssl.google-analytics.com/urchin.js" type="text/javascript">
</script>
<script type="text/javascript">
_uacct = "UA-2102595-3";
urchinTracker();
</script>
<script type="text/javascript">
var gaJsHost = (("https:" == document.location.protocol) ? "https://ssl." : "http://");
document.write(unescape("%3Cscript src='" + gaJsHost + "google-analytics.com/ga.js' type='text/javascript'%3E%3C/script%3E"));
</script>
<script type="text/javascript">
try {
var pageTracker = _gat._getTracker("UA-2102595-6");
pageTracker._trackPageview();
} catch(err) {}
</script>


      –haproxy-protocol
              (HTTP) Send a HAProxy PROXY protocol v1 header at the beginning of the connection. This is used by some load balancers and reverse proxies
              to indicate the client's true IP address and port.

              This option is primarily useful when sending test requests to a service that expects this header.

              Added in 7.60.0.


7. Check apache log if remote Real Internet Source IPs are properly logged
 

root@webserver:~# tail -n 10 /var/log/apache2/access.log

213.183.53.58 – – [15/Apr/2022:22:18:59 +0300] "GET /proxy/browse.php?u=https%3A%2F%2Fsteamcommunity.com%2Fmarket%2Fitemordershistogram%3Fcountry HTTP/1.1" 200 12701 "https://www.pc-freak.net" "Mozilla/5.0 (Windows NT 10.0; Win64; x64; rv:98.0) Gecko/20100101 Firefox/98.0"
88.198.48.184 – – [15/Apr/2022:22:18:58 +0300] "GET /blog/iq-world-rank-country-smartest-nations/?cid=1330192 HTTP/1.1" 200 29574 "-" "Mozilla/5.0 (compatible; DataForSeoBot/1.0; +https://dataforseo.com/dataforseo-bot)"
213.183.53.58 – – [15/Apr/2022:22:19:00 +0300] "GET /proxy/browse.php?u=https%3A%2F%2Fsteamcommunity.com%2Fmarket%2Fitemordershistogram%3Fcountry
HTTP/1.1" 200 9080 "https://www.pc-freak.net" "Mozilla/5.0 (Windows NT 10.0; Win64; x64; rv:98.0) Gecko/20100101 Firefox/98.0"
159.223.65.16 – – [15/Apr/2022:22:19:01 +0300] "POST //blog//xmlrpc.php HTTP/1.1" 200 5477 "-" "Mozilla/5.0 (Windows NT 10.0; Win64; x64) AppleWebKit/537.36 (KHTML, like Gecko) Chrome/89.0.4389.114 Safari/537.36"
159.223.65.16 – – [15/Apr/2022:22:19:02 +0300] "POST //blog//xmlrpc.php HTTP/1.1" 200 5477 "-" "Mozilla/5.0 (Windows NT 10.0; Win64; x64) AppleWebKit/537.36 (KHTML, like Gecko) Chrome/89.0.4389.114 Safari/537.36"
213.91.190.233 – – [15/Apr/2022:22:19:02 +0300] "POST /blog/wp-admin/admin-ajax.php HTTP/1.1" 200 1243 "https://www.pc-freak.net/blog/wp-admin/post.php?post=16754&action=edit" "Mozilla/5.0 (Windows NT 6.1; Win64; x64; rv:89.0) Gecko/20100101 Firefox/89.0"
46.10.215.119 – – [15/Apr/2022:22:19:02 +0300] "GET /images/saint-Paul-and-Peter-holy-icon.jpg HTTP/1.1" 200 134501 "https://www.google.com/" "Mozilla/5.0 (Windows NT 10.0; Win64; x64) AppleWebKit/537.36 (KHTML, like Gecko) Chrome/100.0.4896.75 Safari/537.36 Edg/100.0.1185.39"
185.191.171.42 – – [15/Apr/2022:22:19:03 +0300] "GET /index.html.latest/tutorials/tutorials/penguins/vestnik/penguins/faith/vestnik/ HTTP/1.1" 200 11684 "-" "Mozilla/5.0 (compatible; SemrushBot/7~bl; +http://www.semrush.com/bot.html)"

116.179.37.243 – – [15/Apr/2022:22:19:50 +0300] "GET /blog/wp-content/cookieconsent.min.js HTTP/1.1" 200 7625 "https://www.pc-freak.net/blog/how-to-disable-nginx-static-requests-access-log-logging/" "Mozilla/5.0 (compatible; Baiduspider-render/2.0; +http://www.baidu.com/search/spider.html)"
116.179.37.237 – – [15/Apr/2022:22:19:50 +0300] "GET /blog/wp-content/plugins/google-analytics-dashboard-for-wp/assets/js/frontend-gtag.min.js?ver=7.5.0 HTTP/1.1" 200 8898 "https://www.pc-freak.net/blog/how-to-disable-nginx-static-requests-access-log-logging/" "Mozilla/5.0 (compatible; Baiduspider-render/2.0; +http://www.baidu.com/search/spider.html)"


You see from above output remote Source IPs in green are properly logged, so haproxy Cluster is correctly forwarding connections passing on in the Haproxy generated Initial header the Real IP of its remote connect IPs.


Sum it up, What was done?


HTTP_X_FORWARD_FOR is impossible to set, when haproxy is used on mode tcp and all traffic is sent as received from TCP IPv4 / IPv6 Network stack, e.g. modifying any HTTP sent traffic inside the headers is not possible as this might break up the data.

Thus Haproxy was configured to send all its received data by sending initial proxy header with the X_FORWARDED usual Source IP data, then remoteip Apache module was used to make Apache receive and understand haproxy sent Header which contains the original Source IP via the send-proxy functionality and example was given on how to test the remoteip on Webserver is working correctly.

Finally you've seen how to check configured haproxy and webserver are able to send and receive the End Client data with the originator real source IP correctly and those Internet IP is properly logged inside both haproxy and apaches.

How to completely disable Replication in MySQL server 5.1.61 on Debian GNU / Linux

Monday, July 16th, 2012

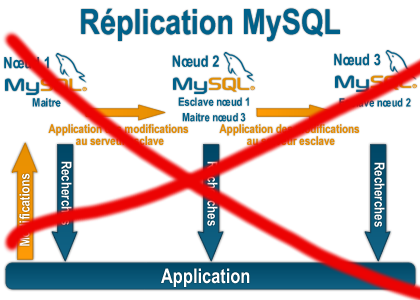
Replication_mysql_disable

Some time ago on one of the Database MySQL servers, I've configured replication as it was required to test somethings. Eventually it turned out replication will be not used (for some reason) it was too slow and not fitting our company needs hence we needed to disable it.

It seemed logical to me that, simply removing any replication related directives from my.cnf and a restart of the SQL server will be enough to turn replication off on the Debian Linux host. Therefore I proceeded removed all replication configs from /etc/my/my.cnf and issued MySQL restart i. e.:

sql-server:~# /etc/init.d/mysql restart
....

This however didn't turned off replication,as I thought and in phpmyadminweb frontend interface, replication was still appearing to be active in the replication tab.

Something was still making the SQL server still act as an Replication Slave Host, so after a bit of pondering and trying to remember, the exact steps I took to make the replication work on the host I remembered that actually I issued:

mysql> START SLAVE;

Onwards I run:

mysql> SHOW SLAVE STATUS;
....

and found in the database the server was still running in Slave Replication mode

Hence to turn off the db host run as a Slave, I had to issue in mysql cli:

mysql> STOP SLAVE;
Query OK, 0 rows affected, 1 warning (0.01 sec)
mysql> RESET SLAVE;
Query OK, 0 rows affected, 1 warning (0.01 sec)

Then after a reload of SQL server in memory, the host finally stopped working as a Slave Replication host, e.g.

sql-server:~# /etc/init.d/mysql restart
....

After the restart, to re-assure myself the SQL server is no more set to run as MySQL replication Slave host:

mysql> SHOW SLAVE STATUS;
Empty set (0.00 sec)

Cheers 😉

Install ShellInABox (web shell browser AJAX frontend) on Debian GNU / Linux

Sunday, September 23rd, 2012

ShellinAbox web ssh shell browser frontend for Debian, Ubuntu, Arch Linux, Redhat and other GNU / Linux distributions

ShellInABox is a tiny piece of soft which can enable you to access your server or desktop via ssh shell using the web command line shell through AJAX interface. Installing it is not a hard task. To install on any Linux just navigate to shellinabox.com and download compile and install using the source code from tar.gz.
Installing ShellinaBox on Debian or Ubuntu and derivative based Linux it is even easier as on the website there are pre-compiled deb binaries which can be straight installed with dpkg

For 32 bit Debian version, installation is as simple as;

1. Download the i386 deb binary from Shellinabox.com
Just go to the website and look up for correct link and download with links

As of time of writting this post to download with links text browser:


links "http://code.google.com/p/shellinabox/downloads/detail?name=shellinabox_2.9-1_i386.deb&can=2&q="

2. Install deb pack with dpkg


dpkg -i shellinabox_2.9-1_i386.deb

For 64 bit amd64 bit arch Debian, install a Pre-built Debian x86-64 package (requires Ubuntu Karmic). Though the binary is said to be for Ubuntu it also installs and starts the shellinabox service (daemon) without no problem. By default shellinabox is configured to work on port number 4200. Right after install to test it open your favourite browser and do request to localhost port 4200:


http://127.0.0.1:4200/

BTW, I’ve used a couple of others Java based web ssh frontends and I should say, ShellinAbox is much more responsive.
Well that’s all now enjoy connecting to remote system ssh using any AJAX supporting browser 🙂

Two wordpress plugins to accelerate wordpress opening times and decrease server load time

Thursday, September 22nd, 2011

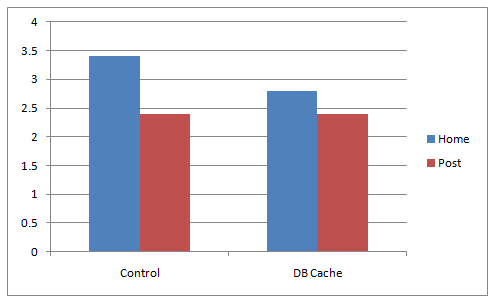
A Comparison of wordpress webpage responce with and without wp dbcache

A combination of two wordpress caching plugins (Hyper Cache and Db Cachesignificantly improves the access times of a wordpress based blogs and websites.

Installing the two websites has drastically improved my blog opening times, so in my view having the two plugins on every wordpress install out there is a must! 🙂
The plugins installation is straight forward, here is how I installed them.

1. Installing Hyper Cache on WordPress

To install Hyper Cache all I had to do is download and enable the plugin, the plugin doesn’t require any configuration. I always love it when I don’t have to bother with reading configuration options and pondering for some 20 minutes on the plugin features, so in that perspective Hyper Cache in my view is a good alternative to WordPress Super Cache

Besides that WordPress Super Cache was having issues when enabled on few wordpress based websites I manage these days. For comparison Hyper Cache worked just great on all wordpress install I tried the plugin so far.

To install all I had to do is download the plugin unzip and enable it:

a. Download and unzip it

debian:/var/www/blog# wget http://downloads.wordpress.org/plugin/hyper-cache.zip
...
debian:/var/www/blog# cd wp-content/plugins
debian:/var/www/blog/wp-content/plugins# unzip hyper-cache.zip

b. Enable Hyper Cache plugin

To enable the plugin follow to standard plugin location;

Plugins -> Inactive -> Hyper Cache (Enable)

To enable the plugin follow to standard plugin location;

Plugins -> Inactive -> Hyper Cache (Enable)


A  mirror of current version of hyper-cache.zip plugin is here 

2. Installing Wodpress Db Cache

What Db Cache, does it does caching of last queries made to MySQL for specified time, so if the query has to be refetched again from wordpress’s php frontend the queries results are fetched straight for the memory. This decreases the load towards the MySQL server and increases the webpages loading time.

As the plugin page suggests it’s way faster than other html caching-plugins like WP-Cache  or WP Super Cache

However, I think its still slower than using a combination of WP Super Cache’s alternative Hyper Cache  and  Db Cache . Combining this two could rise the webpage opening times according to some statisticonline at best cases up to 830% !! 😉 Let me proceed with how I did the install of  Db Cache .

a. Download and Install Db Cache


debian:/var/www/blog/wp-content/plugins# wget http://downloads.wordpress.org/plugin/db-cache.0.6.zip

...

debian:/var/www/blog/wp-content/plugins# unzip db-cache.0.6.zip


b. Enable the plugin 


Plugins -> Inactive -> Db Cache (Enable)


c. Make sure the permissions for Db Cache are correct

On Debian to enable Db Cache, the permissions should be changed for Apache to have a read/write permissions to plugin directory, on Debian to fix the permissions I used the commands:

debian:/var/www/blog# chown www-data:www-data wp-content

debian:/var/www/blog# chown -R www-data:www-data wp-content/plugins/db-cache

On other GNU/Linux distributions the above commands (user and group) www-data:www-data, should be set to whatever user/group Apache is running with, on Slackware this would be nobody:nobody, on CentOS and RHEL it would be apache:apache.

Finally to enable Db Cache go to

Settings -> Db Cache -> (Tick Enable) -> Save

I’ve also made a mirror of Db Cache plugin here

Enjoy the speed boost 😉

Install jwchat web chat jabber interface to work with Debian ejabberd jabber server

Wednesday, January 4th, 2012

JWChat ejabber jabber Ajax / HTML based client logo
 

I have recently blogged how I've installed & configured ejabberd (jabber server) on Debian .
Today I decided to further extend, my previous jabberd installation by installing JWChat a web chat interface frontend to ejabberd (a good substitute for a desktop app like pidgin which allows you to access a jabber server from anywhere)

Anyways for a base of installing JWChat , I used the previously installed debian deb version of ejabberd from the repositories.

I had a lot of troubles until I actually make it work because of some very minor mistakes in following the official described tutorial ejabberd website jwchat install tutorual

The only way I can make jwchat work was by using the install jwchat with ejabberd's HTTP-Bind and file server method

Actually for quite a long time I was not realizing that, there are two ways to install JWChat , so by mistake I was trying to mix up some install instructions from both jwchat HTTP-Bind file server method and JWchat Apache install method

I've seen many people complaining on the page of Install JWChat using Apache method which seemed to be experiencing a lot of strangle troubles just like the mines when I mixed up the jwchat php scripts install using instructions from both install methods. Therefore my guess is people who had troubles in installing using the Apache method and got the blank page issues while accessing http://jabber.servername.com:5280/http-poll/ as well as various XML Parsing Error: no element found errors on – http://ejabberd.oac.com:5280/http-poll/ is most probably caused by the same install instructions trap I was diluted in.

The steps to make JWChat install using the HTTP-Bind and file server method, if followed should be followed absolutely precisely or otherwise THEY WILL NOT WORK!!!

This are the exact steps I followed to make ejabberd work using the HTTP-Bind file server method :

1. Create directory to store the jwchat Ajax / htmls

debian:~# mkdir /var/lib/ejabberd/www
debian:~# chmod +x /var/lib/ejabberd
debian:~# chmod +x /var/lib/ejabberd/www

2. Modify /etc/ejabberd/ejabberd.cfg and include the following configs

While editting the conf find the section:

{listen,
[


Scrolling down you will fine some commented code marked with %% that will read:

{5269, ejabberd_s2s_in, [
{shaper, s2s_shaper},
{max_stanza_size, 131072}
]},

Right after it leave one new line and place the code:

{5280, ejabberd_http, [
{request_handlers, [
{["web"], mod_http_fileserver}
]},

http_bind,
http_poll,
web_admin
]}
]}.

Scrolling a bit down the file, there is a section which says:

%%% =======
%%% MODULES

%%
%% Modules enabled in all ejabberd virtual hosts.
%%

The section below the comments will look like so:

{modules, [ {mod_adhoc, []},
{mod_announce, [{access, announce}]}, % requires mod_adhoc
{mod_caps, []},
{mod_configure,[]}, % requires mod_adhoc
{mod_ctlextra, []},
{mod_disco, []},
%%{mod_echo, [{host, "echo.localhost"}]},
{mod_irc, []},
{mod_last, []},

After the {mod_last, … the following lines should be added:

{mod_http_bind, []},
{mod_http_fileserver, [
{docroot, "/var/lib/ejabberd/www"},
{accesslog, "/var/log/ejabberd/webaccess.log"}
]},

3. Download and extract latest version of jwchat

Of the time of writting the latest version of jwchat is jwchat-1.0 I have mirrored it on pc-freak for convenience:

debian:~# wget https://www.pc-freak.net/files/jwchat-1.0.tar.gz
….

debian:~# cd /var/lib/ejabberd/www
debian:/var/lib/ejabberd/www# tar -xzvf jwchat-1.0.tar.gz
...
debian:/var/lib/ejabberd/www# mv jwchat-1.0 jwchat
debian:/var/lib/ejabberd/www# cd jwchat

4. Choose the language in which you will prefer jwchat web interface to appear

I prefer english as most people would I suppose:

debian:/var/lib/ejabberd/www/jwchat# for a in $(ls *.en); do b=${a%.en}; cp $a $b; done

For other languages change in the small one liner shell script b=${a%.en} (en) to whatever language you will prefer to make primary.After selecting the correct langauge a rm cmd should be issued to get rid of the .js.* and .html.* in other language files which are no longer needed:

debian:/var/lib/ejabberd/www/jwchat# rm *.html.* *.js.*

5. Configure JWChat config.js

Edit /var/lib/ejabberd/www/jwchat/config.js , its necessery to have inside code definitions like:

/* If your Jabber server is jabber.example.org, set this: */
var SITENAME = "jabber.example.org";

/* If HTTP-Bind works correctly, you may want do remove HTTP-Poll here */
var BACKENDS =
[
{
name:"Native Binding",
description:"Ejabberd's native HTTP Binding backend",
httpbase:"/http-bind/",
type:"binding",
servers_allowed:[SITENAME]
}
];

6. Restart EJabberd server to load the new config settings

debian:~# /etc/init.d/ejabberd restart
Restarting jabber server: ejabberd..

7. Test JWChat HTTP-Bind and file server backend

I used elinksand my beloved Epiphany (default gnome browser) which by the way is the browser I use daily to test that the JWChat works fine with the ejabberd.
To test the newly installed HTTP-Bind ejabberd server backend on port 5280 I used URL:

http://jabber.mydomain.com:5280/web/jwchat/I had quite a struggles with 404 not found errors, which I couldn't explain for half an hour. After a thorough examination, I've figured out the reasons for the 404 errors was my stupidity …
The URL http://jabber.mydomain.com:5280/web/jwchat/ was incorrect because I fogrot to move jwchat-1.0 to jwchat e.g. (mv jwchat-1.0 jwchat) earlier explained in that article was a step I missed. Hence to access the web interface of the ejabberd without the 404 error I had to access it via:

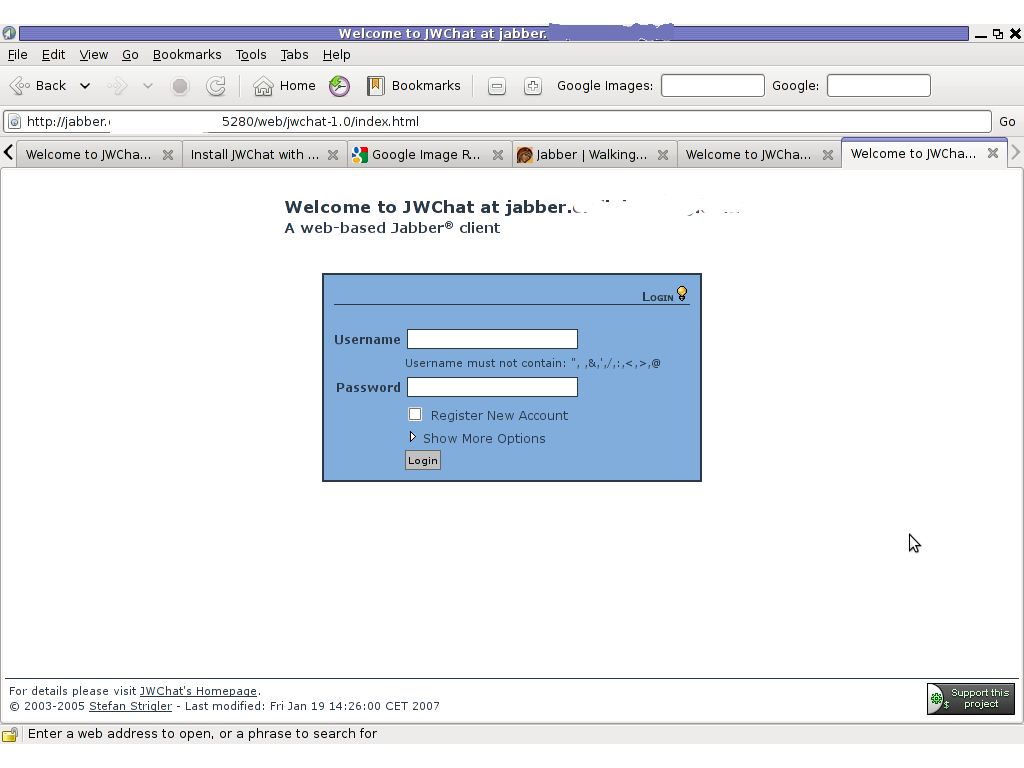
http://jabber.mydomain.com:5280/web/jwchat-1.0

JWChat Ejabber webchat Epiphany Linux screenshot

Finally it is handy to add a small index.php redirect to redirect to http://jabber.mydomain.com:5280/web/jwchat-1.0/

The php should like so:


<?
php
header( 'Location: http://jabber.mydomain.com:5280/web/jwchat-1.0' ) ;
?>

Installing HTOP on CentOS 5.5 OpenVZ Linux server from source

Friday, July 22nd, 2011

Htop Cool picture logo / htop on CentOS OpenVZ

Lately, I’m basicly using htop‘s nice colourful advanced Linux top command frontend in almost every server I manage, therefore I’ve almost abondoned top usage these days and in that reason I wanted to have htop installed on few of the OpenVZ CentOS 5.5 Linux servers at work.

I looked online but unfortunately I couldn’t find any rpm pre-built binary packages. The source rpm package I tried to build from dag wieers repository failed as well, so finally I went further and decided to install htop from source

Here is how I did it:

1. Install gcc and glibc-devel prerequired rpm packages

[root@centos ~]# yum install gcc glibc-devel

2. Download htop and compile from source

[root@centos src]# cd /usr/local/src
[root@centos src]# wget "http://sourceforge.net/projects/htop/files/htop/0.9/htop-0.9.tar.gz/download"
Connecting to heanet.dl.sourceforge.net|193.1.193.66|:80... connected.
HTTP request sent, awaiting response... 200 OK
Length: 418767 (409K) [application/x-gzip]
Saving to: "download"

100%[======================================>] 418,767 417K/s in 1.0s
2011-07-22 13:30:28 (417 KB/s) – “download” saved [418767/418767]

[root@centos src]# mv download htop.tar.gz
[root@centos src]# tar -zxf htop.tar.gz
[root@centos src]# cd htop-0.9
[root@centos htop-0.9]# ./configure && make && make install

make install should install htop to /usr/local/bin/htop

That’s all folks! , now my OpenVZ CentOS server is equipped with the nifty htop tool 😉

How to install Skype on 64 bit Ubuntu (amd64) architecture

Sunday, July 17th, 2011

It seems Skype has troubles installing on 64 bit Ubuntu via Ubuntu’s Graphical Package Install manager which in Ubuntu 11.04 is called (Ubuntu Software Center)

During my attempt to take advantage of the nice GUI apt frontend, I encontered the error:
Wrong Architecture amd64

And Skype install failed, as you see in below’s picture (which you might be unable to read since it’s stating the error in Bulgarian 😉

error Ubuntu 11.04 Skype Install error in architecture amd64

The error is quite understandable, since the Skype deb package which tried to install was built for the i386 architecture.
Since the Software Center was not intelligent enough to work around the issue, I finally fixed it myself using the good old apt-get in terminal, like so:

root@ubuntu:~# apt-get install skype
...

apt did not even complain that the package had a different architecture for i386 and installed skype without any errors as well Skype worked immediately even though the arthictural difference.
This is probably because even though it’s a amd64 Ubuntu it has a kernel module loaded to support i386 binaries 😉
Now my sister can enjoy her skype on the shiny Ubuntu 😉