Posts Tagged ‘wait’

Webserver farm behind Load Balancer Proxy or how to preserve incoming internet IP to local net IP Apache webservers by adding additional haproxy header with remoteip

Monday, April 18th, 2022

logo-haproxy-apache-remoteip-configure-and-check-to-have-logged-real-ip-address-inside-apache-forwarded-from-load-balancer

Having a Proxy server for Load Balancing is a common solutions to assure High Availability of Web Application service behind a proxy.
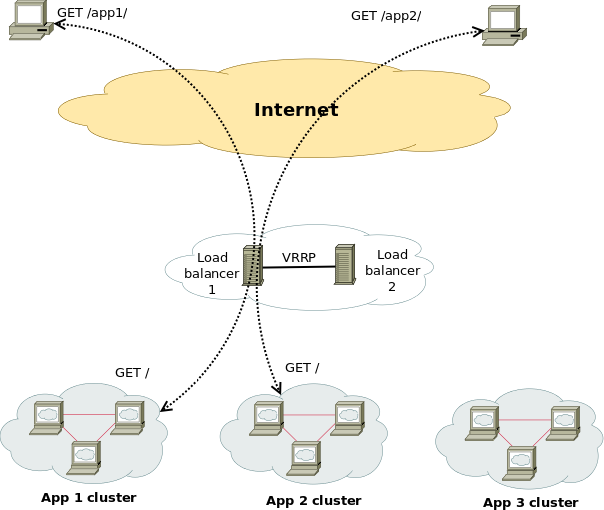
You can have for example 1 Apache HTTPD webservers serving traffic Actively on one Location (i.e. one city or Country) and 3 configured in the F5 LB or haproxy to silently keep up and wait for incoming connections as an (Active Failure) Backup solution

Lets say the Webservers usually are set to have local class C IPs as 192.168.0.XXX or 10.10.10.XXX and living in isolated DMZed well firewalled LAN network and Haproxy is configured to receive traffic via a Internet IP 109.104.212.13 address and send the traffic in mode tcp via a NATTed connection (e.g. due to the network address translation the source IP of the incoming connections from Intenet clients appears as the NATTed IP 192.168.1.50.

The result is that all incoming connections from haproxy -> webservers will be logged in Webservers /var/log/apache2/access.log wrongly as incoming from source IP: 192.168.1.50, meaning all the information on the source Internet Real IP gets lost.
load-balancer-high-availailibility-haproxy-apache
 

How to pass Real (Internet) Source IPs from Haproxy "mode tcp" to Local LAN Webservers  ?
 

Usually the normal way to work around this with Apache Reverse Proxies configured is to use HTTP_X_FORWARDED_FOR variable in haproxy when using HTTP traffic application that is proxied (.e.g haproxy.cfg has mode http configured), you have to add to listen listener_name directive or frontend Frontend_of_proxy

option forwardfor
option http-server-close

However unfortunately, IP Header preservation with X_FORWADED_FOR  HTTP-Header is not possible when haproxy is configured to forward traffic using mode tcp.

Thus when you're forced to use mode tcp to completely pass any traffic incoming to Haproxy from itself to End side, the solution is to
 

  • Use mod_remoteip infamous module that is part of standard Apache installs both on apache2 installed from (.deb) package  or httpd rpm (on redhats / centos).


1. Configure Haproxies to send received connects as send-proxy traffic


The idea is very simple all the received requests from outside clients to Haproxy are to be send via the haproxy to the webserver in a PROXY protocol string, this is done via send-proxy

             send-proxy  – send a PROXY protocol string

Rawly my current /etc/haproxy/haproxy.cfg looks like this:
 

global
        log /dev/log    local0
        log /dev/log    local1 notice
        chroot /var/lib/haproxy
        user haproxy
        group haproxy
        daemon
        maxconn 99999
        nbproc          1
        nbthread 2
        cpu-map         1 0
        cpu-map         2 1


defaults
        log     global
       mode    tcp


        timeout connect 5000
        timeout connect 30s
        timeout server 10s

    timeout queue 5s
    timeout tunnel 2m
    timeout client-fin 1s
    timeout server-fin 1s

                option forwardfor

    retries                 15


frontend http-in
                mode tcp

                option tcplog
        log global

                option logasap
                option forwardfor
                bind 109.104.212.130:80
    fullconn 20000
default_backend http-websrv
backend http-websrv
        balance source
                maxconn 3000

stick match src
    stick-table type ip size 200k expire 30m
        stick on src


        server ha1server-1 192.168.0.205:80 check send-proxy weight 254 backup
        server ha1server-2 192.168.1.15:80 check send-proxy weight 255
        server ha1server-3 192.168.2.30:80 check send-proxy weight 252 backup
        server ha1server-4 192.168.1.198:80 check send-proxy weight 253 backup
                server ha1server-5 192.168.0.1:80 maxconn 3000 check send-proxy weight 251 backup


frontend https-in
                mode tcp

                option tcplog
                log global

                option logasap
                option forwardfor
        maxconn 99999
           bind 109.104.212.130:443
        default_backend https-websrv
                backend https-websrv
        balance source
                maxconn 3000
        stick on src
    stick-table type ip size 200k expire 30m


                server ha1server-1 192.168.0.205:443 maxconn 8000 check send-proxy weight 254 backup
                server ha1server-2 192.168.1.15:443 maxconn 10000 check send-proxy weight 255
        server ha1server-3 192.168.2.30:443 maxconn 8000 check send-proxy weight 252 backup
        server ha1server-4 192.168.1.198:443 maxconn 10000 check send-proxy weight 253 backup
                server ha1server-5 192.168.0.1:443 maxconn 3000 check send-proxy weight 251 backup

listen stats
    mode http
    option httplog
    option http-server-close
    maxconn 10
    stats enable
    stats show-legends
    stats refresh 5s
    stats realm Haproxy\ Statistics
    stats admin if TRUE


After preparing your haproxy.cfg and reloading haproxy in /var/log/haproxy.log you should have the Real Source IPs logged in:
 

root@webserver:~# tail -n 10 /var/log/haproxy.log
Apr 15 22:47:34 pcfr_hware_local_ip haproxy[2914]: 159.223.65.16:58735 [15/Apr/2022:22:47:34.586] https-in https-websrv/ha1server-2 1/0/+0 +0 — 7/7/7/7/0 0/0
Apr 15 22:47:34 pcfr_hware_local_ip haproxy[2914]: 20.113.133.8:56405 [15/Apr/2022:22:47:34.744] https-in https-websrv/ha1server-2 1/0/+0 +0 — 7/7/7/7/0 0/0
Apr 15 22:47:35 pcfr_hware_local_ip haproxy[2914]: 54.36.148.248:15653 [15/Apr/2022:22:47:35.057] https-in https-websrv/ha1server-2 1/0/+0 +0 — 7/7/7/7/0 0/0
Apr 15 22:47:35 pcfr_hware_local_ip haproxy[2914]: 185.191.171.35:26564 [15/Apr/2022:22:47:35.071] https-in https-websrv/ha1server-2 1/0/+0 +0 — 8/8/8/8/0 0/0
Apr 15 22:47:35 pcfr_hware_local_ip haproxy[2914]: 213.183.53.58:42984 [15/Apr/2022:22:47:35.669] https-in https-websrv/ha1server-2 1/0/+0 +0 — 6/6/6/6/0 0/0
Apr 15 22:47:35 pcfr_hware_local_ip haproxy[2914]: 159.223.65.16:54006 [15/Apr/2022:22:47:35.703] https-in https-websrv/ha1server-2 1/0/+0 +0 — 7/7/7/7/0 0/0
Apr 15 22:47:36 pcfr_hware_local_ip haproxy[2914]: 192.241.113.203:30877 [15/Apr/2022:22:47:36.651] https-in https-websrv/ha1server-2 1/0/+0 +0 — 4/4/4/4/0 0/0
Apr 15 22:47:36 pcfr_hware_local_ip haproxy[2914]: 185.191.171.9:6776 [15/Apr/2022:22:47:36.683] https-in https-websrv/ha1server-2 1/0/+0 +0 — 5/5/5/5/0 0/0
Apr 15 22:47:36 pcfr_hware_local_ip haproxy[2914]: 159.223.65.16:64310 [15/Apr/2022:22:47:36.797] https-in https-websrv/ha1server-2 1/0/+0 +0 — 6/6/6/6/0 0/0
Apr 15 22:47:36 pcfr_hware_local_ip haproxy[2914]: 185.191.171.3:23364 [15/Apr/2022:22:47:36.834] https-in https-websrv/ha1server-2 1/1/+1 +0 — 7/7/7/7/0 0/0


2. Enable remoteip proxy protocol on Webservers

Login to each Apache HTTPD and to enable remoteip module run:
 

# a2enmod remoteip


On Debians, the command should produce a right symlink to mods-enabled/ directory
 

# ls -al /etc/apache2/mods-enabled/*remote*
lrwxrwxrwx 1 root root 31 Mar 30  2021 /etc/apache2/mods-enabled/remoteip.load -> ../mods-available/remoteip.load


3. Modify remoteip.conf file and allow IPs of haproxies or F5s


Configure RemoteIPTrustedProxy for every Source IP of haproxy to allow it to send X-Forwarded-For header to Apache,

Here are few examples, from my apache working config on Debian 11.2 (Bullseye):
 

webserver:~# cat remoteip.conf
RemoteIPHeader X-Forwarded-For
RemoteIPTrustedProxy 192.168.0.1
RemoteIPTrustedProxy 192.168.0.205
RemoteIPTrustedProxy 192.168.1.15
RemoteIPTrustedProxy 192.168.0.198
RemoteIPTrustedProxy 192.168.2.33
RemoteIPTrustedProxy 192.168.2.30
RemoteIPTrustedProxy 192.168.0.215
#RemoteIPTrustedProxy 51.89.232.41

On RedHat / Fedora other RPM based Linux distrubutions, you can do the same by including inside httpd.conf or virtualhost configuration something like:
 

<IfModule remoteip_module>
      RemoteIPHeader X-Forwarded-For
      RemoteIPInternalProxy 192.168.0.0/16
      RemoteIPTrustedProxy 192.168.0.215/32
</IfModule>


4. Enable RemoteIP Proxy Protocol in apache2.conf / httpd.conf or Virtualhost custom config
 

Modify both haproxy / haproxies config as well as enable the RemoteIP module on Apache webservers (VirtualHosts if such used) and either in <VirtualHost> block or in main http config include:

RemoteIPProxyProtocol On


5. Change default configured Apache LogFormat

In Domain Vhost or apache2.conf / httpd.conf

Default logging Format will be something like:
 

LogFormat "%h %l %u %t \"%r\" %>s %O \"%{Referer}i\" \"%{User-Agent}i\"" combined


or
 

LogFormat "%v:%p %h %l %u %t \"%r\" %>s %O \"%{Referer}i\" \"%{User-Agent}i\"" combined


Once you find it in /etc/apache2/apache2.conf / httpd.conf or Vhost, you have to comment out this by adding shebang infont of sentence make it look as follows:
 

LogFormat "%v:%p %a %l %u %t \"%r\" %>s %O \"%{Referer}i\" \"%{User-Agent}i\"" vhost_combined
LogFormat "%a %l %u %t \"%r\" %>s %O \"%{Referer}i\" \"%{User-Agent}i\"" combined
LogFormat "%a %l %u %t \"%r\" %>s %O" common
LogFormat "%{Referer}i -> %U" referer
LogFormat "%{User-agent}i" agent


The Changed LogFormat instructs Apache to log the client IP as recorded by mod_remoteip (%a) rather than hostname (%h). For a full explanation of all the options check the official HTTP Server documentation page apache_mod_config on Custom Log Formats.

and reload each Apache server.

on Debian:

# apache2ctl -k reload

On CentOS

# systemctl restart httpd


6. Check proxy protocol is properly enabled on Apaches


remoteip module will enable Apache to expect a proxy connect header passed to it otherwise it will respond with Bad Request, because it will detect a plain HTML request instead of Proxy Protocol CONNECT, here is the usual telnet test to fetch the index.htm page.

root@webserver:~# telnet localhost 80
Trying 127.0.0.1…
Connected to localhost.
Escape character is '^]'.
GET / HTTP/1.1

HTTP/1.1 400 Bad Request
Date: Fri, 15 Apr 2022 19:04:51 GMT
Server: Apache/2.4.51 (Debian)
Content-Length: 312
Connection: close
Content-Type: text/html; charset=iso-8859-1

<!DOCTYPE HTML PUBLIC "-//IETF//DTD HTML 2.0//EN">
<html><head>
<title>400 Bad Request</title>
</head><body>
<h1>Bad Request</h1>
<p>Your browser sent a request that this server could not understand.<br />
</p>
<hr>
<address>Apache/2.4.51 (Debian) Server at grafana.pc-freak.net Port 80</address>
</body></html>
Connection closed by foreign host.


root@webserver:~# telnet localhost 80
Trying 127.0.0.1…
Connected to localhost.
Escape character is '^]'.
HEAD / HTTP/1.1

HTTP/1.1 400 Bad Request
Date: Fri, 15 Apr 2022 19:05:07 GMT
Server: Apache/2.4.51 (Debian)
Connection: close
Content-Type: text/html; charset=iso-8859-1

Connection closed by foreign host.


To test it with telnet you can follow the Proxy CONNECT syntax and simulate you're connecting from a proxy server, like that:
 

root@webserver:~# telnet localhost 80
Trying 127.0.0.1…
Connected to localhost.
Escape character is '^]'.
CONNECT localhost:80 HTTP/1.0

HTTP/1.1 301 Moved Permanently
Date: Fri, 15 Apr 2022 19:13:38 GMT
Server: Apache/2.4.51 (Debian)
Location: https://zabbix.pc-freak.net
Cache-Control: max-age=900
Expires: Fri, 15 Apr 2022 19:28:38 GMT
Content-Length: 310
Connection: close
Content-Type: text/html; charset=iso-8859-1

<!DOCTYPE HTML PUBLIC "-//IETF//DTD HTML 2.0//EN">
<html><head>
<title>301 Moved Permanently</title>
</head><body>
<h1>Moved Permanently</h1>
<p>The document has moved <a href="https://zabbix.pc-freak.net">here</a>.</p>
<hr>
<address>Apache/2.4.51 (Debian) Server at localhost Port 80</address>
</body></html>
Connection closed by foreign host.

You can test with curl simulating the proxy protocol CONNECT with:

root@webserver:~# curl –insecure –haproxy-protocol https://192.168.2.30

<!DOCTYPE HTML PUBLIC "-//W3C//DTD HTML 4.01 Transitional//EN"
"http://w3.org/TR/html4/loose.dtd">
<html>
<head>
<meta name="generator" content="pc-freak.net tidy">
<script src="https://ssl.google-analytics.com/urchin.js" type="text/javascript">
</script>
<script type="text/javascript">
_uacct = "UA-2102595-3";
urchinTracker();
</script>
<script type="text/javascript">
var gaJsHost = (("https:" == document.location.protocol) ? "https://ssl." : "http://");
document.write(unescape("%3Cscript src='" + gaJsHost + "google-analytics.com/ga.js' type='text/javascript'%3E%3C/script%3E"));
</script>
<script type="text/javascript">
try {
var pageTracker = _gat._getTracker("UA-2102595-6");
pageTracker._trackPageview();
} catch(err) {}
</script>


      –haproxy-protocol
              (HTTP) Send a HAProxy PROXY protocol v1 header at the beginning of the connection. This is used by some load balancers and reverse proxies
              to indicate the client's true IP address and port.

              This option is primarily useful when sending test requests to a service that expects this header.

              Added in 7.60.0.


7. Check apache log if remote Real Internet Source IPs are properly logged
 

root@webserver:~# tail -n 10 /var/log/apache2/access.log

213.183.53.58 – – [15/Apr/2022:22:18:59 +0300] "GET /proxy/browse.php?u=https%3A%2F%2Fsteamcommunity.com%2Fmarket%2Fitemordershistogram%3Fcountry HTTP/1.1" 200 12701 "https://www.pc-freak.net" "Mozilla/5.0 (Windows NT 10.0; Win64; x64; rv:98.0) Gecko/20100101 Firefox/98.0"
88.198.48.184 – – [15/Apr/2022:22:18:58 +0300] "GET /blog/iq-world-rank-country-smartest-nations/?cid=1330192 HTTP/1.1" 200 29574 "-" "Mozilla/5.0 (compatible; DataForSeoBot/1.0; +https://dataforseo.com/dataforseo-bot)"
213.183.53.58 – – [15/Apr/2022:22:19:00 +0300] "GET /proxy/browse.php?u=https%3A%2F%2Fsteamcommunity.com%2Fmarket%2Fitemordershistogram%3Fcountry
HTTP/1.1" 200 9080 "https://www.pc-freak.net" "Mozilla/5.0 (Windows NT 10.0; Win64; x64; rv:98.0) Gecko/20100101 Firefox/98.0"
159.223.65.16 – – [15/Apr/2022:22:19:01 +0300] "POST //blog//xmlrpc.php HTTP/1.1" 200 5477 "-" "Mozilla/5.0 (Windows NT 10.0; Win64; x64) AppleWebKit/537.36 (KHTML, like Gecko) Chrome/89.0.4389.114 Safari/537.36"
159.223.65.16 – – [15/Apr/2022:22:19:02 +0300] "POST //blog//xmlrpc.php HTTP/1.1" 200 5477 "-" "Mozilla/5.0 (Windows NT 10.0; Win64; x64) AppleWebKit/537.36 (KHTML, like Gecko) Chrome/89.0.4389.114 Safari/537.36"
213.91.190.233 – – [15/Apr/2022:22:19:02 +0300] "POST /blog/wp-admin/admin-ajax.php HTTP/1.1" 200 1243 "https://www.pc-freak.net/blog/wp-admin/post.php?post=16754&action=edit" "Mozilla/5.0 (Windows NT 6.1; Win64; x64; rv:89.0) Gecko/20100101 Firefox/89.0"
46.10.215.119 – – [15/Apr/2022:22:19:02 +0300] "GET /images/saint-Paul-and-Peter-holy-icon.jpg HTTP/1.1" 200 134501 "https://www.google.com/" "Mozilla/5.0 (Windows NT 10.0; Win64; x64) AppleWebKit/537.36 (KHTML, like Gecko) Chrome/100.0.4896.75 Safari/537.36 Edg/100.0.1185.39"
185.191.171.42 – – [15/Apr/2022:22:19:03 +0300] "GET /index.html.latest/tutorials/tutorials/penguins/vestnik/penguins/faith/vestnik/ HTTP/1.1" 200 11684 "-" "Mozilla/5.0 (compatible; SemrushBot/7~bl; +http://www.semrush.com/bot.html)"

116.179.37.243 – – [15/Apr/2022:22:19:50 +0300] "GET /blog/wp-content/cookieconsent.min.js HTTP/1.1" 200 7625 "https://www.pc-freak.net/blog/how-to-disable-nginx-static-requests-access-log-logging/" "Mozilla/5.0 (compatible; Baiduspider-render/2.0; +http://www.baidu.com/search/spider.html)"
116.179.37.237 – – [15/Apr/2022:22:19:50 +0300] "GET /blog/wp-content/plugins/google-analytics-dashboard-for-wp/assets/js/frontend-gtag.min.js?ver=7.5.0 HTTP/1.1" 200 8898 "https://www.pc-freak.net/blog/how-to-disable-nginx-static-requests-access-log-logging/" "Mozilla/5.0 (compatible; Baiduspider-render/2.0; +http://www.baidu.com/search/spider.html)"


You see from above output remote Source IPs in green are properly logged, so haproxy Cluster is correctly forwarding connections passing on in the Haproxy generated Initial header the Real IP of its remote connect IPs.


Sum it up, What was done?


HTTP_X_FORWARD_FOR is impossible to set, when haproxy is used on mode tcp and all traffic is sent as received from TCP IPv4 / IPv6 Network stack, e.g. modifying any HTTP sent traffic inside the headers is not possible as this might break up the data.

Thus Haproxy was configured to send all its received data by sending initial proxy header with the X_FORWARDED usual Source IP data, then remoteip Apache module was used to make Apache receive and understand haproxy sent Header which contains the original Source IP via the send-proxy functionality and example was given on how to test the remoteip on Webserver is working correctly.

Finally you've seen how to check configured haproxy and webserver are able to send and receive the End Client data with the originator real source IP correctly and those Internet IP is properly logged inside both haproxy and apaches.

Howto debug and remount NFS hangled filesystem on Linux

Monday, August 12th, 2019

nfsnetwork-file-system-architecture-diagram

If you're using actively NFS remote storage attached to your Linux server it is very useful to get the number of dropped NFS connections and in that way to assure you don't have a remote NFS server issues or Network connectivity drops out due to broken network switch a Cisco hub or other network hop device that is routing the traffic from Source Host (SRC) to Destination Host (DST) thus, at perfect case if NFS storage and mounted Linux Network filesystem should be at (0) zero dropped connectios or their number should be low. Firewall connectivity between Source NFS client host and Destination NFS Server and mount should be there (set up fine) as well as proper permissions assigned on the server, as well as the DST NFS should be not experiencing I/O overheads as well as no DNS issues should be present (if NFS is not accessed directly via IP address).
In below article which is mostly for NFS novice admins is described shortly few of the nuances of working with NFS.
 

1. Check nfsstat and portmap for issues

One indicator that everything is fine with a configured NFS mount is the number of dropped NFS connections
or with a very low count of dropped connections, to check them if you happen to administer NFS

nfsstat


linux:~# nfsstat -o net
Server packet stats:
packets    udp        tcp        tcpconn
0          0          0          0  


nfsstat is useful if you have to debug why occasionally NFS mounts are getting unresponsive.

As NFS is so dependent upon portmap service for mapping the ports, one other point to check in case of Hanged NFSes is the portmap service whether it did not crashed due to some reason.


linux:~# service portmap status
portmap (pid 7428) is running…   [portmap service is started.]


linux:~# ps axu|grep -i rpcbind
_rpc       421  0.0  0.0   6824  3568 ?        Ss   10:30   0:00 /sbin/rpcbind -f -w


A useful commands to debug further rcp caused issues are:

On client side:


rpcdebug -m nfs -c


On server side:


rpcdebug -m nfsd -c


It might be also useful to check whether remote NFS permissions did not changed with the good old showmount cmd

linux:~# showmount -e rem_nfs_server_host


Also it is useful to check whether /etc/exports file was not modified somehow and whether the NFS did not hanged due to attempt of NFS daemon to reload the new configuration from there, another file to check while debugging is /etc/nfs.conf – are there group / permissions issues as well as the usual /var/log/messages and the kernel log with dmesg command for weird produced NFS client / server or network messages.

nfs-utils disabled serving NFS over UDP in version 2.2.1. Arch core updated to 2.3.1 on 21 Dec 2017 (skipping over 2.2.1.) If UDP stopped working then, add udp=y under [nfsd] in /etc/nfs.conf. Then restart nfs-server.service.

If the remote NFS server is running also Linux it is useful to check its /etc/default/nfs-kernel-server configuration

At some stall cases it might be also useful to remount the NFS (but as there might be a process on the Linux server) trying to read / write data from the remote NFS mounted FS it is a good idea to check (whether a process / service) on the server is not doing I/O operations on the NFS and if such is existing to kill the process in question with fuser
 

linux:~# fuser -k [mounted-filesystem]


2. Diagnose the problem interactively with htop


    Htop should be your first port of call. The most obvious symptom will be a maxed-out CPU.
    Press F2, and under "Display options", enable "Detailed CPU time". Press F1 for an explanation of the colours used in the CPU bars. In particular, is the CPU spending most of its time responding to IRQs, or in Wait-IO (wio)?
 

3. Get more extensive Mount info with mountstats


nfs-utils package contains mountstats command which is very useful in debugging further the issues identified

$ mountstats
Stats for example:/tank mounted on /tank:
  NFS mount options: rw,sync,vers=4.2,rsize=524288,wsize=524288,namlen=255,acregmin=3,acregmax=60,acdirmin=30,acdirmax=60,soft,proto=tcp,port=0,timeo=15,retrans=2,sec=sys,clientaddr=xx.yy.zz.tt,local_lock=none
  NFS server capabilities: caps=0xfbffdf,wtmult=512,dtsize=32768,bsize=0,namlen=255
  NFSv4 capability flags: bm0=0xfdffbfff,bm1=0x40f9be3e,bm2=0x803,acl=0x3,sessions,pnfs=notconfigured
  NFS security flavor: 1  pseudoflavor: 0


NFS byte counts:
  applications read 248542089 bytes via read(2)
  applications wrote 0 bytes via write(2)
  applications read 0 bytes via O_DIRECT read(2)
  applications wrote 0 bytes via O_DIRECT write(2)
  client read 171375125 bytes via NFS READ
  client wrote 0 bytes via NFS WRITE

RPC statistics:
  699 RPC requests sent, 699 RPC replies received (0 XIDs not found)
  average backlog queue length: 0

READ:
    338 ops (48%)
    avg bytes sent per op: 216    avg bytes received per op: 507131
    backlog wait: 0.005917     RTT: 548.736686     total execute time: 548.775148 (milliseconds)
GETATTR:
    115 ops (16%)
    avg bytes sent per op: 199    avg bytes received per op: 240
    backlog wait: 0.008696     RTT: 15.756522     total execute time: 15.843478 (milliseconds)
ACCESS:
    93 ops (13%)
    avg bytes sent per op: 203    avg bytes received per op: 168
    backlog wait: 0.010753     RTT: 2.967742     total execute time: 3.032258 (milliseconds)
LOOKUP:
    32 ops (4%)
    avg bytes sent per op: 220    avg bytes received per op: 274
    backlog wait: 0.000000     RTT: 3.906250     total execute time: 3.968750 (milliseconds)
OPEN_NOATTR:
    25 ops (3%)
    avg bytes sent per op: 268    avg bytes received per op: 350
    backlog wait: 0.000000     RTT: 2.320000     total execute time: 2.360000 (milliseconds)
CLOSE:
    24 ops (3%)
    avg bytes sent per op: 224    avg bytes received per op: 176
    backlog wait: 0.000000     RTT: 30.250000     total execute time: 30.291667 (milliseconds)
DELEGRETURN:
    23 ops (3%)
    avg bytes sent per op: 220    avg bytes received per op: 160
    backlog wait: 0.000000     RTT: 6.782609     total execute time: 6.826087 (milliseconds)
READDIR:
    4 ops (0%)
    avg bytes sent per op: 224    avg bytes received per op: 14372
    backlog wait: 0.000000     RTT: 198.000000     total execute time: 198.250000 (milliseconds)
SERVER_CAPS:
    2 ops (0%)
    avg bytes sent per op: 172    avg bytes received per op: 164
    backlog wait: 0.000000     RTT: 1.500000     total execute time: 1.500000 (milliseconds)
FSINFO:
    1 ops (0%)
    avg bytes sent per op: 172    avg bytes received per op: 164
    backlog wait: 0.000000     RTT: 2.000000     total execute time: 2.000000 (milliseconds)
PATHCONF:
    1 ops (0%)
    avg bytes sent per op: 164    avg bytes received per op: 116
    backlog wait: 0.000000     RTT: 1.000000     total execute time: 1.000000 (milliseconds)


nfs-utils disabled serving NFS over UDP in version 2.2.1. Arch core updated to 2.3.1 on 21 Dec 2017 (skipping over 2.2.1.) If UDP stopped working then, add udp=y under [nfsd] in /etc/nfs.conf. Then restart nfs-server.service.
 

4. Check for firewall issues
 

If all fails make sure you don't have any kind of firewall issues. Sometimes firewall changes on remote server or somewhere in the routing servers might lead to stalled NFS mounts.


To use properly NFS as you should know as a minimum you need to have opened as ports is Port 111 (TCP and UDP) and 2049 (TCP and UDP) on the NFS server (side) as well as any traffic inspection routers on the road from SRC (Linux client host) and NFS Storage destination DST server.

There are also ports for Cluster and client status (Port 1110 TCP for the former, and 1110 UDP for the latter) as well as a port for the NFS lock manager (Port 4045 TCP and UDP) but having this opened or not depends on how the NFS is configured. You can further determine which ports you need to allow depending on which services are needed cross-gateway.
 

5. How to Remount a Stalled unresponsive NFS filesystem mount


At many cases situation with remounting stalled NFS filesystem is not so easy but if you're lucky a standard mount and remount should do the trick.

Most simple way to remout the NFS (once you're sure this might not disrupt any service) – don't blame me if you break something is with:
 

umount -l /mnt/NFS_mnt_point
mount /mnt/NFS_mnt_point


Note that the lazy mount (-l) umount opt is provided here as very often this is the only way to unmount a stalled NFS mount.

Sometimes if you have a lot of NFS mounts and all are inacessible it is useful to remount all NFS mounts, if the remote NFS is responsive this should be possible with a simple for bash loop:

for P in $(mount | awk '/type nfs / {print $3;}'); do echo $P; echo "sudo umount $P && sudo mount $P" && echo "ok :)"; done


If you cd /mnt/NFS_mnt_point and try ls and you get

$ ls
.: Stale File Handle


You will need to unmount the FS with forceful mount flag

umount -f /mnt/NFS_mnt_point
 

Sum it up


In this article, I've shown you a few simple ways to debug what is wrong with a Stalled / Hanged NFS filesystem present on a NFS server mounted on a Linux client server.
Above was explained the common issues caused by NFS portmap (rpcbind) dependency, how to its status is fine, some further diagnosis with htop and mountstat was pointed. I've pointed the minimum amount of TCP / UDP ports 2049 and 111 that needs to be opened for the NFS communication to work and finally explained on how to remount a stalled NFS single or all attached mount on a NFS client to restore to normal operations.
As NFS is a whole ocean of things and the number of ways it is used are too extensive this article is just a general info useful for the NFS dummy admin for more robust configs read some good book on NFS such as Managing NFS and NIS, 2nd Edition – O'Reilly Media and for Kernel related NFS debugging make sure you check as a minimum ArchLinux's NFS troubleshooting guide and sourceforge's NFS Troubleshoting and Optimizing NFS Performance guides.


Don’t revoke GoDaddy SSL certificate. (Expired) Revoked SSL is impossible to revert

Thursday, April 12th, 2012

godaddy_logo
One of our company SSL (https) Certificates recently expired so I needed to renew the SSL certificate.

I was in a hurry doing plenty of other stuffs so it seemed logical for me to Revoke the Certificate. I thought revoking the certificate will simply cancel it and afterwards, in Godaddy's SSL (Manager Certificates) interface the Revoked – Cancelled certificate will re-appear in the menu, ready to be generated in the same way as earlier I initially generated the Godaddy's bought SSL certificate

Hence I proceeded and used Revoke button:

Godaddy SSL certificate manager browser certificate Screenshot

Well guess what my calculations, were wrong.
 Revoking, just cancel it. The  revoked domain SSL certificate did not show up again in Godaddy's Cert Manager and I have no way from their interface to revert the changes.

To deal with the situation, I contacted Godaddy Support immediately with the following inquiry:
 

Other : Revoked SSL Certificate
Issue :
Hello we have revoked the SSL certificate for our domain our.domain-name.com.
 Can we revert back the certificate as it was.
If not how to generate a new key for our domain https://our.domain-name.com
Thanks in Advance.
Kindest Regards

"My-Company-name" Tech Support

In 5 hours time I received the following tech support answer:
 

Dear Tech Support,

Thank you for contacting Online Support. It is not possible to reinstate a canceled certificate. You will need to purchase a new certificate. I have requested that a refund be applied to your account. Once the credit appears in your account, please allow 5-7 business days to see the funds applied to the associated payment method. Thank you for your patience and understanding in this matter.

Please let us know if we can help you in any other way.

Sincerely,

Christian P.
Online Support Team
Customer Inquiry
Name : Cadia Tech Support
Domain Name : our.domain-name.com
ShopperID : xxxxxxxxx
Phone : xxxxxxxx
Shopper Validated : Yes
Browser : Mozilla/5.0 (Windows; U; Windows NT 6.1; en-US; rv:1.9.2.3) Gecko/20100401 Firefox/3.6.3

Apparently Godaddy, can work out a bit on their tech support answering time 5 hours for a simple reply is quite long.

Now taking in consideration, above reply from Godady, my only options are to either wait for 5 to 7 (business days) or buy a new credit for SSL certificate.

Buying a new credit will probably not happen as our company is experiencing some financial troubles because of the crisis. So I guess we will have to wait for this 7 days at worst. So again if you wonder to REVOKE or not an SSL certificate. Think again …

Just a small note to make here, that Godaddy has a very straight forward way to just renew an expered certificate, which I succesfully later have done for 4 domains. Well, if only I knew earlier what REVOKE SSL cert really does I wouldn't have ended in this mess …

Resolving “nf_conntrack: table full, dropping packet.” flood message in dmesg Linux kernel log

Wednesday, March 28th, 2012

nf_conntrack_table_full_dropping_packet
On many busy servers, you might encounter in /var/log/syslog or dmesg kernel log messages like

nf_conntrack: table full, dropping packet

to appear repeatingly:

[1737157.057528] nf_conntrack: table full, dropping packet.
[1737157.160357] nf_conntrack: table full, dropping packet.
[1737157.260534] nf_conntrack: table full, dropping packet.
[1737157.361837] nf_conntrack: table full, dropping packet.
[1737157.462305] nf_conntrack: table full, dropping packet.
[1737157.564270] nf_conntrack: table full, dropping packet.
[1737157.666836] nf_conntrack: table full, dropping packet.
[1737157.767348] nf_conntrack: table full, dropping packet.
[1737157.868338] nf_conntrack: table full, dropping packet.
[1737157.969828] nf_conntrack: table full, dropping packet.
[1737157.969928] nf_conntrack: table full, dropping packet
[1737157.989828] nf_conntrack: table full, dropping packet
[1737162.214084] __ratelimit: 83 callbacks suppressed

There are two type of servers, I've encountered this message on:

1. Xen OpenVZ / VPS (Virtual Private Servers)
2. ISPs – Internet Providers with heavy traffic NAT network routers
 

I. What is the meaning of nf_conntrack: table full dropping packet error message

In short, this message is received because the nf_conntrack kernel maximum number assigned value gets reached.
The common reason for that is a heavy traffic passing by the server or very often a DoS or DDoS (Distributed Denial of Service) attack. Sometimes encountering the err is a result of a bad server planning (incorrect data about expected traffic load by a company/companeis) or simply a sys admin error…

– Checking the current maximum nf_conntrack value assigned on host:

linux:~# cat /proc/sys/net/ipv4/netfilter/ip_conntrack_max
65536

– Alternative way to check the current kernel values for nf_conntrack is through:

linux:~# /sbin/sysctl -a|grep -i nf_conntrack_max
error: permission denied on key 'net.ipv4.route.flush'
net.netfilter.nf_conntrack_max = 65536
error: permission denied on key 'net.ipv6.route.flush'
net.nf_conntrack_max = 65536

– Check the current sysctl nf_conntrack active connections

To check present connection tracking opened on a system:

:

linux:~# /sbin/sysctl net.netfilter.nf_conntrack_count
net.netfilter.nf_conntrack_count = 12742

The shown connections are assigned dynamicly on each new succesful TCP / IP NAT-ted connection. Btw, on a systems that work normally without the dmesg log being flooded with the message, the output of lsmod is:

linux:~# /sbin/lsmod | egrep 'ip_tables|conntrack'
ip_tables 9899 1 iptable_filter
x_tables 14175 1 ip_tables

On servers which are encountering nf_conntrack: table full, dropping packet error, you can see, when issuing lsmod, extra modules related to nf_conntrack are shown as loaded:

linux:~# /sbin/lsmod | egrep 'ip_tables|conntrack'
nf_conntrack_ipv4 10346 3 iptable_nat,nf_nat
nf_conntrack 60975 4 ipt_MASQUERADE,iptable_nat,nf_nat,nf_conntrack_ipv4
nf_defrag_ipv4 1073 1 nf_conntrack_ipv4
ip_tables 9899 2 iptable_nat,iptable_filter
x_tables 14175 3 ipt_MASQUERADE,iptable_nat,ip_tables


II. Remove completely nf_conntrack support if it is not really necessery

It is a good practice to limit or try to omit completely use of any iptables NAT rules to prevent yourself from ending with flooding your kernel log with the messages and respectively stop your system from dropping connections.

Another option is to completely remove any modules related to nf_conntrack, iptables_nat and nf_nat.
To remove nf_conntrack support from the Linux kernel, if for instance the system is not used for Network Address Translation use:

/sbin/rmmod iptable_nat
/sbin/rmmod ipt_MASQUERADE
/sbin/rmmod rmmod nf_nat
/sbin/rmmod rmmod nf_conntrack_ipv4
/sbin/rmmod nf_conntrack
/sbin/rmmod nf_defrag_ipv4

Once the modules are removed, be sure to not use iptables -t nat .. rules. Even attempt to list, if there are any NAT related rules with iptables -t nat -L -n will force the kernel to load the nf_conntrack modules again.

Btw nf_conntrack: table full, dropping packet. message is observable across all GNU / Linux distributions, so this is not some kind of local distribution bug or Linux kernel (distro) customization.
 

III. Fixing the nf_conntrack … dropping packets error

– One temporary, fix if you need to keep your iptables NAT rules is:

linux:~# sysctl -w net.netfilter.nf_conntrack_max=131072

I say temporary, because raising the nf_conntrack_max doesn't guarantee, things will get smoothly from now on.
However on many not so heavily traffic loaded servers just raising the net.netfilter.nf_conntrack_max=131072 to a high enough value will be enough to resolve the hassle.

– Increasing the size of nf_conntrack hash-table

The Hash table hashsize value, which stores lists of conntrack-entries should be increased propertionally, whenever net.netfilter.nf_conntrack_max is raised.

linux:~# echo 32768 > /sys/module/nf_conntrack/parameters/hashsize
The rule to calculate the right value to set is:
hashsize = nf_conntrack_max / 4

– To permanently store the made changes ;a) put into /etc/sysctl.conf:

linux:~# echo 'net.netfilter.nf_conntrack_count = 131072' >> /etc/sysctl.conf
linux:~# /sbin/sysct -p

b) put in /etc/rc.local (before the exit 0 line):

echo 32768 > /sys/module/nf_conntrack/parameters/hashsize

Note: Be careful with this variable, according to my experience raising it to too high value (especially on XEN patched kernels) could freeze the system.
Also raising the value to a too high number can freeze a regular Linux server running on old hardware.

– For the diagnosis of nf_conntrack stuff there is ;

/proc/sys/net/netfilter kernel memory stored directory. There you can find some values dynamically stored which gives info concerning nf_conntrack operations in "real time":

linux:~# cd /proc/sys/net/netfilter
linux:/proc/sys/net/netfilter# ls -al nf_log/

total 0
dr-xr-xr-x 0 root root 0 Mar 23 23:02 ./
dr-xr-xr-x 0 root root 0 Mar 23 23:02 ../
-rw-r--r-- 1 root root 0 Mar 23 23:02 0
-rw-r--r-- 1 root root 0 Mar 23 23:02 1
-rw-r--r-- 1 root root 0 Mar 23 23:02 10
-rw-r--r-- 1 root root 0 Mar 23 23:02 11
-rw-r--r-- 1 root root 0 Mar 23 23:02 12
-rw-r--r-- 1 root root 0 Mar 23 23:02 2
-rw-r--r-- 1 root root 0 Mar 23 23:02 3
-rw-r--r-- 1 root root 0 Mar 23 23:02 4
-rw-r--r-- 1 root root 0 Mar 23 23:02 5
-rw-r--r-- 1 root root 0 Mar 23 23:02 6
-rw-r--r-- 1 root root 0 Mar 23 23:02 7
-rw-r--r-- 1 root root 0 Mar 23 23:02 8
-rw-r--r-- 1 root root 0 Mar 23 23:02 9


IV. Decreasing other nf_conntrack NAT time-out values to prevent server against DoS attacks

Generally, the default value for nf_conntrack_* time-outs are (unnecessery) large.
Therefore, for large flows of traffic even if you increase nf_conntrack_max, still shorty you can get a nf_conntrack overflow table resulting in dropping server connections. To make this not happen, check and decrease the other nf_conntrack timeout connection tracking values:

linux:~# sysctl -a | grep conntrack | grep timeout
net.netfilter.nf_conntrack_generic_timeout = 600
net.netfilter.nf_conntrack_tcp_timeout_syn_sent = 120
net.netfilter.nf_conntrack_tcp_timeout_syn_recv = 60
net.netfilter.nf_conntrack_tcp_timeout_established = 432000
net.netfilter.nf_conntrack_tcp_timeout_fin_wait = 120
net.netfilter.nf_conntrack_tcp_timeout_close_wait = 60
net.netfilter.nf_conntrack_tcp_timeout_last_ack = 30
net.netfilter.nf_conntrack_tcp_timeout_time_wait = 120
net.netfilter.nf_conntrack_tcp_timeout_close = 10
net.netfilter.nf_conntrack_tcp_timeout_max_retrans = 300
net.netfilter.nf_conntrack_tcp_timeout_unacknowledged = 300
net.netfilter.nf_conntrack_udp_timeout = 30
net.netfilter.nf_conntrack_udp_timeout_stream = 180
net.netfilter.nf_conntrack_icmp_timeout = 30
net.netfilter.nf_conntrack_events_retry_timeout = 15
net.ipv4.netfilter.ip_conntrack_generic_timeout = 600
net.ipv4.netfilter.ip_conntrack_tcp_timeout_syn_sent = 120
net.ipv4.netfilter.ip_conntrack_tcp_timeout_syn_sent2 = 120
net.ipv4.netfilter.ip_conntrack_tcp_timeout_syn_recv = 60
net.ipv4.netfilter.ip_conntrack_tcp_timeout_established = 432000
net.ipv4.netfilter.ip_conntrack_tcp_timeout_fin_wait = 120
net.ipv4.netfilter.ip_conntrack_tcp_timeout_close_wait = 60
net.ipv4.netfilter.ip_conntrack_tcp_timeout_last_ack = 30
net.ipv4.netfilter.ip_conntrack_tcp_timeout_time_wait = 120
net.ipv4.netfilter.ip_conntrack_tcp_timeout_close = 10
net.ipv4.netfilter.ip_conntrack_tcp_timeout_max_retrans = 300
net.ipv4.netfilter.ip_conntrack_udp_timeout = 30
net.ipv4.netfilter.ip_conntrack_udp_timeout_stream = 180
net.ipv4.netfilter.ip_conntrack_icmp_timeout = 30

All the timeouts are in seconds. net.netfilter.nf_conntrack_generic_timeout as you see is quite high – 600 secs = (10 minutes).
This kind of value means any NAT-ted connection not responding can stay hanging for 10 minutes!

The value net.netfilter.nf_conntrack_tcp_timeout_established = 432000 is quite high too (5 days!)
If this values, are not lowered the server will be an easy target for anyone who would like to flood it with excessive connections, once this happens the server will quick reach even the raised up value for net.nf_conntrack_max and the initial connection dropping will re-occur again …

With all said, to prevent the server from malicious users, situated behind the NAT plaguing you with Denial of Service attacks:

Lower net.ipv4.netfilter.ip_conntrack_generic_timeout to 60 – 120 seconds and net.ipv4.netfilter.ip_conntrack_tcp_timeout_established to stmh. like 54000

linux:~# sysctl -w net.ipv4.netfilter.ip_conntrack_generic_timeout = 120
linux:~# sysctl -w net.ipv4.netfilter.ip_conntrack_tcp_timeout_established = 54000

This timeout should work fine on the router without creating interruptions for regular NAT users. After changing the values and monitoring for at least few days make the changes permanent by adding them to /etc/sysctl.conf

linux:~# echo 'net.ipv4.netfilter.ip_conntrack_generic_timeout = 120' >> /etc/sysctl.conf
linux:~# echo 'net.ipv4.netfilter.ip_conntrack_tcp_timeout_established = 54000' >> /etc/sysctl.conf

WordPress Plugins to monitor and debug WP enabled plugins – Find Errors / Warnings and Remove WP problematic plugins slowing down your Website (blog) database

Thursday, February 19th, 2015

plugins-to-monitor-debug-wordpress-enabled-plugins-how-to-track-find-errors-and-warnings-and-remove-problematic-wp-extensions-that-slow-down-your-website

Recent days, I'm spending a lot of time again trying to optimize my wordpress blog. Optimizing WP for better efficiency is becoming harder and harder task day by day as the website file content data is growing along with SQL databases. Moreover situation gets even worse because the number of plugins enabled on my blog is incrementally growing with time because, there is more and more goodies I'd like to add.
Optimizing WordPress to run for Speed on a server is a whole a lot of art and its a small universe in itself, because as of time of writting this post the count (number) of WordPress available PLUGINS is 36,197 ! 

1. Manually Tracking WordPress  Plugins causing Slow SQL Queries (MySQL bottleneck) issues directly using console / SSH

Because of its open source development and its nice modular design wordpress has turned into a standard for building small, middle sized and large websites (some WordPress based blogs and sites have from 50 000 to 100 000 unique pages!). My blog is still a small WordPress site with only 1676 posts, so I still haven't reached the high volume traffic optimization requirements but still even though I have a relatively good server hardware  8GB RAM / (2×2.70 Ghz Intel CPU) / 500 GB (7400 RPM HDD) at times I see Apache Webservers is unable to properly serve coming requests because of MySQL database (LEFT JOIN) requests being slow to serve (taking up to few seconds to complete) and creating a MySQL table lock, putting all the rest SQL queries to stay in a long unserved queues line, I've realized about this performance issue by using a a mysql cli (command) client and few commands and console command (tool) called mytop (also known as mtop). MyTop refreshes every 3 seconds, so the slow query will immediately stay on screen to view moer info about it press "f" and type the  in query ID.

mysql-top-running-on-gnu-linux-server-tracking-sql-queries-in-console-screenshot.png

mysql-top-running-on-gnu-linux-server-tracking-sql-queries-in-console-screenshot2

Finally it is very useful to run  for a while MySQL server logging to /var/log/mysql/slow-query.log:
Slow query is enabled (on my Debian 7 Wheezy host) by adding to /etc/mysql/my.cnf
after conf section


vim /etc/mysql/my.cnf
#
# * Logging and Replication
#
# Both location gets rotated by the cronjob.
# Be aware that this log type is a performance killer.
# As of 5.1 you can enable the log at runtime!
#general_log_file        = /var/log/mysql/mysql.log
#general_log             = 1
#
# Error logging goes to syslog due to /etc/mysql/conf.d/mysqld_safe_syslog.cnf.
#
# Here you can see queries with especially long duration


Paste:


slow_query_log = 1
slow_query_log_file = /var/log/mysql/slow-query.log
long_query_time = 2
log-queries-not-using-indexes


And then to make new mysql configuration load restarted mysql server:


debian-server:~# /etc/init.d/mysql restart
Stopping MySQL database server: mysqld.
Starting MySQL database server: mysqld ..
Checking for tables which need an upgrade, are corrupt or were
not closed cleanly..


Leaving mysql-slow.log to be enabled for 30 minutes to an 1 hrs is a good time to track most problematic slow queries and based on this queries, I took parts of  SQL UPDATE / SELECT / INSERT etc. Db queries which was problematic and grepped throughout /var/www/blog/wp-content/plugin files in order to determine which WordPress Plugin is triggering the slow query, causing blog to hang when too many clients try to see it in browser.

My main problematic SQL query having long execution time  (about 2 to 3 seconds!!!) most commonly occuring in slow-query.log was:


SELECT DISTINCT post_title, ID, post_type, post_name FROM wp_posts wposts LEFT JOIN wp_postmeta wpostmeta ON wposts.ID = wpostmeta.post_id LEFT JOIN wp_term_relationships ON (wposts.ID = wp_term_relationships.object_id) LEFT JOIN wp_term_taxonomy ON (wp_term_relationships.term_taxonomy_id = wp_term_taxonomy.term_taxonomy_id) WHERE (post_type='page' OR (wp_term_taxonomy.taxonomy = 'category' AND wp_term_taxonomy.term_id IN(11))) AND post_status = 'publish' AND LENGTH(post_title)>=5 ORDER BY LENGTH(post_title) ASC LIMIT 500

Because above query uses SQL Column names and Tables which are not hard coded in PHP code, to find out which plugins is most probably to launch this complex LEFT JOIN query, I used a quick bash one-liner:


# cd /var/www/blog/wp-content/plugins


# for i in $(grep -rli 'SELECT DISTINCT' *); do grep -rli 'LEFT JOIN' $i; done 
./seo-automatic-links/seo-links.php
./wp-postviews/wp-postviews.php
./yet-another-related-posts-plugin/classes/YARPP_Cache_Tables.php


I wanted to put less load on CPU during grep so looked for string only in .PHP extensioned files with:


 # for i in $(find . -iname '*.php' -exec grep -rli 'SELECT DISTINCT' '{}' \;); do grep -rli 'LEFT JOIN' $i; done
./seo-automatic-links/seo-links.php
./wp-postviews/wp-postviews.php
./yet-another-related-posts-plugin/classes/YARPP_Cache_Tables.php


As you can see the complex query is being called from PHP file belonging to one of 3 plugins

  • SEO Automatic Links – this is SEO Smart Links WP plugin (Does internal bliog interlinking in order to boast SEA)
  • WP PostViews – WordPress Post Views plugin (Which allows me to show how many times an article was read in WP Widget menu)
  • Yet Another Related Posts – Which is WP plugin I installed / enabled to show Related posts down on each blog post


2. Basic way to optimize MySQL slow queries (EXPLAIN / SHOW CREATE TABLE)

Now as I have a basic clue on plugins locking my Database, I disabled them one by one while keeping enabled mysql slow query log and viewing queries in mytop and I figure out that actually all of the plugins were causing a short time overheat (lock) on server Database because of LEFT JOINs. Though I really like what this plugins are doing, as they boast SEO and attract prefer to disable them for now and have my blog all the time responsible light fast instead of having a little bit better Search Engine Optimization (Ranking) and loosing many of my visitors because they're annoyed to wait until my articles open

Before disabling I tried to optimize the queries using MySQL EXPLAIN command + SHOW CREATE TABLE (2 commands often used to debug slow SQL queries and find out whether a Column needs to have added INDEX-ing to boast MySQL query).

Just in case if you decide to give them a try here is example on how they're used to debug problematic SQL query:
 

  1. mysql> explain SELECT DISTINCT post_title, ID, post_type, post_name
  2.     -> FROM wp_posts wposts LEFT JOIN wp_postmeta wpostmeta
  3.     -> ON wposts.ID = wpostmeta.post_id LEFT JOIN wp_term_relationships
  4.     -> ON (wposts.ID = wp_term_relationships.object_id) LEFT JOIN wp_term_taxonomy
  5.     -> ON (wp_term_relationships.term_taxonomy_id = wp_term_taxonomy.term_taxonomy_id)
  6.     -> WHERE (post_type='page'
  7.     -> OR (wp_term_taxonomy.taxonomy = 'category'
  8.     -> AND wp_term_taxonomy.term_id IN(11,15,17)))
  9.     -> AND post_status = 'publish'
  10.     -> AND LENGTH(post_title)>=5
  11.     -> ORDER BY LENGTH(post_title) ASC
  12.     -> LIMIT 500;
  13. +—-+————-+———————–+——–+——————+———+———+———————————————+——+———————————————-+
  14. | id | select_type | table                 | type   | possible_keys    | key     | key_len | ref                                         | rows | Extra                                        |
  15. +—-+————-+———————–+——–+——————+———+———+———————————————+——+———————————————-+
  16. |  1 | SIMPLE      | wposts                | ALL    | type_status_date | NULL    | NULL    | NULL                                        | 1715 | Using where; Using temporary; Using filesort |
  17. |  1 | SIMPLE      | wpostmeta             | ref    | post_id          | post_id | 8       | blog.wposts.ID                              |   11 | Using index; Distinct                        |
  18. |  1 | SIMPLE      | wp_term_relationships | ref    | PRIMARY          | PRIMARY | 8       | blog.wposts.ID                              |   19 | Using index; Distinct                        |
  19. |  1 | SIMPLE      | wp_term_taxonomy      | eq_ref | PRIMARY          | PRIMARY | 8       | blog.wp_term_relationships.term_taxonomy_id |    1 | Using where; Distinct                        |
  20. +—-+————-+———————–+——–+——————+———+———+———————————————+——+———————————————-+
  21. 4 rows in set (0.02 sec)
  22.  
  23. mysql>
  24.  


  1. mysql> show create table wp_posts;
  2. +———-+————————–+
  3. | Table    | Create Table                                                                                                                                                                                                                                                                                                                                                                                                                                 |
  4. +———-+————————–+
  5. | wp_posts | CREATE TABLE `wp_posts` (
  6.   `ID` bigint(20) unsigned NOT NULL AUTO_INCREMENT,
  7.   `post_author` bigint(20) unsigned NOT NULL DEFAULT '0',
  8.   `post_date` datetime NOT NULL DEFAULT '0000-00-00 00:00:00',
  9.   `post_date_gmt` datetime NOT NULL DEFAULT '0000-00-00 00:00:00',
  10.   `post_content` longtext NOT NULL,
  11.   `post_title` text NOT NULL,
  12.   `post_excerpt` text NOT NULL,
  13.   `post_status` varchar(20) NOT NULL DEFAULT 'publish',
  14.   `comment_status` varchar(20) NOT NULL DEFAULT 'open',
  15.   `ping_status` varchar(20) NOT NULL DEFAULT 'open',
  16.   `post_password` varchar(20) NOT NULL DEFAULT '',
  17.   `post_name` varchar(200) NOT NULL DEFAULT '',
  18.   `to_ping` text NOT NULL,
  19.   `pinged` text NOT NULL,
  20.   `post_modified` datetime NOT NULL DEFAULT '0000-00-00 00:00:00',
  21.   `post_modified_gmt` datetime NOT NULL DEFAULT '0000-00-00 00:00:00',
  22.   `post_content_filtered` longtext NOT NULL,
  23.   `post_parent` bigint(20) unsigned NOT NULL DEFAULT '0',
  24.   `guid` varchar(255) NOT NULL DEFAULT '',
  25.   `menu_order` int(11) NOT NULL DEFAULT '0',
  26.   `post_type` varchar(20) NOT NULL DEFAULT 'post',
  27.   `post_mime_type` varchar(100) NOT NULL DEFAULT '',
  28.   `comment_count` bigint(20) NOT NULL DEFAULT '0',
  29.   PRIMARY KEY (`ID`),
  30.   KEY `post_name` (`post_name`),
  31.   KEY `type_status_date` (`post_type`,`post_status`,`post_date`,`ID`),
  32.   KEY `post_parent` (`post_parent`),
  33.   KEY `post_author` (`post_author`),
  34.   FULLTEXT KEY `post_related` (`post_title`,`post_content`)
  35. ) ENGINE=MyISAM AUTO_INCREMENT=12033 DEFAULT CHARSET=utf8 |
  36. +———-+———————-+
  37. 1 row in set (0.00 sec)
  38.  
  39. mysql>
  40.  


By the way above output is a paste from the the new PasteBin Open Source (Stikked powered) service I started on www.pc-freak.net – paste.www.pc-freak.net (p.www.pc-freak.net) 🙂

Before I took final decision to disable slow WP plugins, I've experimented a bit trying to add INDEX to Table Column (wposts) in hope that this would speed up SQL queries with:


mysql> ALTER TABLE TABLE_NAME ADD INDEX (wposts);


But this didn't improve query speed even on the contrary it make execution time worse.

3. Tracking WordPress Plugin PHP Code Execution time and Plugins causing Slow SQL Queries (MySQL bottleneck) issues through WP itself

Well fine, I'm running my own hosted Blog and WordPress sites, but for people who have wordpress sites on shared hosting, there is usually no SSH (Terminal) Access to server, those people will be happy to hear there are 2 Free easy installable WordPress plugins which can be used to Debug Slow WordPress Plugins SQL Queries as well as plugin to Track which plugin takes most time to execute, this are:


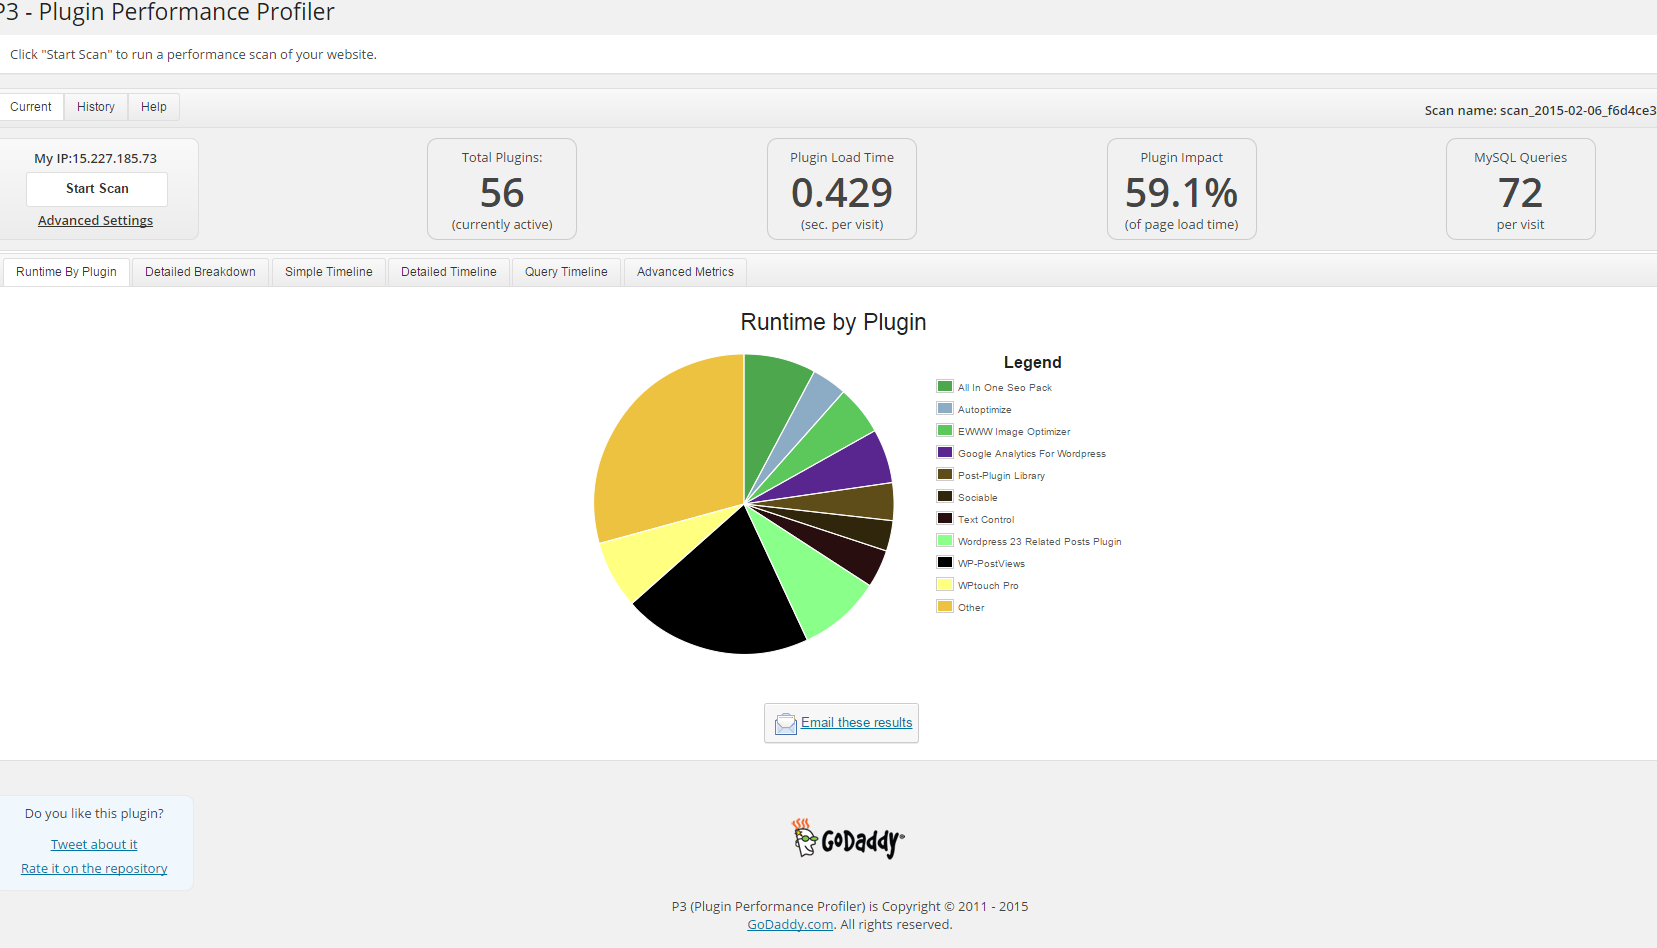
a) P3 Plugin Performance Profiler  

runs a scan over your site to determine what resources your plugins are using, and when, during a standard page request. P3 PPP Can even create reports in a beatiful Excel like Pie chart sheet.

p3-plugin-performance-profiler-godaddy-screenshot-debian-gnu-linux-wordpress-website

Another useful thing to see with P3 PPP is Detailed Timeline it shows when the plugins are being loaded during new page request so you can see if there is a certain sequence in time when a plugin slows down the website.

detailed_timeline-wordpress-p3-performance-plugin-on-website-screenshot

The pictures says it all as P3 PPP is Godaddy's work, congrats to GoDaddy, they've done great job.


b) WordPress memory Viewer WP plugins

Is useful to check how much memory each of WordPress plugin is taking on user (visitor) request.
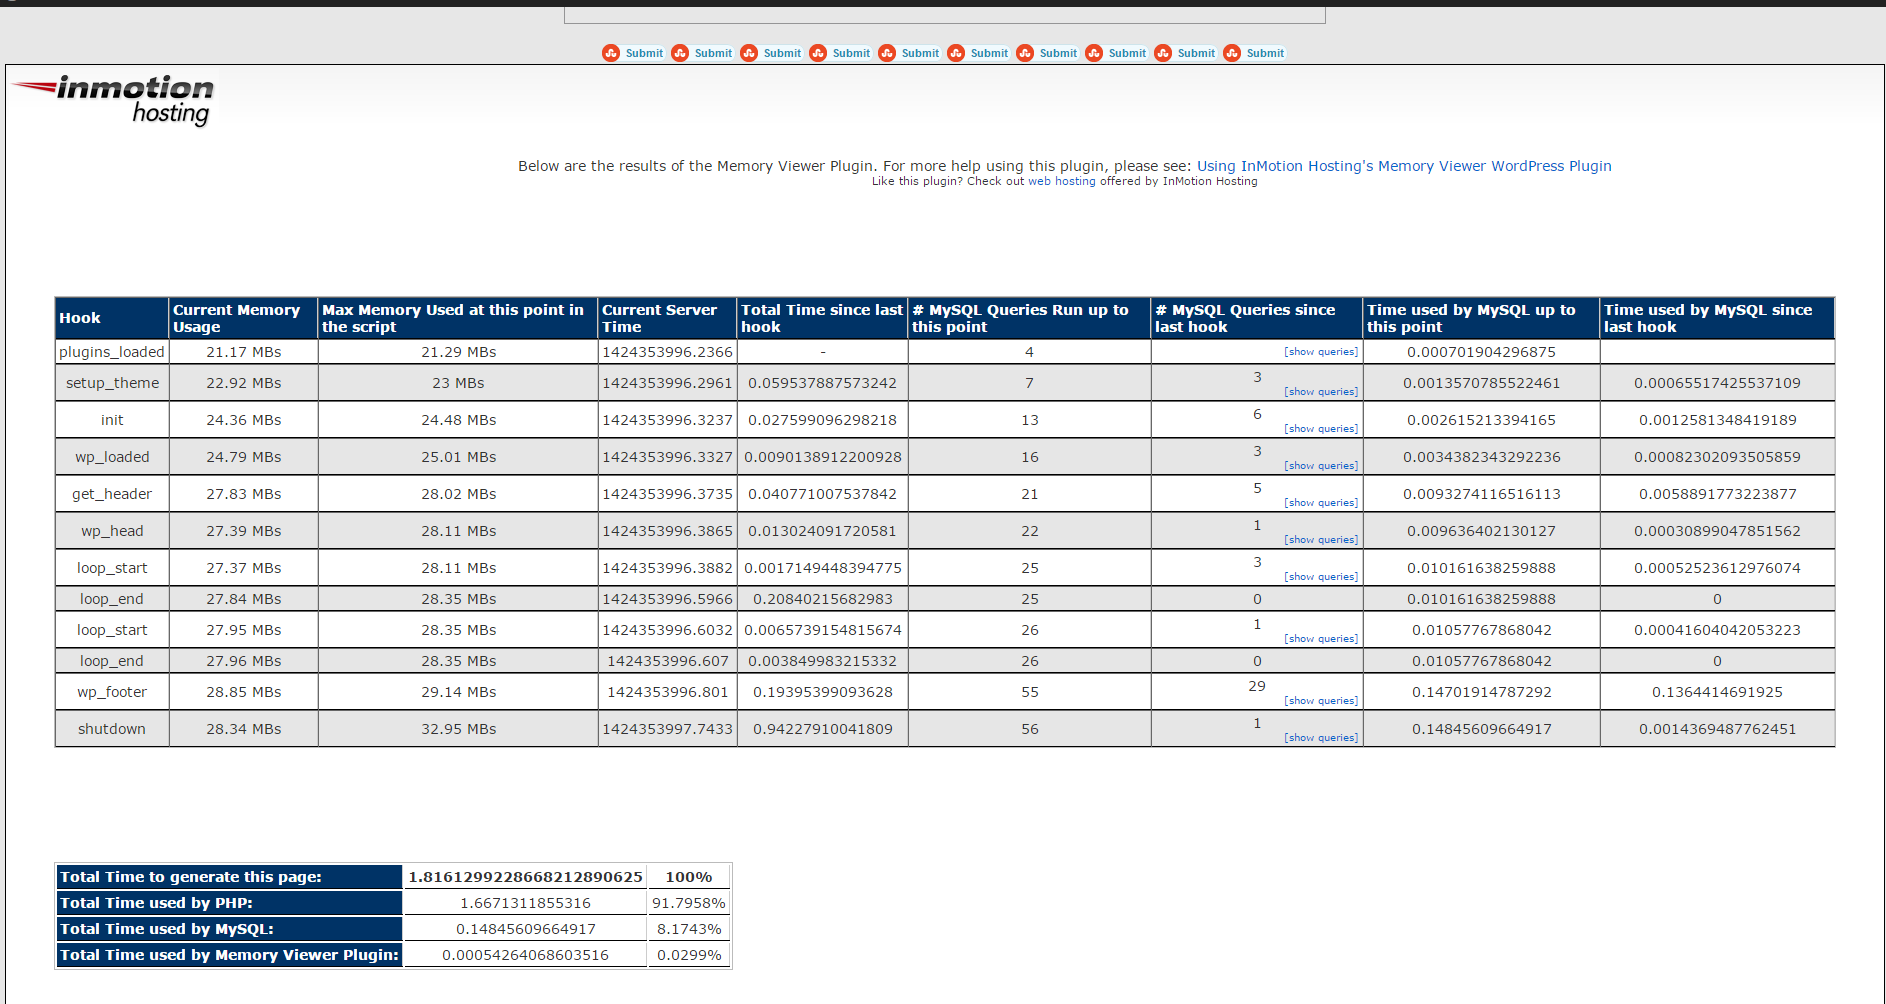
Memory Viewer is allows you to view WordPress’ memory utilization at several hooks during WordPress’ execution. It also shows a summary of MySQL Queries that have ran as well as CPU time.
To use it download it to plugins/ folder as usual enable it from:

Installed Plugins -> (Inactive) -> Memory Viewer (Enable)

To see statistics from Memory Viewer open any post from your blog website and scroll down to the bottom you will notice the statistics, showing up there, like on below screenshot.

wordpress-memory-viewer-plugin-debian-gnu-linux-hosted-website-show-which-plugin-component-eats-most-memory-in-wordprses-blog
 

Though WP Memory Viewer is said to work only up to WP version 3.2.1, I've tested it and it works fine on my latest stable WordPress 4.1 based blog.

c) WordPress Query Monitor

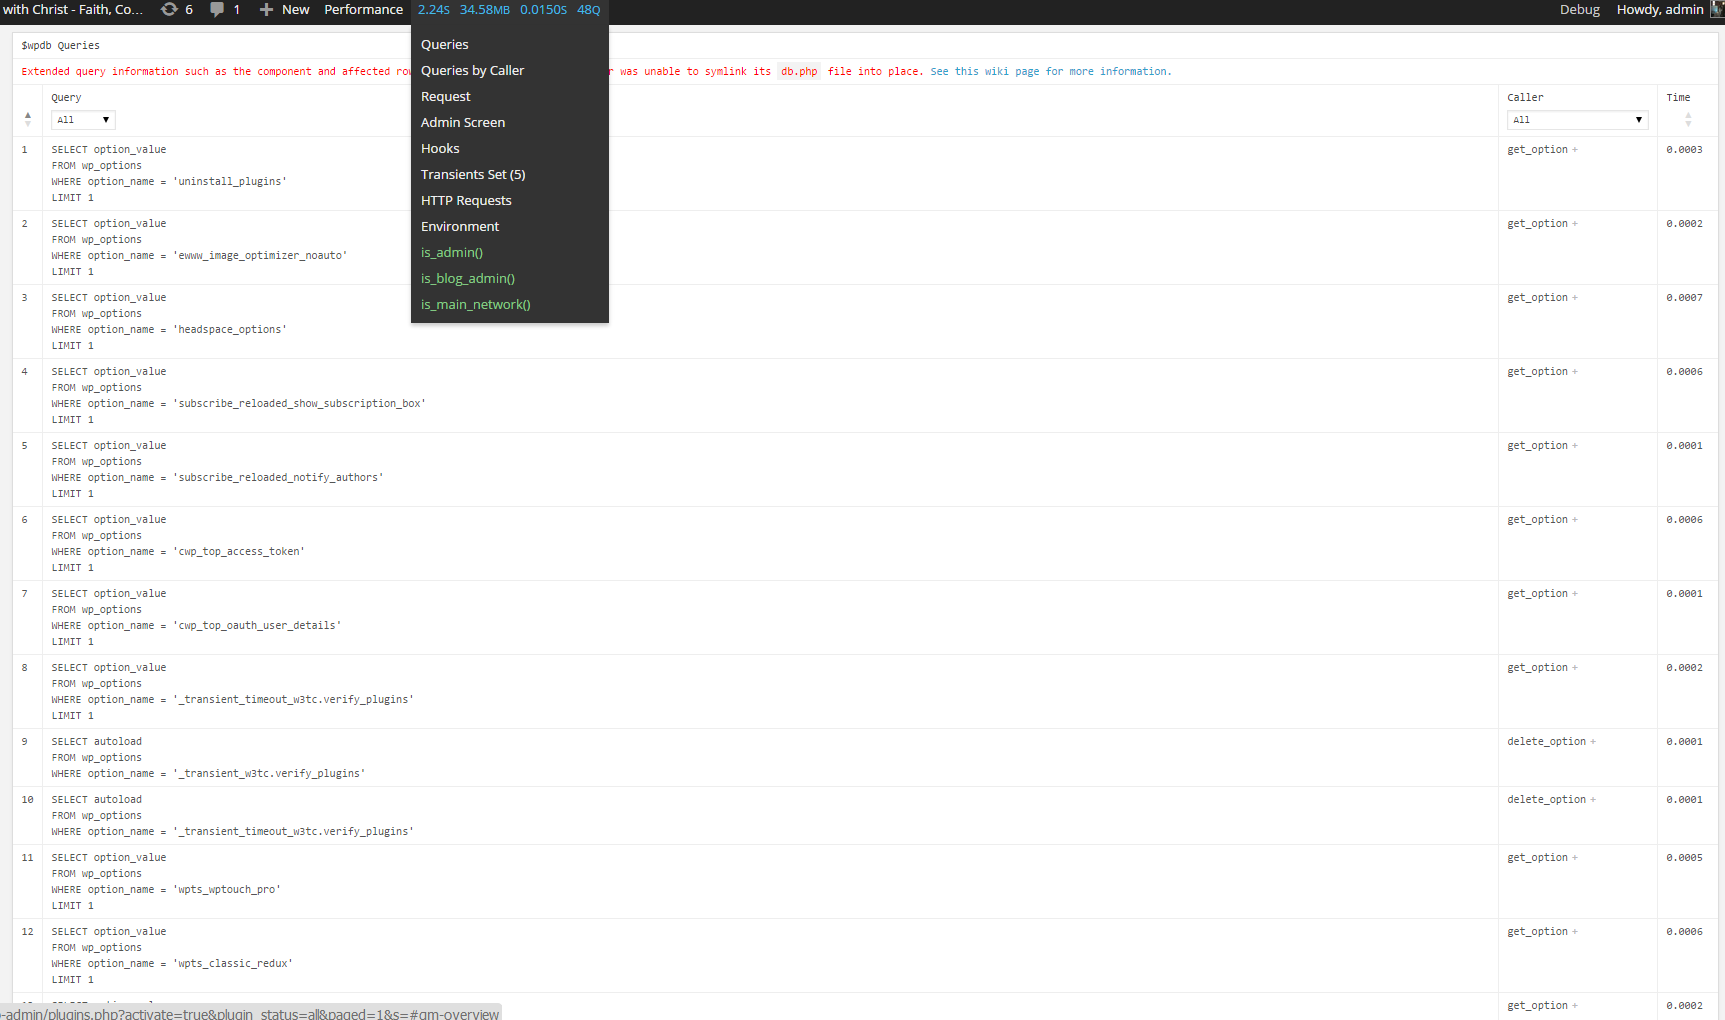
wordpress-query-monitor-plugin-to-monitor-track-and-optimize-problems-with-sql-caused-by-wp-plugins.png
 

Query Monitor is a debugging plugin for anyone developing with WordPress but also very helpful for anyone who want to track issues with plugins who use the database unefficient.
It has some advanced features not available in other debugging plugins, including automatic AJAX debugging and the ability to narrow down things by plugin or theme.
You can view plenty of precious statistics on how enabled plugins query the database server, here is a short overview on its Database Queries capabilities:

  • Shows all database queries performed on the current page
  • Shows affected rows and time for all queries
  • Show notifications for slow queries and queries with errors
  • Filter queries by query type (SELECT, UPDATE, DELETE, etc)
  • Filter queries by component (WordPress core, Plugin X, Plugin Y, theme)
  • Filter queries by calling function
  • View aggregate query information grouped by component, calling function, and type
  • Super advanced: Supports multiple instances of wpdb on one page
  • Once enabled from Plugins you will see it appear as a new menu on bottom Admin raw.

An important note to make here is latest Query Monitor extension fails when loaded on current latest Wordpress 4.1, to use it you will have to download and useolder Query Monitor plugin version 2.6.8 you can download it from here

d) Debug Bar

If you want you want a Memory Viewer like plugin for more complex used components memory debugging, reporting if (WP_DEBUG is set in wp-config.php) also check out Debug Bar .
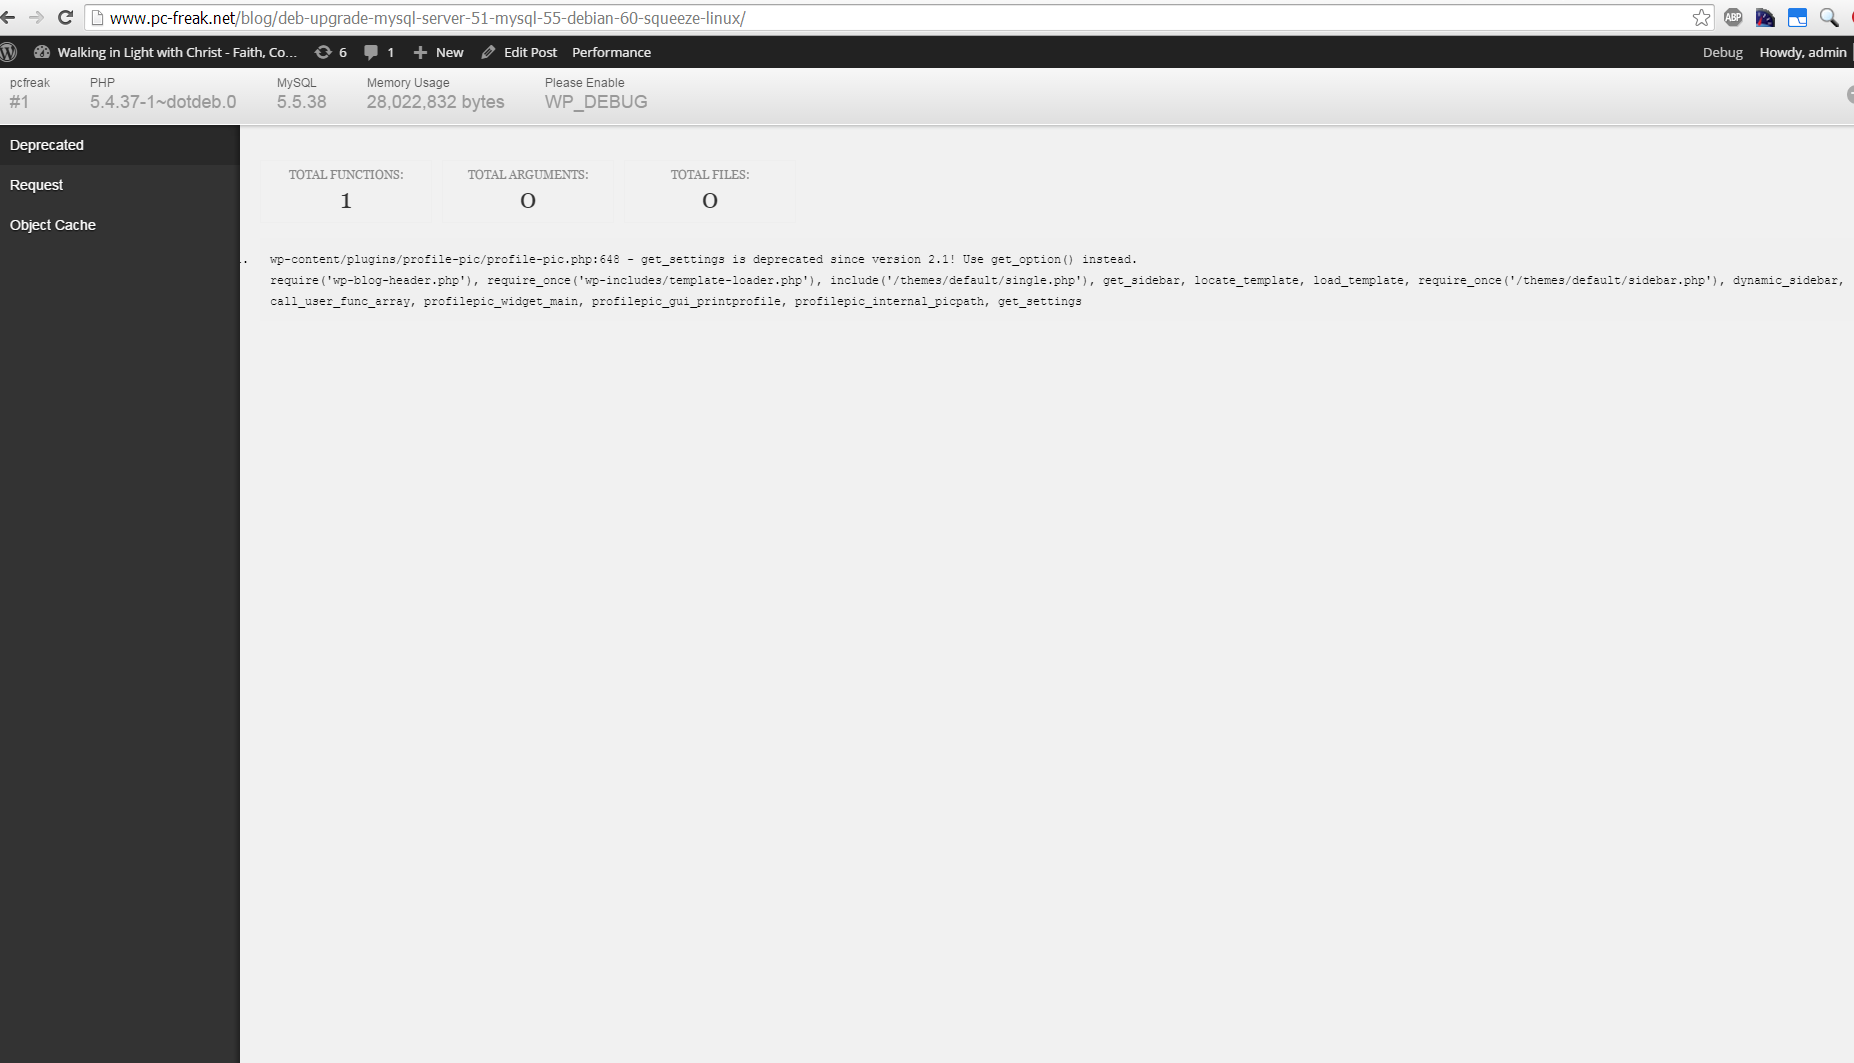
For me Debug Bar was very useful because it show me depreciated functions some plugins used, so I substituted the obsoleted function with new one.


debug-bar-debug-wordpress-plugins-memory-use-screenshot-website


4. Server Hardware hungry (slow) WordPress plugins that you better not use

While spending time to Google for some fixes to WP slow query plugins – I've stumbled upon this post giving a good list with WordPress Plugins better off not to use because they will slow down your site
This is a publicly well known list of WP plugins every WordPress based site adminstrator should avoid, but until today I didn't know so my assumption is you don't know either ..

Below plugins are extremely database intensive mentioned in article that we should better (in all cases!) avoid:

  • Dynamic Related Posts
  • SEO Auto Links & Related Posts
  • Yet Another Related Posts Plugin
  • Similar Posts
  • Contextual Related Posts
  • Broken Link Checker — Overwhelms even our robust caching layer with an inordinate amount of HTTP requests.
  • MyReviewPlugin — Slams the database with a fairly significant amount of writes.
  • LinkMan — Much like the MyReviewPlugin above, LinkMan utilizes an unscalable amount of database writes.
  • Fuzzy SEO Booster — Causes MySQL issues as a site becomes more popular.
  • WP PostViews — Inefficiently writes to the database on every page load. To track traffic in a more scalable manner, both the stats module in Automattic’s Jetpack plugin and Google Analytics work wonderfully.
  • Tweet Blender — Does not play nicely with our caching layer and can cause increased server load.


A good Complete list of known WordPress slow plugins that will hammer down your wordpress performance is here

There are few alternatives to this plugins and when I have some free time I will download and test their alternatives but for now I plan the plugins to stay disabled.
 

For the absolute WP Performance Optimization Freaks, its good to check out the native way to Debug a wordpress installation through using few embedded
variables


define('WP_DEBUG', true);
define('WP_DEBUG', false);
define('WP_DEBUG_LOG', true);
define('WP_DEBUG_DISPLAY', false);
define('SAVEQUERIES', true);


An article describing how you can use native WP debug variables is here


Happy Optimizing  ! 🙂

Mysql: How to disable single database without dropping or renaming it

Wednesday, January 22nd, 2014

mysql rename forbid disable database howto logo, how to disable single database without dropping it
A colleague of mine working on MySQL database asked me How it is possible to disable a MySQL database. He is in situation where the client has 2 databases and application and is not sure which of the two databases the application uses. Therefore the client asked one of the database is disabled and wait for few hours and see if something will break / stop working and in that way determine which of the two database is used by application.

My first guess was to backup both databases and drop one of them, then if it is the wrong one to restore from the SQL dump backup, however this wasn't acceptable solution. So second I though of RENAME of database to another one and then reverting the name, however as it is written in MySQL documentation RENAME database function was removed from MySQL (found to be dangerous) since version 5.1.23 onwards. Anyhow there is a quick hack to rename mysql database using a for loop shell script one below:

mysql -e "CREATE DATABASE \`new_database\`;"
for table in `mysql -B -N -e "SHOW TABLES;" old_database`
do
  mysql -e "RENAME TABLE \`old_database\`.\`$table\` to \`new_database\`.\`$table\`"
  done
  mysql -e "DROP DATABASE \`old_database\`;"

Other possible solution was to change permissions of Application used username, however this was also complicated from mysql cli, hence I thought of installing and using PHPMyAdmin to make modify of db user permissions easier but on this server there wasn't Apache installed and MySQL is behind a firewall and only accessible via java tomcat host.

Finally after some pondering what can be done I came with solution to request to disable mysql database using chmod in /var/lib/mysql/data/, i.e.:

sql-server:~# chmod 0 /var/lib/mysql/databasename

Where databasename is the same as the database is named listable via mysql cli.

After doing it that way with no need to restart MySQL server database stopped to appear in show databases; and client confirmed that disabled database is no longer needed so we proceeded dropping it.

Hope this little article will help someone out there. Cheers :

Tracking I/O hard disk server bottlenecks with iostat on GNU / Linux and FreeBSD

Tuesday, March 27th, 2012

Hard disk overhead tracking on Linux and FreeBSD with iostat

I've earlier wrote an article How to find which processes are causing hard disk i/o overhead on Linux there I explained very rawly few tools which can be used to benchmark hard disk read / write operations. My prior article accent was on iotop and dstat and it just mentioned of iostat. Therefore I've wrote this short article in attempt to explain a bit more thoroughfully on how iostat can be used to track problems with excessive server I/O read/writes.

Here is the command man page description;
iostatReport Central Processing Unit (CPU) statistics and input/output statistics for devices, partitions and network filesystems

I will further proceed with few words on how iostat can be installed on various Linux distros, then point at few most common scenarious of use and a short explanation on the meaning of each of the command outputs.

1. Installing iostat on Linux

iostat is a swiss army knife of finding a server hard disk bottlenecks. Though it is a must have tool in the admin outfut, most of Linux distributions will not have iostat installed by default.
To have it on your server, you will need to install sysstat package:

a) On Debian / Ubuntu and other Debian GNU / Linux derivatives to install sysstat:

debian:~# apt-get --yes install sysstat

b) On Fedora, CentOS, RHEL etc. install is with yum:

[root@centos ~]# yum -y install sysstat

c) On Slackware Linux sysstat package which contains iostat is installed by default. 

d) In FreeBSD, there is no need for installation of any external package as iostat is part of the BSD world (bundle commands).
I should mention bsd iostat and Linux's iostat commands are not the same and hence there use to track down hard disk bottlenecks differs a bit, however the general logic of use is very similar as with most tools in BSD and Linux.

2. Checking a server hard disk for i/o disk bottlenecks on G* / Linux

Once having the sysstat installed on G* / Linux systems, the iostat command will be added in /usr/bin/iostat
a) To check what is the hard disk read writes per second (in megabytes) use:

debian:~# /usr/bin/iostat -m
Linux 2.6.32-5-amd64 (debian) 03/27/2012 _x86_64_ (8 CPU)
avg-cpu: %user %nice %system %iowait %steal %idle
15.34 0.36 2.76 2.66 0.00 78.88
Device: tps MB_read/s MB_wrtn/s MB_read MB_wrtn
sda 63.89 0.48 8.20 6730223 115541235
sdb 64.12 0.44 8.23 6244683 116039483
md0 2118.70 0.22 8.19 3041643 115528074

In the above output the server, where I issue the command is using sda and sdb configured in software RAID 1 array visible in the output as (md0)

The output of iostat should already be easily to read, for anyone who didn't used the tool here is a few lines explanation of the columns:

The %user 15.34 meaning is that 15.34 out of 100% possible i/o load is generad by system level read/write operations.
%nice – >Show the percentage of CPU utilization that occurred while executing at the user level with nice priority.
%iowait – just like the top command idle it shows the idle time when the system didn't have an outstanding disk I/O requests.
%steal – show percentage in time spent in time wait of CPU or virtual CPUs to service another virtual processor (high numbers of disk is sure sign for i/o problem).
%idle – almost the same as meaning to %iowait
tps – HDD transactions per second
MB_read/s (column) – shows the actual Disk reads in Mbytes at the time of issuing iostat
MB_wrtn/s – displays the writes p/s at the time of iostat invocation
MB_read – shows the hard disk read operations in megabytes, since the server boot 'till moment of invocation of iostat
MB_wrtn – gives the number of Megabytes written on HDD since the last server boot filesystem mount

The reason why the Read / Write values for sda and sdb are similar in this example output is because my disks are configured in software RAID1 (mirror)

The above iostat output reveals in my specific case the server is experiencing mostly Disk writes (observable in the high MB_wrtn/s 8.19 md0 in the above sample output).

It also reveals, the I/O reads experienced on that server hard disk are mostly generated as a system (user level load) – see (%user 15.34 and md0 2118.70).

For all those not familiar with system also called user / level load, this is all kind of load which is generated by running programs on the server – (any kind of load not generated by the Linux kernel or loaded kernel modules).

b) To periodically keep an eye on HDD i/o operations with iostat, there are two ways:

– Use watch in conjunction with iostat;

[root@centos ~]# watch "/usr/bin/iostat -m"
Every 2.0s: iostat -m Tue Mar 27 11:00:30 2012
Linux 2.6.32-5-amd64 (centos) 03/27/2012 _x86_64_ (8 CPU)
avg-cpu: %user %nice %system %iowait %steal %idle
15.34 0.36 2.76 2.66 0.00 78.88
Device: tps MB_read/s MB_wrtn/s MB_read MB_wrtn
sda 63.89 0.48 8.20 6730255 115574152
sdb 64.12 0.44 8.23 6244718 116072400
md0 2118.94 0.22 8.20 3041710 115560990
Device: tps MB_read/s MB_wrtn/s MB_read MB_wrtn
sda 55.00 0.01 25.75 0 51
sdb 52.50 0.00 24.75 0 49
md0 34661.00 0.01 135.38 0 270

Even though watch use and -d might appear like identical, they're not watch does refresh the screen, executing instruction similar to the clear command which clears screen on every 2 seconds, so the output looks like the top command refresh, while passing the -d 2 will output the iostat command output on every 2 secs in a row so all the data is visualized on the screen. Hence -d 2 in cases, where more thorough debug is necessery is better. However for a quick routine view watch + iostat is great too.

c) Outputting extra information for HDD input/output operations;

root@debian:~# iostat -x
Linux 2.6.32-5-amd64 (debian) 03/27/2012 _x86_64_ (8 CPU)
avg-cpu: %user %nice %system %iowait %steal %idle
15.34 0.36 2.76 2.66 0.00 78.88
Device: rrqm/s wrqm/s r/s w/s rsec/s wsec/s avgrq-sz avgqu-sz await svctm %util
sda 4.22 2047.33 12.01 51.88 977.44 16785.96 278.03 0.28 4.35 3.87 24.72
sdb 3.80 2047.61 11.97 52.15 906.93 16858.32 277.05 0.03 5.25 3.87 24.84
md0 0.00 0.00 20.72 2098.28 441.75 16784.05 8.13 0.00 0.00 0.00 0.00

This command will output extended useful Hard Disk info like;
r/s – number of read requests issued per second
w/s – number of write requests issued per second
rsec/s – numbers of sector reads per second
b>wsec/s – number of sectors wrote per second
etc. etc.

Most of ppl will never need to use this, but it is good to know it exists.

3. Tracking read / write (i/o) hard disk bottlenecks on FreeBSD

BSD's iostat is a bit different in terms of output and arguments.

a) Here is most basic use:

freebsd# /usr/sbin/iostat
tty ad0 cpu
tin tout KB/t tps MB/s us ni sy in id
1 561 45.18 44 1.95 14 0 5 0 82

b) Periodic watch of hdd i/o operations;

freebsd# iostat -c 10
tty ad0 cpu
tin tout KB/t tps MB/s us ni sy in id
1 562 45.19 44 1.95 14 0 5 0 82
0 307 51.96 113 5.73 44 0 24 0 32
0 234 58.12 98 5.56 16 0 7 0 77
0 43 0.00 0 0.00 1 0 0 0 99
0 485 0.00 0 0.00 2 0 0 0 98
0 43 0.00 0 0.00 0 0 1 0 99
0 43 0.00 0 0.00 0 0 0 0 100
...

As you see in the output, there is information like in the columns tty, tin, tout which is a bit hard to comprehend.
Thanksfully the tool has an option to print out only more essential i/o information:

freebsd# iostat -d -c 10
ad0
KB/t tps MB/s
45.19 44 1.95
58.12 97 5.52
54.81 108 5.78
0.00 0 0.00
0.00 0 0.00
0.00 0 0.00
20.48 25 0.50

The output info is quite self-explanatory.

Displaying a number of iostat values for hard disk reads can be also achieved by omitting -c option with:

freebsd# iostat -d 1 10
...

Tracking a specific hard disk partiotion with iostat is done with:

freebsd# iostat -n /dev/ad0s1a
tty cpu
tin tout us ni sy in id
1 577 14 0 5 0 81
c) Getting Hard disk read/write information with gstat

gstat is a FreeBSD tool to print statistics for GEOM disks. Its default behaviour is to refresh the screen in a similar fashion like top command, so its great for people who would like to periodically check all attached system hard disk and storage devices:

freebsd# gstat
dT: 1.002s w: 1.000s
L(q) ops/s r/s kBps ms/r w/s kBps ms/w %busy Name
0 10 0 0 0.0 10 260 2.6 15.6| ad0
0 10 0 0 0.0 10 260 2.6 11.4| ad0s1
0 10 0 0 0.0 10 260 2.8 12.5| ad0s1a
0 0 0 0 0.0 0 0 0.0 20.0| ad0s1b
0 0 0 0 0.0 0 0 0.0 0.0| ad0s1c
0 0 0 0 0.0 0 0 0.0 0.0| ad0s1d
0 0 0 0 0.0 0 0 0.0 0.0| ad0s1e
0 0 0 0 0.0 0 0 0.0 0.0| acd0

It even has colors if your tty supports colors 🙂

Another useful tool in debugging the culprit of excessive hdd I/O operations is procstat command:

Here is a sample procstat run to track (httpd) one of my processes imposing i/o hdd load:

freebsd# procstat -f 50404
PID COMM FD T V FLAGS REF OFFSET PRO NAME
50404 httpd cwd v d -------- - - - /
50404 httpd root v d -------- - - - /
50404 httpd 0 v c r------- 56 0 - -
50404 httpd 1 v c -w------ 56 0 - -
50404 httpd 2 v r -wa----- 56 75581 - /var/log/httpd-error.log
50404 httpd 3 s - rw------ 105 0 TCP ::.80 ::.0
50404 httpd 4 p - rw---n-- 56 0 - -
50404 httpd 5 p - rw------ 56 0 - -
50404 httpd 6 v r -wa----- 56 25161132 - /var/log/httpd-access.log
50404 httpd 7 v r rw------ 56 0 - /tmp/apr8QUOUW
50404 httpd 8 v r -w------ 56 0 - /var/run/accept.lock.49588
50404 httpd 9 v r -w------ 1 0 - /var/run/accept.lock.49588
50404 httpd 10 v r -w------ 1 0 - /tmp/apr8QUOUW
50404 httpd 11 ? - -------- 2 0 - -

Btw fstat is sometimes helpful in identifying the number of open files and trying to estimate which ones are putting the hdd load.
Hope this info helps someone. If you know better ways to track hdd excessive loads on Linux / BSD pls share 'em pls.
 

Enabling talkd (Console Chat) between logged in users on FreeBSD and other BSDs

Sunday, June 10th, 2012

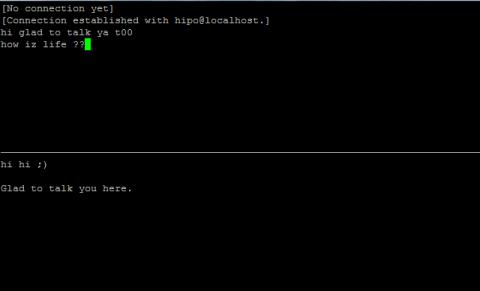
Talk between two useres on FreeBSD 7.2 screenshot, console peer to peer interactive talk program UNIX, Linux, BSD

Those who are in familiar with older UNIXes, UNIX BSD derivatives and GNU Linux should certainly remember the times, when we hackers used to talk to each other using talk service.

Those who don't know what talk command is it is a simple console / ssh utility to talk to another logged in users.

Talk is very similar to write and mesg one liner messasing utilities available for *nixes, the difference is it is intendted to provide interactive chat between the two logged in users. People who came to know UNIX or free software in older times most likely don't know talk, however I still remember how precious this tool was for communication back in the day.

I believe still it can be useful so I dediced to install ot on one FreeBSD host.

In order to have the talk service running on BSD it is necessery to have /usr/libexec/ntalkd installed on the system this however is installed by default with standard BSD OS installs, so no need for any external ports install to run it.

talk doesn't have it's own init script to start is not written to run as it own service but in order to run it is is necessery to enable it via inetd

Enabling it is done by;;;

1 — Editting /etc/inetd.conf

Inside the conf the line::

#ntalk dgram udp wait tty:tty /usr/libexec/ntalkd ntalkd

should be uncommented e.g, become ;;;

ntalk dgram udp wait tty:tty /usr/libexec/ntalkd ntalkd

2 — Restart inetd

freebsd# /etc/rc.d/inetd restart
Stopping inetd.
Starting inetd.

talk is planned to be used for peer to peer conversations over SSH so in a way it is the GRANDFATHER 🙂 of IRC, ICQ and Skype;;;

Here is an example on how talk is used ,, Let's say there are three logged in users

pcfreak# w
12:39PM up 3 days, 16:25, 3 users, load averages: 1.12, 0.91, 0.71
USER TTY FROM LOGIN@ IDLE WHAT
testuser p0 192.168.0.7 10:50AM - bash
hipo p3 192.168.0.8 12:23PM - w
root p4 :ttyp2:S.0 12:24PM - vim /usr/local/www/dat

I'm logged in with my username hipo and I would like to talk to testuser ;;;;

pcfreak% tty
/dev/ttyp3

You see I'm logged in on /dev/ttyp3 (this is the specific naming on BSDs) on Linux equivalent is /dev/tty3So to talk the other user testuser;;;;;-

$ talk testuser ttyp0
[No connection yet]
[Waiting for your party to respond]

The testuser logged in via SSH will then get a message ||;

Message from Talk_Daemon@pcfreak at 12:44 on 2012/06/10 ...
talk: connection requested by hipo@localhost
talk: respond with: talk hipo@localhost

To enter a talk session then the logged in testuser has to type:

$ talk hipo@localhost