Posts Tagged ‘ports’

How to count number of ESTABLISHED state TCP connections to a Windows server

Wednesday, March 13th, 2024

count-netstat-established-connections-on-windows-server-howto-windows-logo-debug-network-issues-windows

Even if you have the background of a Linux system administrator, sooner or later you will have have to deal with some Windows hosts, thus i'll blog in this article shortly on how the established TCP if it happens you will have to administarte a Windows hosts or help a windows sysadmin noobie 🙂

In Linux it is pretty easy to check the number of established conenctions, because of the wonderful command wc (word count). with a simple command like:
 

$ netstat -etna |wc -l


Then you will get the number of active TCP connections to the machine and based on that you can get an idea on how busy the server is.

But what if you have to deal with lets say a Microsoft Windows 2012 /2019 / 2020 or 2022 Server, assuming you logged in as Administrator and you see the machine is quite loaded and runs multiple Native Windows Administrator common services such as IIS / Active directory Failover Clustering, Proxy server etc.
How can you identify the established number of connections via a simple command in cmd.exe?

1.Count ESTABLISHED TCP connections from Windows Command Line

Here is the answer, simply use netstat native windows command and combine it with find, like that and use the /i (ignores the case of characters when searching the string) /c (count lines containing the string) options

C:\Windows\system32>netstat -p TCP -n|  find /i "ESTABLISHED" /c
1268

Voila, here are number of established connections, only 1268 that is relatively low.
However if you manage Windows servers, and you get some kind of hang ups as part of the monitoring, it is a good idea to setup a script based on this simple command for at least Windows Task Scheduler (the equivallent of Linux's crond service) to log for Peaks in Established connections to see whether Server crashes are not related to High Rise in established connections.
Even better if company uses Zabbix / Nagios, OpenNMS or other  old legacy monitoring stuff like Joschyd even as of today 2024 used in some big of the TOP IT companies such as SAP (they were still using it about 4 years ago for their SAP HANA Cloud), you can set the script to run and do a Monitoring template or Alerting rules to draw you graphs and Trigger Alerts if your connections hits a peak, then you at least might know your Windows server is under a "Hackers" Denial of Service attack or there is something happening on the network, like Cisco Network Infrastructure Switch flappings or whatever.

Perhaps an example script you can use if you decide to implement the little nestat established connection checks Monitoring in Zabbix is the one i've writen about in the previous article "Calculate established connection from IP address with shell script and log to zabbix graphic".

2. Few Useful netstat options for the Windows system admin
 

C:\Windows\System32> netstat -bona


netstat-useful-arguments-for-the-windows-system-administrator

Cmd.exe will lists executable files, local and external IP addresses and ports, and the state in list form. You immediately see which programs have created connections or are listening so that you can find offenders quickly.

b – displays the executable involved in  creating the connection.
o – displays the owning process ID.
n – displays address and port numbers.
a – displays all connections and listening ports.

As you can see in the screenshot, by using netstat -bona you get which process has binded to which local address and the Process ID PID of it, that is pretty useful in debugging stuff.

3. Use a Third Party GUI tool to debug more interactively connection issues

If you need to keep an eye in interactive mode, sometimes if there are issues CurrPorts tool can be of a great help

currports-windows-network-connections-diagnosis-cports

CurrPorts Tool own Description

CurrPorts is network monitoring software that displays the list of all currently opened TCP/IP and UDP ports on your local computer. For each port in the list, information about the process that opened the port is also displayed, including the process name, full path of the process, version information of the process (product name, file description, and so on), the time that the process was created, and the user that created it.
In addition, CurrPorts allows you to close unwanted TCP connections, kill the process that opened the ports, and save the TCP/UDP ports information to HTML file , XML file, or to tab-delimited text file.
CurrPorts also automatically mark with pink color suspicious TCP/UDP ports owned by unidentified applications (Applications without version information and icons).

Sum it up

What we learned is how to calculate number of established TCP connections from command line, useful for scripting, how you can use netstat to display the process ID and Process name that relates to a used Local / Remote TCP connections, and how eventually you can use this to connect it to some monitoring tool to periodically report High Peaks with TCP established connections (usually an indicator of servere system issues).
 

Create Haproxy Loadbalancer Access Control Lists and forward incoming frontend traffics based on simple logic

Friday, February 16th, 2024

Create-haproxy-loadbalancer-access-control-list-and-forward-frontend-traffic-based-on-simple-logic-acls-logo

Haproxy Load Balancers could do pretty much to load balance traffic between application servers. The most straight forward way to use is to balance traffic for incoming Frontends towards a Backend configuration with predefined Application machines and ports to send the traffic, where one can be the leading one and others be set as backup or we can alternatively send the traffic towards a number of machines incoming to a Frontend port bind IP listener and number of backend machine.

Besides this the more interesting capabilities of Haproxy comes with using Access Control Lists (ACLs) to forward Incoming Frontend (FT) traffic towards specific backends and ports based on logic, power ACLs gives to Haproxy to do a sophisticated load balancing are enormous. 
In this post I'll give you a very simple example on how you can save some time, if you have already a present Frontend listening to a Range of TCP Ports and it happens you want to redirect some of the traffic towards a spefic predefined Backend.

This is not the best way to it as Access Control Lists will put some extra efforts on the server CPU, but as today machines are quite powerful, it doesn't really matter. By using a simple ACLs as given in below example, one can save much of a time of writting multiple frontends for a complete sequential port range, if lets say only two of the ports in the port range and distinguish and redirect traffic incoming to Haproxy frontend listener in the port range of 61000-61230 towards a certain Ports that are supposed to go to a Common Backends to a separate ones, lets say ports 61115 and 61215.

Here is a short description on the overall screnarios. We have an haproxy with 3 VIP (Virtual Private IPs) with a Single Frontend with 3 binded IPs and 3 Backends, there is a configured ACL rule to redirect traffic for certain ports, the overall Load Balancing config is like so:

Frontend (ft):

ft_PROD:
listen IPs:

192.168.0.77
192.168.0.83
192.168.0.78

On TCP port range: 61000-61299

Backends (bk): 

bk_PROD_ROUNDROBIN
bk_APP1
bk_APP2


Config Access Control Liststo seperate incoming haproxy traffic for CUSTOM_APP1 and CUSTOM_APP2


By default send all incoming FT traffic to: bk_PROD_ROUNDROBIN

With exception for frontend configured ports on:
APP1 port 61115 
APP2 port 61215

If custom APP1 send to bk:
RULE1
If custom APP2 send to bk:
RULE2

Config on frontends traffic send operation: 

bk_PROD_ROUNDROBIN (roundrobin) traffic send to App machines all in parallel
traffic routing mode (roundrobin)
Appl1
Appl2
Appl3
Appl4

bk_APP1 and bk_APP2

traffic routing mode: (balance source)
Appl1 default serving host

If configured check port 61888, 61887 is down, traffic will be resend to configured pre-configured backup hosts: 

Appl2
Appl3
Appl4


/etc/haproxy/haproxy.cfg that does what is described with ACL LB capabilities looks like so:

#———————————————————————
# Global settings
#———————————————————————
global
    log         127.0.0.1 local2

    chroot      /var/lib/haproxy
    pidfile     /var/run/haproxy.pid
    maxconn     4000
    user        haproxy
    group       haproxy
    daemon

    # turn on stats unix socket
    stats socket /var/lib/haproxy/stats

#———————————————————————
# common defaults that all the 'listen' and 'backend' sections will
# use if not designated in their block
#———————————————————————
defaults
    mode                    tcp
    log                     global
    option                  tcplog
    #option                  dontlognull
    #option http-server-close
    #option forwardfor       except 127.0.0.0/8
    option                  redispatch
    retries                 7
    #timeout http-request    10s
    timeout queue           10m
    timeout connect         30s
    timeout client          20m
    timeout server          10m
    #timeout http-keep-alive 10s
    timeout check           30s
    maxconn                 3000


#———————————————————————
# Synchronize server entries in sticky tables
#———————————————————————

peers hapeers
    peer haproxy1-fqdn.com 192.168.0.58:8388
    peer haproxy2-fqdn.com 192.168.0.79:8388


#———————————————————————
# HAProxy Monitoring Config
#———————————————————————
listen stats 192.168.0.77:8080                #Haproxy Monitoring run on port 8080
    mode http
    option httplog
    option http-server-close
    stats enable
    stats show-legends
    stats refresh 5s
    stats uri /stats                            #URL for HAProxy monitoring
    stats realm Haproxy\ Statistics
    stats auth hauser:secretpass4321         #User and Password for login to the monitoring dashboard
    stats admin if TRUE
    #default_backend bk_Prod1         #This is optionally for monitoring backend
#———————————————————————
# HAProxy Monitoring Config
#———————————————————————
#listen stats 192.168.0.83:8080                #Haproxy Monitoring run on port 8080
#    mode http
#    option httplog
#    option http-server-close
#    stats enable
#    stats show-legends
#    stats refresh 5s
#    stats uri /stats                            #URL for HAProxy monitoring
#    stats realm Haproxy\ Statistics
#    stats auth hauser:secretpass321          #User and Password for login to the monitoring dashboard
#    stats admin if TRUE
#    #default_backend bk_Prod1           #This is optionally for monitoring backend

#———————————————————————
# HAProxy Monitoring Config
#———————————————————————
# listen stats 192.168.0.78:8080                #Haproxy Monitoring run on port 8080
#    mode http
#    option httplog
#    option http-server-close
#    stats enable
#    stats show-legends
#    stats refresh 5s
#    stats uri /stats                            #URL for HAProxy monitoring
#    stats realm Haproxy\ Statistics
#    stats auth hauser:secretpass123          #User and Password for login to the monitoring dashboard
#    stats admin if TRUE
#    #default_backend bk_DKV_PROD_WLPFO          #This is optionally for monitoring backend


#———————————————————————
# frontend which proxys to the backends
#———————————————————————
frontend ft_PROD
    mode tcp
    bind 192.168.0.77:61000-61299
        bind 192.168.0.83:51000-51300
        bind 192.168.0.78:51000-62300
    option tcplog
        # (4) Peer Sync: a sticky session is a session maintained by persistence
        stick-table type ip size 1m peers hapeers expire 60m
# Commented for change CHG0292890
#   stick on src
    log-format %ci:%cp\ [%t]\ %ft\ %b/%s\ %Tw/%Tc/%Tt\ %B\ %ts\ %ac/%fc/%bc/%sc/%rc\ %sq/%bq
        acl RULE1 dst_port 61115
        acl RULE2 dst_port 61215
        use_backend APP1 if app1
        use_backend APP2 if app2
    default_backend bk_PROD_ROUNDROBIN


#———————————————————————
# round robin balancing between the various backends
#———————————————————————
backend bk_PROD_ROUNDROBIN
    mode tcp
    # (0) Load Balancing Method.
    balance roundrobin
    # (4) Peer Sync: a sticky session is a session maintained by persistence
    stick-table type ip size 1m peers hapeers expire 60m
    # (5) Server List
    # (5.1) Backend
    server appl1 10.33.0.50 check port 31232
    server appl2 10.33.0.51 check port 31232 
    server appl2 10.45.0.78 check port 31232 
    server appl3 10.45.0.79 check port 31232 

#———————————————————————
# source balancing for the GUI
#———————————————————————
backend bk_APP2
    mode tcp
    # (0) Load Balancing Method.
    balance source
    # (4) Peer Sync: a sticky session is a session maintained by persistence
    stick-table type ip size 1m peers hapeers expire 60m
        stick on src
    # (5) Server List
    # (5.1) Backend
    server appl1 10.33.0.50 check port 55232
    server appl2 10.32.0.51 check port 55232 backup
    server appl3 10.45.0.78 check port 55232 backup
    server appl4 10.45.0.79 check port 55232 backup

#———————————————————————
# source balancing for the OLW
#———————————————————————
backend bk_APP1
    mode tcp
    # (0) Load Balancing Method.
    balance source
    # (4) Peer Sync: a sticky session is a session maintained by persistence
    stick-table type ip size 1m peers hapeers expire 60m
        stick on src
    # (5) Server List
    # (5.1) Backend
    server appl1 10.33.0.50 check port 53119
    server appl2 10.32.0.51 check port 53119 backup
    server appl3 10.45.0.78 check port 53119 backup
    server appl4 10.45.0.79 check port 53119 backup


You can also check and download the haproxy.cfg here.
Enjjoy !

Howto Pass SSH traffic through a Secured Corporate Proxy server with corkscrew, using sshd as a standalone proxy service with no proxy installed on remote Linux server or VPS

Tuesday, November 19th, 2019

howto pass ssh traffic through proxy to remote server use remote machine as a proxy for connecting to the Internet

Working in the big bad corporate world (being employed in  any of the Fortune 500) companies, especially in an IT delivery company is a nasty thing in terms of User Personal Data Privacy because usually when employeed in any of a corporation, the company ships you with a personal Computer with some kind of pre-installed OS (most often this is Windows) and the computer is not a standalone one but joined in Active Directory (AD) belonging to Windows Domain and centrally administered by whoever.

As part of the default deplyed configuration in this pre-installed OS and software is that part or all your network traffic and files is being monitored in some kind of manner as your pre-installed Windows or Linux notebook given by the Corporation is having a set of standard software running in the background, and even though you have Windows Administrator there are many things you have zero control or even if you have changed it once the Domain Policy is triggered your custom made changes / Installed Programs that happen to be against the company policy are being automatically deleted, any registry changes made are being rewinded etc. Sometimes even by trying to manually clean up your PC from the corporate crapware,  you might breaks access to the corporate DMZ firewalled network. A common way to secure their employee PC data large companies have a Network seperation, your PC when not connected to the Corporate VPN is having a certain IP configuration and once connected to the Demilitarized Zone VPN those configuration changes and the PC have access to internal company infrastructure servers / router / switches / firewalls / SANs etc. Access to corporate Infrastructure is handled via crypted VPN clinet such as Cisco AnyConnect Secure Mobility Client which is perhaps one of the most used ones out there.

Part of the common software installed to Monitor your PC for threats / viruses / trojans among which is MCafee / EMET (Enhandced Mitigation Experience Toolkit) the PC is often prebundled with some kind of anti-malware (crapware) :). But the tip of the iceberg on user surveillance where most of surveillance happens is the default installed proxy on the PC which usually does keep track of all your remote accessed HTTP Website URLs accessed in plain text – traffic flowing on Port 80 and crypted one on standard (SSL) Port 443. This Web Traffic is handled by the Central Corporate proxy that is being deployed via some kind of Domain policy, every time the Computer joins the Windows domain. 

This of course is a terrible thing for your Browsing security and together with the good security practice to run your browser in Incognito mode, which makes all your browsing activity such as access URLs History or Saved Cookies data to be cleared up on a Browser close it is important to make sure you run your own personal traffic via a separate browser which you will use only for your own concern browsing such as Accessing your Bank Money Accounts to check your Monthly Sallary / Purchase things online via Amazon.com / Ebay.com, whether all of the rest traffic company related is trafficed via the default set corporate central proxy.
This is relatively easy sometimes in companies, where security is not of a top concern but in corporations with tightened security accessing remote proxy, or accessing even common daily news and Public Email websites or social media sites  Gmail.com / Twitter / Youtube will be filtered so the only way to reach them will be via some kind of Proxy and often this proxy is the only way out to the Free world from the corporate jail.

Here is where the good old SSH comes as a saving grace as it turns out SSH traffic could be trafficed over a proxy. In below article I will give you a short insight on how Proxy through SSH could be achieved to Secure your dailty web traffic and use SSH to reach your own server on the Internet as well as how you can copy securely data via SSH through corporate Proxy. 
 

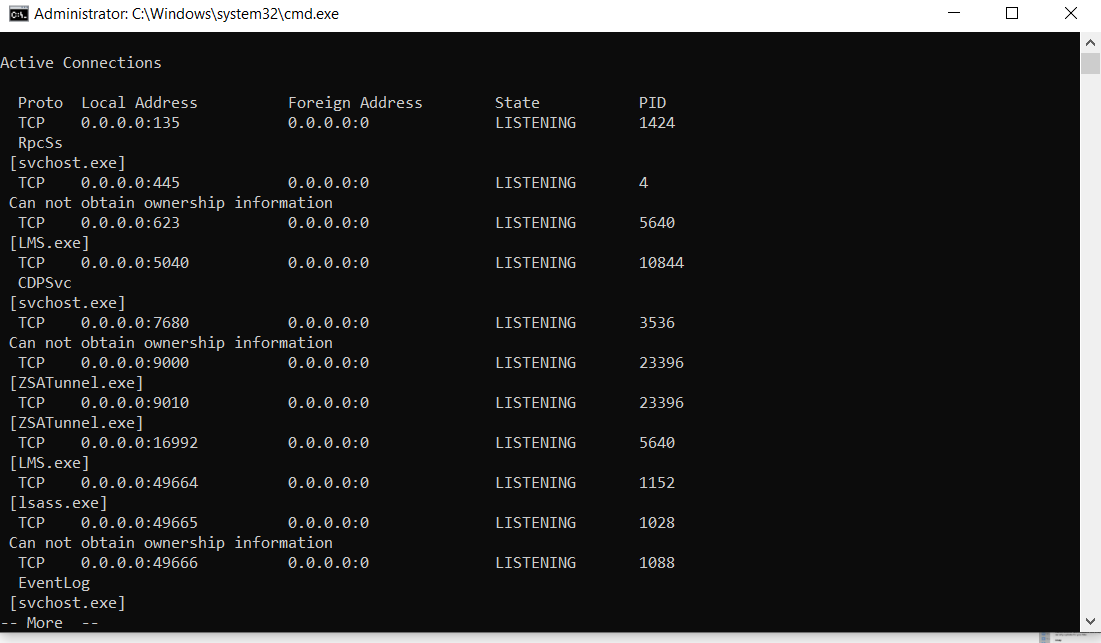
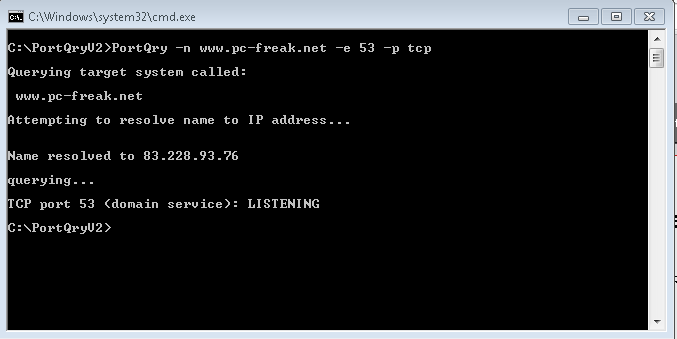
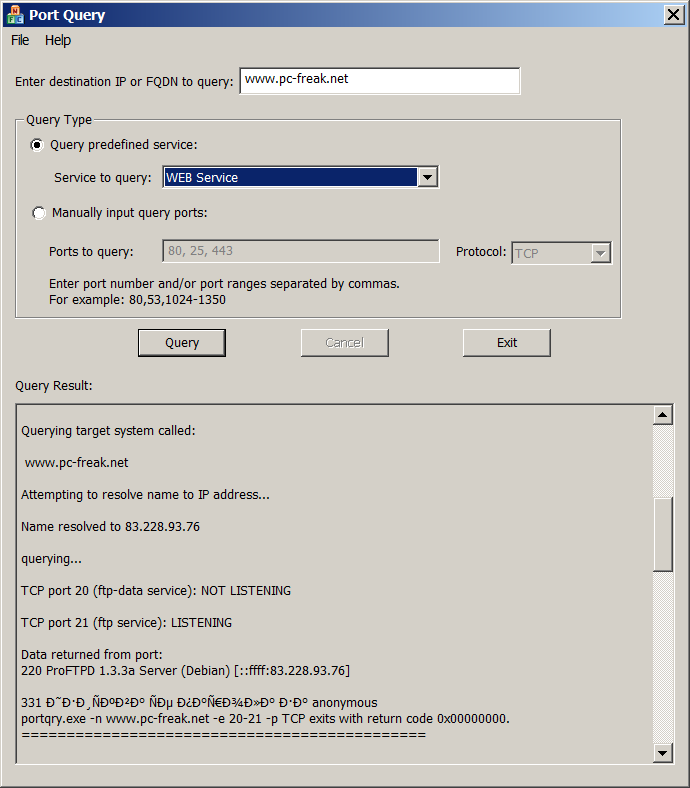
1. How to view your corporate used (default) proxy / Check Proxy.pac file definitions


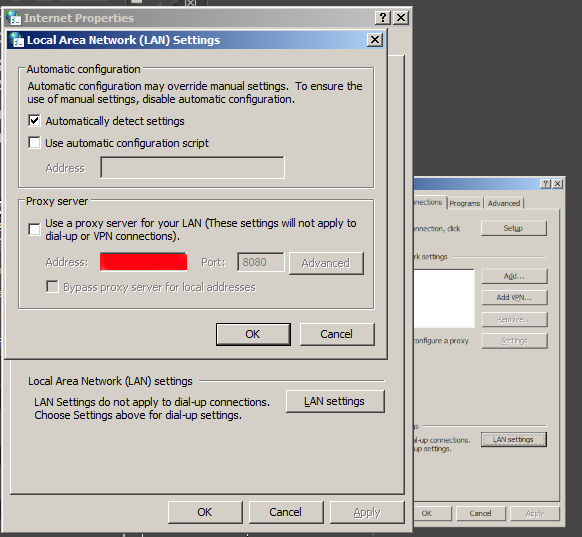
To get an idea what is the used proxy on your Corporate PC (as most corporate employee given notebooks are running some kind of M$ Windows)  you can go to:

Windows Control Panel -> Internet Options -> Connections -> Lan Settings


internet-properties-microsoft-windows-screenshot

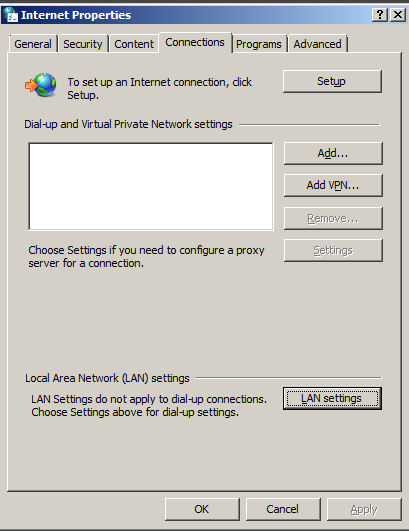
Under the field Proxy server (check out the Proxy configured Address and Port number )

local-area-network-lan-settings-screenshot-windows-1
 

Having that as browsers venerate the so-called Proxy.pac file, to be rawly aware on some general Company Proxy configured definitions you can access in a browser the proxy itself fething the proxy.pac file for example.


http://your-corporate-firewall-rpoxy-url:8080/proxy.pac


This is helpful as some companies Proxies have some proxy rules that reveal some things about its Internet architecture and even some have some badly configured proxy.pac files which could be used to fool the proxy under some circumstances 🙂
 

2. Few of the reasons corporations proxy all their employee's work PC web traffic


The corporate proxying of traffic has a number of goals, some of which are good hearted and others are for mostly spying on the users.


1. Protect Corporate Employees from malicious Viruses / Trojans Horses / Malware / Badware / Whatever ware – EXCELLENT
2. Prevent users from acessing a set of sources that due to the corporate policy are considered harmful (e.g. certain addresses 
of information or disinformation of competitors, any Internet source that might preach against the corporation, hacking ralated websites etc.) – NOT GOOD (for the employee / user) and GOOD for the company
3.Spy on the users activity and be able to have evidence against the employee in case he decided to do anything harmful to the company evidences from proxy could even later be used in court if some kind of corpoate infringment occurs due to misbehave of the employee. – PERFECT FOR COMPANY and Complete breach of User privacy and IMHO totally against European Union privacy legislation such as GDRP
4. In companies that are into the field of Aritificial Intelligence / Users behavior could even be used to advance Self-learning bots and mechanisms – NASTY ! YAECKES


3. Run SSH Socks proxy to remote SSHd server running on common SSL 443 port


Luckily sysadmins who were ordered the big bosses to sniff on your Web behaviour and preferences could be outsmarted with some hacks.

To protect your Browsing behaviours and Secure your privacy perhaps the best option is to use the Old but gold practice o Securing your Networkf traffic using SSH Over Proxy and SSH Dynamic tunnel as a Proxy as explained in my previous article here.

how-to-use-sshd-server-as-a-proxy-without-a-real-proxy-ssh-socks5_proxy_linux
 

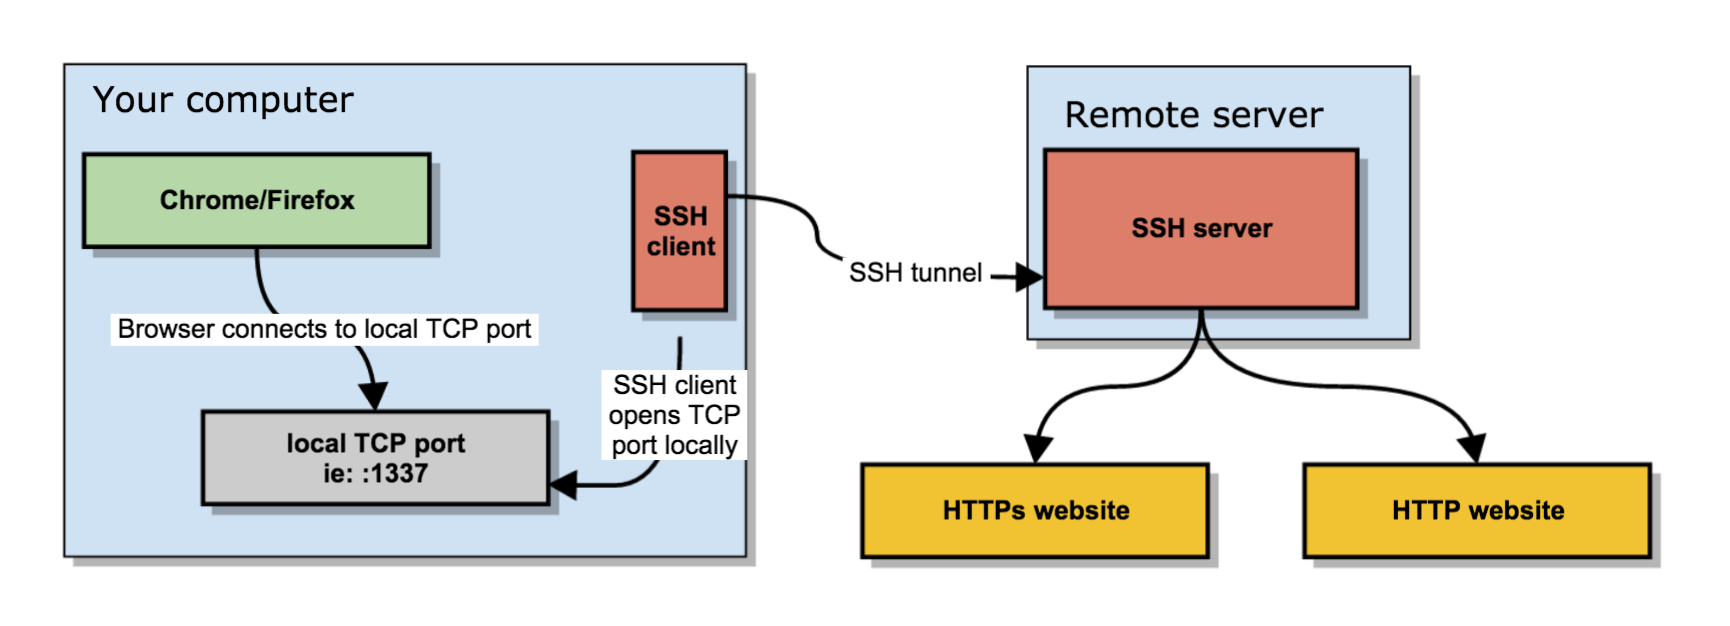
In short the quest way to have your free of charge SOCKS  Remote proxy to your Home based Linux installed OS server / VPN with a Public Internet address is to use ssh as so:


ssh -D 3128 UserName@IP-of-Remote-SSHD-Host -p 443


This will start the SOCKS Proxy tunnel from Corporate Work PC to your Own Home brew server.

For some convenience it is useful to set up an .alias (for cygwin) / linux users in .bashrc file:


alias proxy='ssh -D 3128 UserName@IP-of-Remote-SSHD-Host -p 443';


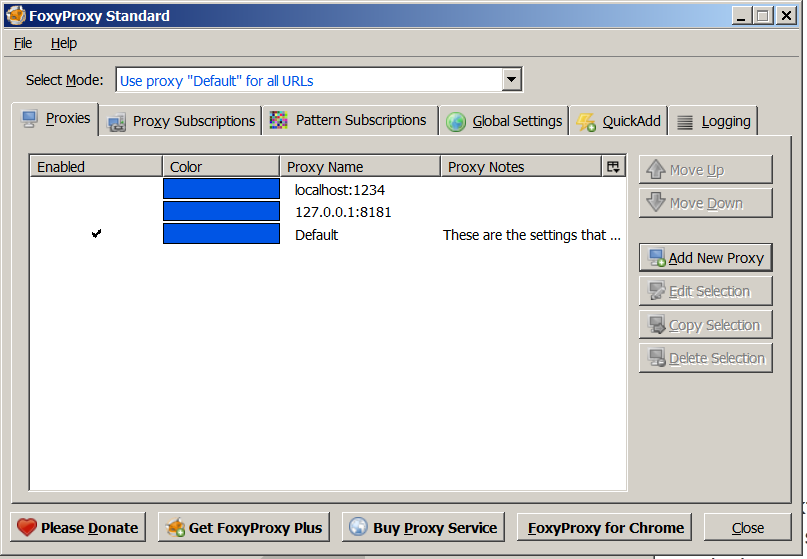
To start using the Proxy from browser, I use a plugin called FoxyProxy in Chrome and Firefox browsers
set-up to connect to localhost – 127.0.0.1:3128 for All Protocols as a SOCKs v5 Proxy.

The sshd Socks proxy can be used for multiple others for example, using it you can also pass on traffic from Mail client such as Thunderbird to your Email server if you're behind a firewall prohibiting access to the common POP3 port 110 or IMAP port TCP 143. 

4. How to access SSH through Proxy using jumphost SSH hop


If you're like me and you have on your Home Linux machine only one Internet address and you have already setupped an SSL enabled service (lets say Webmail) to listen to that Public Internet IP and you don't have the possibility to run another instance of /usr/bin/sshd on port 443 via configuration or manually one time by issuing:


/usr/sbin/sshd -p 443


Then you can use another ssh another Linux server as a jump host to your own home Linux sshd server. This can be done even by purchasing a cheap VPS server for lets say 3 dollars month etc. or even better if you have a friend with another Linux home server, you can ask him to run you sshd on TCP port 443 and add you an ssh account.
Once you have the second Linux machine as JumpHost to reach out to your own machine use:


ssh -J Your-User@Your-jump-host.com:443 hipo@your-home-server.com -v


To easify this a bit long line it is handy to use some kind of alias like:


alias sshhome='ssh -J Your-User@Your-jump-host.com:443 hipo@your-home-server.com -v'


The advantage here is just by issuing this sshd tunnel and keeping it open in a terminal or setting it up as Plink Putty tunnel you have all your Web Traffic Secured
between your Work Corporate PC and your Home Brew Server, keeping the curious eyes of your Company Security Officers from your own Web traffic, hence
separating the corporate privacy from your own personal privacy. Using the just established own SSH Proxy Tunnel to home for your non-work stuff browsing habits
from the corporate systems which are accessed by switching with a button click in FoxyProxy to default proxy settings.
 

5. How to get around paranoid corporate setup where only remote access to Corporate proxy on TCP Port 80 and TCP 443 is available in Browser only


Using straight ssh and to create Proxy will work in most of the cases but it requires SSH access to your remote SSH running server / VPS on TCP Port 22, however under some Fort-Nox like financial involved institutions and companies for the sake of tightened security, it is common that all Outbound TCP Ports are prohibited except TCP Port 80 and SSL 443 as prior said, so what can you do then to get around this badful firewall and access the Internet via your own server Proxy? 
The hack to run SSH server either on tcp port 80 or tcp port 443 on remote Host and use 443 / 80 to acess SSHD should work, but then even for the most paranoid corporations the ones who are PCI Compliant – PCI stands for (Payment Card Industry), e.g. works with Debit and Credit Card data etc, accessing even 80 or 443  ports with something like telnet client or netcat will be impossible. 
Once connected to the corporate VPN,  this 2 two ports firewall exceptions will be only accessible via the Corporate Proxy server defined in a Web Browser (Firefox / IE / Chrome etc.) as prior explained in article.

The remedy here is to use a 3rd party tools such as httptunnel or corkscrew that  are able to TUNNEL SSH TRAFFIC VIA CORPORATE PROXY SERVER and access your own resource out of the DMZ.

Both httptunnel and corkscrew are installable both on most Linux distros or for Windows users via CygWin for those who use MobaXterm.

Just to give you better idea on what corkscrew and (hts) httptunnel does, here is Debian packages descriptions.

# apt-cache show​ corkscrew
" corkscrew is a simple tool to tunnel TCP connections through an HTTP
 proxy supporting the CONNECT method. It reads stdin and writes to
 stdout during the connection, just like netcat.
 .
 It can be used for instance to connect to an SSH server running on
 a remote 443 port through a strict HTTPS proxy.
"


# apt-cache show httptunnel|grep -i description -A 7
Description-en: Tunnels a data stream in HTTP requests
 Creates a bidirectional virtual data stream tunnelled in
 HTTP requests. The requests can be sent via a HTTP proxy
 if so desired.
 .
 This can be useful for users behind restrictive firewalls. If WWW
 access is allowed through a HTTP proxy, it's possible to use
 httptunnel and, say, telnet or PPP to connect to a computer

Description-md5: ed96b7d53407ae311a6c5ef2eb229c3f
Homepage: http://www.nocrew.org/software/httptunnel.html
Tag: implemented-in::c, interface::commandline, interface::daemon,
 network::client, network::server, network::vpn, protocol::http,
 role::program, suite::gnu, use::routing
Section: net
Priority: optional
Filename: pool/main/h/httptunnel/httptunnel_3.3+dfsg-4_amd64.deb

Windows cygwin users can install the tools with:
 

apt-cyg install –yes corkscrew httptunnel


Linux users respectively with:

apt-get install –yes corkscrew httptunnel

or 

yum install -y corkscrew httptunnel


You will then need to have the following configuration in your user home directory $HOME/.ssh/config file
 

Host host-addrs-of-remote-home-ssh-server.com
ProxyCommand /usr/bin/corkscrew your-corporate-firewall-rpoxy-url 8080 %h %p


howto-transfer-ssh-traffic-over-proxy

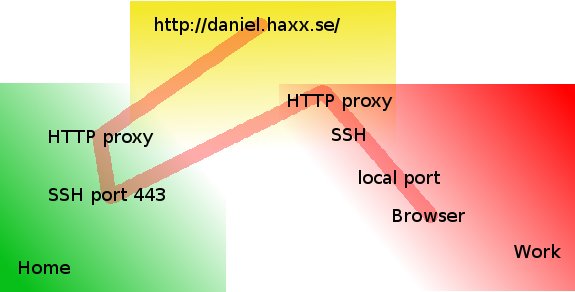
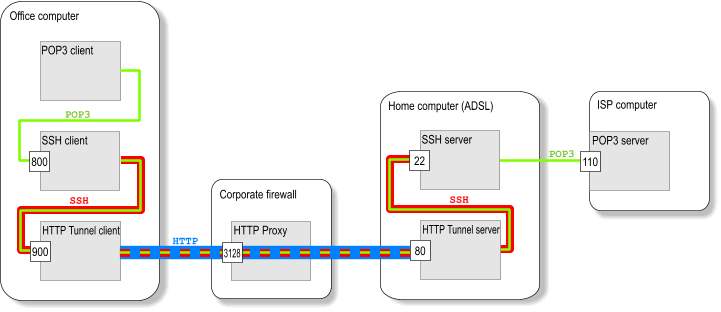
Picture Copyright by Daniel Haxx

The best picture on how ssh traffic is proxied is the one found on Daniel Haxx's website which is a great quick tutorial which originally helped to get the idea of how corkscrew works in proxying traffic I warmly recommend you take a quick look at his SSH Through or over Proxy article.

Host-addrs-of-remote-home-ssh-server.com could be also and IP if you don't have your own domain name in case if using via some cheap VPN Linux server with SSH, or alternatively
if you don't want to spend money on buying domain for SSH server (assuming you don't have such yet) you can use Dyn DNS or NoIP.

Another thing is to setup the proper http_proxy / https_proxy / ftp_proxy variable exports in $HOME/.bashrc in my setup I have the following:
 

export ftp_proxy="http://your-corporate-firewall-rpoxy-url:8080"
export https_proxy="https://your-corporate-firewall-rpoxy-url:8080"
export http_proxy="http://your-corporate-firewall-rpoxy-url:8080"
export HTTP_PROXY="http://your-corporate-firewall-rpoxy-url:8080"
export HTTPS_PROXY="http://your-corporate-firewall-rpoxy-url:8080"


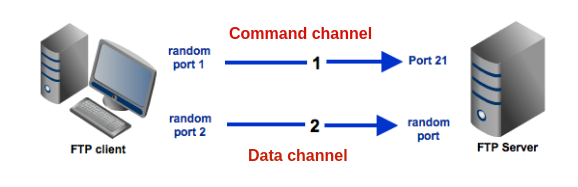
6. How to Transfer Files / Data via SSH Protocol through  Proxy with SCP and SFTP


Next logical question is how to Transfer your own personal encrypted files (that contains no corporate sensitive information) between your Work laptop and home brew Linux ssh server or cheap VPN.

It took me quite a lot of try-outs until finally I got it how Secure Copy (scp) command can be used toto transfer files between my Work Computer and my Home brew server using JumpHost, here is how:
 

scp -o 'ProxyJump Username@Jumpt-Host-or-IP.com:443' ~/file-or-files-to-copy* Username@home-ssh-server.com:/path/where/to/copy/files


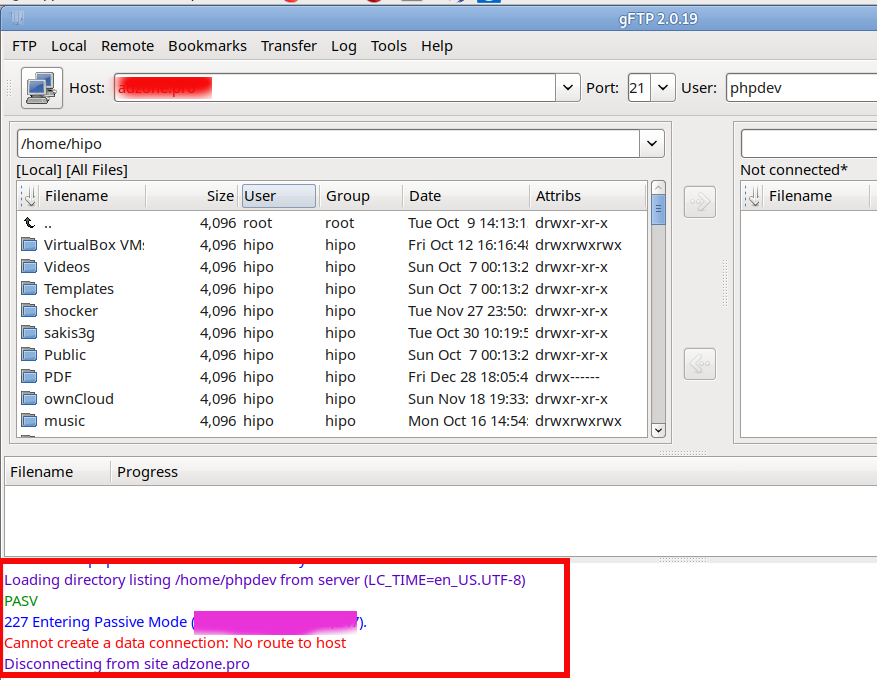
I love using sftp (Secure FTP) command Linux client to copy files and rarely use scp so I have a lot of try-outs to connect interacitvely via the Corporate Proxy server over a Jump-Host:443 to my Destination home machine, 


I've tried using netcat as it was pointed in many articles online, like so to traffic my sftp traffic via my localhost binded SSH Socks proxy on :3128 together with netcat as shown in article prior example, using following line:
 

sftp -oProxyCommand='/bin/nc -X connect -x 127.0.0.1:3128 %h %p' Username@home-ssh-server.com 22


Also tried proxy connect like this:


sftp -o ProxyCommand="proxy-connect -h localhost -p 3128 %h %p" Username@home-ssh-server.com


Moreover, tried to use the ssh  command (-s) argument capability to invoke SSH protocol subsystem feature which is used to facilitiate use of SSH secure transport for other application
 

ssh -v -J hipo@Jump-Host:443 -s sftp root@home-ssh-server.com -v

open failed: administratively prohibited: open failed


Finally decided to give a try to the same options arguments as in scp and thanks God it worked and I can even access via the Corporate Proxy through the Jump Host SSH interactively via Secure FTP 🙂

!! THE FINAL WORKING SFTP THROUGH PROXY VIA SSH JUMPHOST !!
 

sftp -o 'ProxyJump Username@Jumpt-Host-or-IP.com:443' Username@home-ssh-server.com


To save time from typing this long line every time, I've setup the following alias to ~/.bashrc
 

alias sftphome='sftp -o 'ProxyJump Username@Jumpt-Host-or-IP.com:443' Username@home-ssh-server.com'


Conclusion

Of course using own Proxy via your Home brew SSH Machine as well as transferring your data securely from your Work PC (notebook) to Home does not completely make you Surveillance free, as the Corporate Windows installed OS image is perhaps prebundled with its own integrated Keylogger as well as the Windows Domain administrators have certainly access to connect to your PC and run various commands, so this kind of Security is just an attempt to make company has less control and know less on your browsing habits and the best solution where possible to secure your privacy and separate your Personal Space form Work space by using a second computer (if having the ability to work from home) with a KVM Switch device and switch over your Work PC and Home PC via it or in some cases (where companies) allows it, setup something like VNC server (TightVNC / RealVNC) on work PC and leave it all time running in office and connect remotely with vncviewer from your own controlled secured computer.

In article I've explained shortly common scenario found in corporate Work computers proxy setup, designed to Surveil all your move, mentioned few common softwares running by default to protect from Viruses and aimed to Protect user from malicious hacking tools, explained how to view your work notebook configured Proxy, shortly mentioned on Proxy.pac and hinted how to view proxy.pac config as well as gave few of the reasons why all web traffic is being routed over central proxy.

That's all folks, Enjoy the Freedom to be less surveilled !

Fix FTP active connection issues “Cannot create a data connection: No route to host” on ProFTPD Linux dedicated server

Tuesday, October 1st, 2019

proftpd-linux-logo

Earlier I've blogged about an encounter problem that prevented Active mode FTP connections on CentOS
As I'm working for a client building a brand new dedicated server purchased from Contabo Dedi Host provider on a freshly installed Debian 10 GNU / Linux, I've had to configure a new FTP server, since some time I prefer to use Proftpd instead of VSFTPD because in my opinion it is more lightweight and hence better choice for a small UNIX server setups. During this once again I've encounted the same ACTIVE FTP not working from FTP server to FTP client host machine. But before shortly explaining, the fix I find worthy to explain briefly what is ACTIVE / PASSIVE FTP connection.


1. What is ACTIVE / PASSIVE FTP connection?
 

Whether in active mode, the client specifies which client-side port the data channel has been opened and the server starts the connection. Or in other words the default FTP client communication for historical reasons is in ACTIVE MODE. E.g.
Client once connected to Server tells the server to open extra port or ports locally via which the overall FTP data transfer will be occuring. In the early days of networking when FTP protocol was developed security was not of such a big concern and usually Networks did not have firewalls at all and the FTP DATA transfer host machine was running just a single FTP-server and nothing more in this, early days when FTP was not even used over the Internet and FTP DATA transfers happened on local networks, this was not a problem at all.

In passive mode, the server decides which server-side port the client should connect to. Then the client starts the connection to the specified port.

But with the ever increasing complexity of Internet / Networks and the ever tightening firewalls due to viruses and worms that are trying to own and exploit networks creating unnecessery bulk loads this has changed …

active-passive-ftp-explained-diagram
 

2. Installing and configure ProFTPD server Public ServerName

I've installed the server with the common cmd:


apt –yes install proftpd


And the only configuration changed in default configuration file /etc/proftpd/proftpd.conf  was
ServerName          "Debian"

I do this in new FTP setups for the logical reason to prevent the multiple FTP Vulnerability Scan script kiddie Crawlers to know the exact OS version of the server, so this was changed to:


ServerName "MyServerHostname"


Though this is the bad security through obscurity practice doing so is a good practice.
 

3. Create iptable firewall rules to allow ACTIVE FTP mode


But anyways, next step was to configure the firewall to be allowed to communicate on TCP PORT 21 and 20 to incoming source ports range 1024:65535 (to enable ACTIVE FTP) on firewal level with iptables on INPUT and OUTPUT chain rules, like this:


iptables -A INPUT -p tcp –sport 1024:65535 -d 0/0 –dport 21 -m state –state NEW,ESTABLISHED -j ACCEPT
iptables -A INPUT -p tcp -s 0/0 –sport 1024:65535 -d 0/0 –dport 20 -m state –state NEW,ESTABLISHED -j ACCEPT
iptables -A OUTPUT -p tcp -s 0/0 –sport 21 -d 0/0 –dport 1024:65535 -m state –state ESTABLISHED -j ACCEPT
iptables -A OUTPUT -p tcp -s 0/0 –sport 20 -d 0/0 –dport 1024:65535 -m state –state ESTABLISHED,RELATED -j ACCEPT


Talking about Active and Passive FTP connections perhaps for novice Linux users it might be worthy to say few words on Active and Passive FTP connections

Once firewall has enabled FTP Active / Passive connections is on and FTP server is listening, to test all is properly configured check iptable rules and FTP listener:
 

/sbin/iptables -L INPUT |grep ftp
ACCEPT     tcp  —  anywhere             anywhere             tcp spts:1024:65535 dpt:ftp state NEW,ESTABLISHED
ACCEPT     tcp  —  anywhere             anywhere             tcp spts:1024:65535 dpt:ftp-data state NEW,ESTABLISHED
ACCEPT     tcp  —  anywhere             anywhere             tcp dpt:ftp
ACCEPT     tcp  —  anywhere             anywhere             tcp dpt:ftp-data

netstat -l | grep "ftp"
tcp6       0      0 [::]:ftp                [::]:*                  LISTEN    


4. Loading nf_nat_ftp module and net.netfilter.nf_conntrack_helper (for backward compitability)


Next step of course was to add the necessery modules nf_nat_ftp nf_conntrack_sane that makes FTP to properly forward ports with respective Firewall states on any of above source ports which are usually allowed by firewalls, note that the range of ports given 1024:65535 might be too much liberal for paranoid sysadmins and in many cases if ports are not filtered, if you are a security freak you can use some smaller range such as 60000-65535.


Here is time to say for sysadmins who haven't recently had a task to configure a new (unecrypted) File Transfer Server as today Secure FTP is almost alltime used for file transfers for the sake of security might be puzzled to find out the old Linux kernel ip_conntrack_ftp which was the standard module used to make FTP Active connections work is substituted nowadays with  nf_nat_ftp and nf_conntrack_sane.

To make the 2 modules permanently loaded on next boot on Debian Linux they have to be added to /etc/modules

Here is how sample /etc/modules that loads the modules on next system boot looks like

cat /etc/modules
# /etc/modules: kernel modules to load at boot time.
#
# This file contains the names of kernel modules that should be loaded
# at boot time, one per line. Lines beginning with "#" are ignored.
softdog
nf_nat_ftp
nf_conntrack_sane


Next to say is that in newer Linux kernels 3.x / 4.x / 5.x the nf_nat_ftp and nf_conntrack-sane behaviour changed so  simply loading the modules would not work and if you do the stupidity to test it with some FTP client (I used gFTP / ncftp from my Linux desktop ) you are about to get FTP No route to host errors like:


Cannot create a data connection: No route to host


cannot-create-a-data-connection-no-route-to-host-linux-error-howto-fix


Sometimes, instead of No route to host error the error FTP client might return is:


227 entering passive mode FTP connect connection timed out error


To make the nf_nat_ftp module on newer Linux kernels hence you have to enable backwards compatibility Kernel variable


/proc/sys/net/netfilter/nf_conntrack_helper


echo 1 > /proc/sys/net/netfilter/nf_conntrack_helper


To make it permanent if you have enabled /etc/rc.local legacy one single file boot place as I do on servers – for how to enable rc.local on newer Linuxes check here

or alternatively add it to load via sysctl

sysctl -w net.netfilter.nf_conntrack_helper=1

And to make change permanent (e.g. be loaded on next boot)

echo 'net.netfilter.nf_conntrack_helper=1' >> /etc/sysctl.conf


5. Enable PassivePorts in ProFTPD or PassivePortRange in PureFTPD


Last but not least open /etc/proftpd/proftpd.conf find PassivePorts config value (commented by default) and besides it add the following line:


PassivePorts 60000 65534


Just for information if instead of ProFTPd you experience the error on PureFTPD the configuration value to set in /etc/pure-ftpd.conf is:
 

PassivePortRange 30000 35000


That's all folks, give the ncftp / lftp / filezilla or whatever FTP client you prefer and test it the FTP client should be able to talk as expected to remote server in ACTIVE FTP mode (and the auto passive mode) will be not triggered anymore, nor you will get a strange errors and failure to connect in FTP clients as gftp.

Cheers 🙂

Howto debug and remount NFS hangled filesystem on Linux

Monday, August 12th, 2019

nfsnetwork-file-system-architecture-diagram

If you're using actively NFS remote storage attached to your Linux server it is very useful to get the number of dropped NFS connections and in that way to assure you don't have a remote NFS server issues or Network connectivity drops out due to broken network switch a Cisco hub or other network hop device that is routing the traffic from Source Host (SRC) to Destination Host (DST) thus, at perfect case if NFS storage and mounted Linux Network filesystem should be at (0) zero dropped connectios or their number should be low. Firewall connectivity between Source NFS client host and Destination NFS Server and mount should be there (set up fine) as well as proper permissions assigned on the server, as well as the DST NFS should be not experiencing I/O overheads as well as no DNS issues should be present (if NFS is not accessed directly via IP address).
In below article which is mostly for NFS novice admins is described shortly few of the nuances of working with NFS.
 

1. Check nfsstat and portmap for issues

One indicator that everything is fine with a configured NFS mount is the number of dropped NFS connections
or with a very low count of dropped connections, to check them if you happen to administer NFS

nfsstat


linux:~# nfsstat -o net
Server packet stats:
packets    udp        tcp        tcpconn
0          0          0          0  


nfsstat is useful if you have to debug why occasionally NFS mounts are getting unresponsive.

As NFS is so dependent upon portmap service for mapping the ports, one other point to check in case of Hanged NFSes is the portmap service whether it did not crashed due to some reason.


linux:~# service portmap status
portmap (pid 7428) is running…   [portmap service is started.]


linux:~# ps axu|grep -i rpcbind
_rpc       421  0.0  0.0   6824  3568 ?        Ss   10:30   0:00 /sbin/rpcbind -f -w


A useful commands to debug further rcp caused issues are:

On client side:


rpcdebug -m nfs -c


On server side:


rpcdebug -m nfsd -c


It might be also useful to check whether remote NFS permissions did not changed with the good old showmount cmd

linux:~# showmount -e rem_nfs_server_host


Also it is useful to check whether /etc/exports file was not modified somehow and whether the NFS did not hanged due to attempt of NFS daemon to reload the new configuration from there, another file to check while debugging is /etc/nfs.conf – are there group / permissions issues as well as the usual /var/log/messages and the kernel log with dmesg command for weird produced NFS client / server or network messages.

nfs-utils disabled serving NFS over UDP in version 2.2.1. Arch core updated to 2.3.1 on 21 Dec 2017 (skipping over 2.2.1.) If UDP stopped working then, add udp=y under [nfsd] in /etc/nfs.conf. Then restart nfs-server.service.

If the remote NFS server is running also Linux it is useful to check its /etc/default/nfs-kernel-server configuration

At some stall cases it might be also useful to remount the NFS (but as there might be a process on the Linux server) trying to read / write data from the remote NFS mounted FS it is a good idea to check (whether a process / service) on the server is not doing I/O operations on the NFS and if such is existing to kill the process in question with fuser
 

linux:~# fuser -k [mounted-filesystem]


2. Diagnose the problem interactively with htop


    Htop should be your first port of call. The most obvious symptom will be a maxed-out CPU.
    Press F2, and under "Display options", enable "Detailed CPU time". Press F1 for an explanation of the colours used in the CPU bars. In particular, is the CPU spending most of its time responding to IRQs, or in Wait-IO (wio)?
 

3. Get more extensive Mount info with mountstats


nfs-utils package contains mountstats command which is very useful in debugging further the issues identified

$ mountstats
Stats for example:/tank mounted on /tank:
  NFS mount options: rw,sync,vers=4.2,rsize=524288,wsize=524288,namlen=255,acregmin=3,acregmax=60,acdirmin=30,acdirmax=60,soft,proto=tcp,port=0,timeo=15,retrans=2,sec=sys,clientaddr=xx.yy.zz.tt,local_lock=none
  NFS server capabilities: caps=0xfbffdf,wtmult=512,dtsize=32768,bsize=0,namlen=255
  NFSv4 capability flags: bm0=0xfdffbfff,bm1=0x40f9be3e,bm2=0x803,acl=0x3,sessions,pnfs=notconfigured
  NFS security flavor: 1  pseudoflavor: 0


NFS byte counts:
  applications read 248542089 bytes via read(2)
  applications wrote 0 bytes via write(2)
  applications read 0 bytes via O_DIRECT read(2)
  applications wrote 0 bytes via O_DIRECT write(2)
  client read 171375125 bytes via NFS READ
  client wrote 0 bytes via NFS WRITE

RPC statistics:
  699 RPC requests sent, 699 RPC replies received (0 XIDs not found)
  average backlog queue length: 0

READ:
    338 ops (48%)
    avg bytes sent per op: 216    avg bytes received per op: 507131
    backlog wait: 0.005917     RTT: 548.736686     total execute time: 548.775148 (milliseconds)
GETATTR:
    115 ops (16%)
    avg bytes sent per op: 199    avg bytes received per op: 240
    backlog wait: 0.008696     RTT: 15.756522     total execute time: 15.843478 (milliseconds)
ACCESS:
    93 ops (13%)
    avg bytes sent per op: 203    avg bytes received per op: 168
    backlog wait: 0.010753     RTT: 2.967742     total execute time: 3.032258 (milliseconds)
LOOKUP:
    32 ops (4%)
    avg bytes sent per op: 220    avg bytes received per op: 274
    backlog wait: 0.000000     RTT: 3.906250     total execute time: 3.968750 (milliseconds)
OPEN_NOATTR:
    25 ops (3%)
    avg bytes sent per op: 268    avg bytes received per op: 350
    backlog wait: 0.000000     RTT: 2.320000     total execute time: 2.360000 (milliseconds)
CLOSE:
    24 ops (3%)
    avg bytes sent per op: 224    avg bytes received per op: 176
    backlog wait: 0.000000     RTT: 30.250000     total execute time: 30.291667 (milliseconds)
DELEGRETURN:
    23 ops (3%)
    avg bytes sent per op: 220    avg bytes received per op: 160
    backlog wait: 0.000000     RTT: 6.782609     total execute time: 6.826087 (milliseconds)
READDIR:
    4 ops (0%)
    avg bytes sent per op: 224    avg bytes received per op: 14372
    backlog wait: 0.000000     RTT: 198.000000     total execute time: 198.250000 (milliseconds)
SERVER_CAPS:
    2 ops (0%)
    avg bytes sent per op: 172    avg bytes received per op: 164
    backlog wait: 0.000000     RTT: 1.500000     total execute time: 1.500000 (milliseconds)
FSINFO:
    1 ops (0%)
    avg bytes sent per op: 172    avg bytes received per op: 164
    backlog wait: 0.000000     RTT: 2.000000     total execute time: 2.000000 (milliseconds)
PATHCONF:
    1 ops (0%)
    avg bytes sent per op: 164    avg bytes received per op: 116
    backlog wait: 0.000000     RTT: 1.000000     total execute time: 1.000000 (milliseconds)


nfs-utils disabled serving NFS over UDP in version 2.2.1. Arch core updated to 2.3.1 on 21 Dec 2017 (skipping over 2.2.1.) If UDP stopped working then, add udp=y under [nfsd] in /etc/nfs.conf. Then restart nfs-server.service.
 

4. Check for firewall issues
 

If all fails make sure you don't have any kind of firewall issues. Sometimes firewall changes on remote server or somewhere in the routing servers might lead to stalled NFS mounts.


To use properly NFS as you should know as a minimum you need to have opened as ports is Port 111 (TCP and UDP) and 2049 (TCP and UDP) on the NFS server (side) as well as any traffic inspection routers on the road from SRC (Linux client host) and NFS Storage destination DST server.

There are also ports for Cluster and client status (Port 1110 TCP for the former, and 1110 UDP for the latter) as well as a port for the NFS lock manager (Port 4045 TCP and UDP) but having this opened or not depends on how the NFS is configured. You can further determine which ports you need to allow depending on which services are needed cross-gateway.
 

5. How to Remount a Stalled unresponsive NFS filesystem mount


At many cases situation with remounting stalled NFS filesystem is not so easy but if you're lucky a standard mount and remount should do the trick.

Most simple way to remout the NFS (once you're sure this might not disrupt any service) – don't blame me if you break something is with:
 

umount -l /mnt/NFS_mnt_point
mount /mnt/NFS_mnt_point


Note that the lazy mount (-l) umount opt is provided here as very often this is the only way to unmount a stalled NFS mount.

Sometimes if you have a lot of NFS mounts and all are inacessible it is useful to remount all NFS mounts, if the remote NFS is responsive this should be possible with a simple for bash loop:

for P in $(mount | awk '/type nfs / {print $3;}'); do echo $P; echo "sudo umount $P && sudo mount $P" && echo "ok :)"; done


If you cd /mnt/NFS_mnt_point and try ls and you get

$ ls
.: Stale File Handle


You will need to unmount the FS with forceful mount flag

umount -f /mnt/NFS_mnt_point
 

Sum it up


In this article, I've shown you a few simple ways to debug what is wrong with a Stalled / Hanged NFS filesystem present on a NFS server mounted on a Linux client server.
Above was explained the common issues caused by NFS portmap (rpcbind) dependency, how to its status is fine, some further diagnosis with htop and mountstat was pointed. I've pointed the minimum amount of TCP / UDP ports 2049 and 111 that needs to be opened for the NFS communication to work and finally explained on how to remount a stalled NFS single or all attached mount on a NFS client to restore to normal operations.
As NFS is a whole ocean of things and the number of ways it is used are too extensive this article is just a general info useful for the NFS dummy admin for more robust configs read some good book on NFS such as Managing NFS and NIS, 2nd Edition – O'Reilly Media and for Kernel related NFS debugging make sure you check as a minimum ArchLinux's NFS troubleshooting guide and sourceforge's NFS Troubleshoting and Optimizing NFS Performance guides.


Find all running hosts, used IPs and ports on your local wireless / ethernet network or how to do a basic network security audit with nmap

Monday, September 4th, 2017

Find all running hosts / used IPs on your local wireless or ethernet network

nmap-scn-local-network-find-all-running-hosts-used-IPs-on-your-wireless-ethernet-network

If you're using a Free Software OS such as GNU / Linux or some other proprietary OS such as Mac OS X or Windows and you need a quick way to check all running IPs hosts / nodes locally on your current connected Ethernet or Wireless network, here is how to do it with nmap (Network exploration and security tool port scanner).

So why would you do scan that? 

Well just for fun, out of curiousity or just because you want to inspect your local network whether someone unexpected cracker did not break and is not using your Wi-Fi or Ethernet local network and badly snoring your network listening for passwords.

Before you start you should have installed NMAP network scanner on your GNU / Linux, to do so on 

Redhat Based Linux (Fedora / CentOS / Redhat Enterprise RHEL):


yum -y install nmap


On Deb based GNU / Linux-es such as Ubuntu / Mint / Debian etc.


apt-get install –yes nmap


To install nmap on FreeBSD / NetBSD / OpenBSD OS issue from console or terminal:


cd /usr/ports/security/nmap
make install clean 


or if you prefer to install it from latest binary instead of compiling


pkg_add -vr nmap


On a proprietary Mac OS X (I don't recommend you to use this obnoxious OS which is designed as a proprpietary software to steal your freedom and control you, but anyways for Mac OS victims), you can do it to with Macs equivalent tool of apt-get / yum called homebrew:

Open Mac OS X terminal and to install homebrew run:


ruby -e "$(curl -fsSL https://raw.githubusercontent.com/Homebrew/install/master/install)"
brew install nmap
brew search nmap
brew info nmap


If you want to do it system wide become root (super user) from Mac terminal with


su root


and run above commands as administrator user.

Windows users might take a look at Nmap for Windows or use the M$ Windows native portqry command line port scanner

Test whether nmap is properly installed and ready to use with command:


nmap –help
Nmap 6.00 ( http://nmap.org )
Usage: nmap [Scan Type(s)] [Options] {target specification}
TARGET SPECIFICATION:
  Can pass hostnames, IP addresses, networks, etc.
  Ex: scanme.nmap.org, microsoft.com/24, 192.168.0.1; 10.0.0-255.1-254
  -iL <inputfilename>: Input from list of hosts/networks
  -iR <num hosts>: Choose random targets
  –exclude <host1[,host2][,host3],…>: Exclude hosts/networks
  –excludefile <exclude_file>: Exclude list from file
HOST DISCOVERY:
  -sL: List Scan – simply list targets to scan
  -sn: Ping Scan – disable port scan
  -Pn: Treat all hosts as online — skip host discovery
  -PS/PA/PU/PY[portlist]: TCP SYN/ACK, UDP or SCTP discovery to given ports
  -PE/PP/PM: ICMP echo, timestamp, and netmask request discovery probes
  -PO[protocol list]: IP Protocol Ping
  -n/-R: Never do DNS resolution/Always resolve [default: sometimes]
  –dns-servers <serv1[,serv2],…>: Specify custom DNS servers
  –system-dns: Use OS's DNS resolver
  –traceroute: Trace hop path to each host
SCAN TECHNIQUES:
  -sS/sT/sA/sW/sM: TCP SYN/Connect()/ACK/Window/Maimon scans
  -sU: UDP Scan
  -sN/sF/sX: TCP Null, FIN, and Xmas scans
  –scanflags <flags>: Customize TCP scan flags
  -sI <zombie host[:probeport]>: Idle scan
  -sY/sZ: SCTP INIT/COOKIE-ECHO scans
  -sO: IP protocol scan
  -b <FTP relay host>: FTP bounce scan
PORT SPECIFICATION AND SCAN ORDER:
  -p <port ranges>: Only scan specified ports
    Ex: -p22; -p1-65535; -p U:53,111,137,T:21-25,80,139,8080,S:9
  -F: Fast mode – Scan fewer ports than the default scan
  -r: Scan ports consecutively – don't randomize
  –top-ports <number>: Scan <number> most common ports
  –port-ratio <ratio>: Scan ports more common than <ratio>
SERVICE/VERSION DETECTION:
  -sV: Probe open ports to determine service/version info
  –version-intensity <level>: Set from 0 (light) to 9 (try all probes)
  –version-light: Limit to most likely probes (intensity 2)
  –version-all: Try every single probe (intensity 9)
  –version-trace: Show detailed version scan activity (for debugging)
SCRIPT SCAN:
  -sC: equivalent to –script=default
  –script=<Lua scripts>: <Lua scripts> is a comma separated list of 
           directories, script-files or script-categories
  –script-args=<n1=v1,[n2=v2,…]>: provide arguments to scripts
  –script-args-file=filename: provide NSE script args in a file
  –script-trace: Show all data sent and received
  –script-updatedb: Update the script database.
  –script-help=<Lua scripts>: Show help about scripts.
           <Lua scripts> is a comma separted list of script-files or
           script-categories.
OS DETECTION:
  -O: Enable OS detection
  –osscan-limit: Limit OS detection to promising targets
  –osscan-guess: Guess OS more aggressively
TIMING AND PERFORMANCE:
  Options which take <time> are in seconds, or append 'ms' (milliseconds),
  's' (seconds), 'm' (minutes), or 'h' (hours) to the value (e.g. 30m).
  -T<0-5>: Set timing template (higher is faster)
  –min-hostgroup/max-hostgroup <size>: Parallel host scan group sizes
  –min-parallelism/max-parallelism <numprobes>: Probe parallelization
  –min-rtt-timeout/max-rtt-timeout/initial-rtt-timeout <time>: Specifies
      probe round trip time.
  –max-retries <tries>: Caps number of port scan probe retransmissions.
  –host-timeout <time>: Give up on target after this long
  –scan-delay/–max-scan-delay <time>: Adjust delay between probes
  –min-rate <number>: Send packets no slower than <number> per second
  –max-rate <number>: Send packets no faster than <number> per second
FIREWALL/IDS EVASION AND SPOOFING:
  -f; –mtu <val>: fragment packets (optionally w/given MTU)
  -D <decoy1,decoy2[,ME],…>: Cloak a scan with decoys
  -S <IP_Address>: Spoof source address
  -e <iface>: Use specified interface
  -g/–source-port <portnum>: Use given port number
  –data-length <num>: Append random data to sent packets
  –ip-options <options>: Send packets with specified ip options
  –ttl <val>: Set IP time-to-live field
  –spoof-mac <mac address/prefix/vendor name>: Spoof your MAC address
  –badsum: Send packets with a bogus TCP/UDP/SCTP checksum
OUTPUT:
  -oN/-oX/-oS/-oG <file>: Output scan in normal, XML, s|<rIpt kIddi3,
     and Grepable format, respectively, to the given filename.
  -oA <basename>: Output in the three major formats at once
  -v: Increase verbosity level (use -vv or more for greater effect)
  -d: Increase debugging level (use -dd or more for greater effect)
  –reason: Display the reason a port is in a particular state
  –open: Only show open (or possibly open) ports
  –packet-trace: Show all packets sent and received
  –iflist: Print host interfaces and routes (for debugging)
  –log-errors: Log errors/warnings to the normal-format output file
  –append-output: Append to rather than clobber specified output files
  –resume <filename>: Resume an aborted scan
  –stylesheet <path/URL>: XSL stylesheet to transform XML output to HTML
  –webxml: Reference stylesheet from Nmap.Org for more portable XML
  –no-stylesheet: Prevent associating of XSL stylesheet w/XML output
MISC:
  -6: Enable IPv6 scanning
  -A: Enable OS detection, version detection, script scanning, and traceroute
  –datadir <dirname>: Specify custom Nmap data file location
  –send-eth/–send-ip: Send using raw ethernet frames or IP packets
  –privileged: Assume that the user is fully privileged
  –unprivileged: Assume the user lacks raw socket privileges
  -V: Print version number
  -h: Print this help summary page.
EXAMPLES:
  nmap -v -A scanme.nmap.org
  nmap -v -sn 192.168.0.0/16 10.0.0.0/8
  nmap -v -iR 10000 -Pn -p 80
SEE THE MAN PAGE (http://nmap.org/book/man.html) FOR MORE OPTIONS AND EXAMPLES


Most local router local networks are running under an IP range of 192.168.0.1/24 (192.168.0.1.254) or 192.168.1.1/24 or at some weird occasions depending on how the router is configured it might be something like 192.168.10.0/24 to be sure on what kind of network your computer is configured, you can check with ifconfig command, what kind of network IP has the router assigned to your computer, here is output from my Debian GNU / Linux /sbin/ifconfig


 hipo@noah:~$ /sbin/ifconfig 
lo        Link encap:Local Loopback  
          inet addr:127.0.0.1  Mask:255.0.0.0
          inet6 addr: ::1/128 Scope:Host
          UP LOOPBACK RUNNING  MTU:16436  Metric:1
          RX packets:336 errors:0 dropped:0 overruns:0 frame:0
          TX packets:336 errors:0 dropped:0 overruns:0 carrier:0
          collisions:0 txqueuelen:0 
          RX bytes:26656 (26.0 KiB)  TX bytes:26656 (26.0 KiB)


wlan0     Link encap:Ethernet  HWaddr 00:1c:bf:bd:27:59  
          inet addr:192.168.0.103  Bcast:192.168.0.255  Mask:255.255.255.0
          inet6 addr: fe80::21c:bfff:ffbd:2759/64 Scope:Link
          UP BROADCAST RUNNING MULTICAST  MTU:1500  Metric:1
          RX packets:112836 errors:0 dropped:0 overruns:0 frame:0
          TX packets:55363 errors:0 dropped:0 overruns:0 carrier:0
          collisions:0 txqueuelen:1000 
          RX bytes:141318655 (134.7 MiB)  TX bytes:7391330 (7.0 MiB)


As evident from above output my router assigns IPs via DHCP once authenticated into the Wi-Fi router under standard IP range of 192.168.0.0/24

So under this IP range case, to inspect my small local networkconnected computer I had to run from gnome-terminal or under a /dev/ttyX virtual console:


hipo@noah:~$ nmap -sn 192.168.0.0/24

Starting Nmap 6.00 ( http://nmap.org ) at 2017-09-04 12:45 EEST
Nmap scan report for pcfreak (192.168.0.1)
Host is up (0.011s latency).
Nmap scan report for 192.168.0.103
Host is up (0.00011s latency).
Nmap done: 256 IP addresses (2 hosts up) scanned in 2.53 seconds


-sn argument instructs nmap to do the so called ping scan, e.g. not to do a port s
can after host discovery but just print available hosts that are responding

Some bigger corporate networks are configured to run a couple of local networks simultaneously such as 192.168.168.0.0/24, 192.168.1.0/24, 192.168.2.0/24 etc.

So if that's the case you can add more virtual IPs to your ifconfig after becoming root super user with:


hipo@noah:~$ su root 
Password: 
root@noah:/home/hipo# 


And then run:


/sbin/ifconfig wlan0:0 192.168.1.110 netmask 255.255.255.0
/sbin/ifconfig wlan0:1 192.168.2.110 netmask 255.255.255.0


etc.

Note that here I purposefully choose .110 IP because often the 192.168.1.1 is an IP assigned to the router and that might cause some IP conflicts and trigger alarms in the router security which I want to avoid.

To check just added extra Virtual IPs on wlan0 wireless interface (note that depending on your Wi-Fi card and your driver this interface might come under a different name on your computer):


root@noah# /sbin/ifconfig |grep -i wlan0 -A 1
wlan0     Link encap:Ethernet  HWaddr 00:1c:bf:bd:25:59  
          inet addr:192.168.0.103  Bcast:192.168.0.255  Mask:255.255.255.0

wlan0:0   Link encap:Ethernet  HWaddr 00:1c:bf:bd:25:59  
          inet addr:192.168.1.110  Bcast:192.168.1.255  Mask:255.255.255.0

wlan0:1   Link encap:Ethernet  HWaddr 00:1c:bf:bd:27:59  
          inet addr:192.168.2.110  Bcast:192.168.2.255  Mask:255.255.255.0


If you're scanning not on your own network but on a public connected network you might prefer to not use the ping scan as this might identify you in router's firewall as possible intruder and could cause you headaches, besides that some network connected nodes are connected to not respond on a ping scan (some networks purposefully disable pings at all) to avoid possibility of the so called ping flood that might overload a router buffer or bring down hosts on the network beinf flooded.

If you have doubts that a network has ping disabled and it shows no result you can give a try to the so called SYN / FIN Stealth packet scan with added requirement to scan for UDP open ports (-sS) argument


root@noah:/~# nmap -sS -sU -sT 192.168.0.1-255

Starting Nmap 6.00 ( http://nmap.org ) at 2017-09-04 13:31 EEST
Nmap scan report for pcfreak (192.168.0.1)
Host is up (0.012s latency).
Not shown: 998 closed ports
PORT     STATE SERVICE
80/tcp   open  http
1900/tcp open  upnp
MAC Address: 10:FE:ED:43:CF:0E (Unknown)

Nmap scan report for 192.168.0.100
Host is up (0.0036s latency).
Not shown: 998 closed ports
PORT      STATE SERVICE
625/tcp   open  apple-xsrvr-admin
49153/tcp open  unknown
MAC Address: 84:38:35:5F:28:75 (Unknown)

Nmap scan report for 192.168.0.103
Host is up (0.000012s latency).
Not shown: 999 closed ports
PORT   STATE SERVICE
22/tcp open  ssh


You might also like to add some verbosy (that would generate a lot of output so be careful):

In case if above scan fails due to firewalls and you have a ping scan disabled on the network too you might also try out the so called nmap connect TCP connect scan (-sT), that would avoid the SYN scan. The -sT is useful also if you're not possessing root superprivileges on nmap running host.


nmap -sS -sU 192.168.0.1-255


Note that connect scan could take ages as nmap tries to connect every port from default port scanned ranged on remote found hosts that are reporting as up and running.

If the shown results lead you find some unknown computer / tablet / mobile / phone device connected to your network, then connect to your router and thoroughfully inspect the traffic flowing through it, if you find intruder cut him off and change immediately your router passwords and monitor your network periodically to make sure the unwanted guest did not go back in future.

There is much more you can do with nmap so if you have some extra time and interest into penetration testing I recommend you check out Nmap Book (The Official Nmap project guide to Network Discovery and Security Scanning)

Monitor General Server / Desktop system health in console on Linux and FreeBSD

Tuesday, October 4th, 2011

slurm-output-monitoring-networking
saidar
is a text based ncurses program to display live statistics about general system health.

It displays in one refreshable screen (similar to top) statistics about server state of:
CPU, Load, Memory, Swap, Network, I/O disk operations
Besides that saidar supports a ncurses console colors, which makes it more funny to look at.
Saidar extracts the statistics for system state based on libgstrap cross platform statistics library about pc system health.

On Debian, Ubuntu, Fedora, CentOS Linuxes saider is available for install straight from distribution repositories.
On Debian and Ubuntu saidar is installed with cmd:

debian:~# apt-get install saidar
...

On CentOS and Fedora saidar is bundled as a part of statgrab-tools rpm package.
Installing it on 64 bit CentOS with yum is with command:

[root@centos ~]# yum install statgrab-tools.x86_64

Saidar is also available on FreeBSD as a part of the /usr/ports/devel/libgstrab, hence to use on my FreeBSD I had to install the libgstrab port:

freebsd# cd /usr/ports/devel/libstatgrab
freebsd# make install clean

Here is saidar running on my Desktop Debian on Thinkpad in color output:

debian:~# saidar -c

Saidar Linux General statistics Screenshot

I've seen many people, who use various shell scripts to output system monitoring information, this scripts however are often written to just run without efficiency in mind and they put some let's say 1% extra load on the system CPU. This is not the case with saidar which is written in C and hence the program is optimized well for what it does.

Update: Next to saidar I recommend you check out Slurm (Real Time Network Interface Monitor) it can visualizes network interface traffic using ascii graph such as on top of the article. On Debian and Ubuntu Slurm is available and easily installable via simple:
 

apt-get install –yes slurm


PortQRY Native Windows command line Nmap like port scanner – Check status of remote host ports on Windows

Monday, June 30th, 2014

Windows_command_line_and_gui_port-scanner-portqry-like-nmap-check-status-of-remote-host-service-windows-xp-7-2000-2003-2008-server
Linux users know pretty well Nmap (network mapper) tool which is precious in making a quick server host security evaluation.
Nmap binary port is available for Windows too, however as nmap is port for its normal operation you have to install WinPcap (Packet Capture Library).
And more importantly it is good to mention if you need to do some remote port scanning from Windows host, there is Microsoft produced native tool called PortQry (Port Query).

PortQRY is a must have tool for the Windows Admin as it can help you troubleshoot multiple network issues.

windows-nmap-native-alternative-portqry-gui-ui-web-service-port-scan-screenshot
As of time of writting this post PortQRY is at version 2, PortQRY tool has also a GUI (UI) Version for those lazy to type in command line.

Port Query UI tool (portqueryui.exe) is a tool to query open ports on a machine. This tool makes use of command line version port query tool (portqry.exe). The UI provides the following functionalities:

   1. Following "Enter destination IP or FQDN to query:”, an edit box needs the user to specify the IP address or FDQN name of the destination to query port status.

   2. The end user is able to choose Query type:

        – Predefined services type. It groups ports into service, so that you can query multiple ports for a service by a single click. Service includes "Domains and Trusts", "DNS Queries", "NetBIOS     communication", "IPSEC", "Networking", "SQL Service", "WEB Service", "Exchange Server",          "Netmeeting", and other services.

You can check detail port and protocol info for each service category by opening Help -> Predefined Services…

PORTQRY is part of Windows Server 2003 Support Tools and can be added to any NT based Windows (XP, 2003, Vista, 7, 8)
 You can download portqry command line tool here or my mirrored portqry version command line port scanner here and PortQRY UI here.

PortQRY comes in PortQryV2.exe package which when run extracts 3 files: PortQry.exe program, EULA and readme file. Quickest way to make portqry globally accessible from win command prompt is to copy it to %SystemRoot% (The environment variable holding default location for Windows Installation directory).
It is good idea to add PortQRY to default PATH folder to make it accessible from command line globally.

PorQry has 3 modes of operation:

Command Line Mode, Interactive Mode and Local Mode

portqry-windows-native-security-port-network-scanner-nmap-equivalent-help-screenshot
 

Command Line Mode – is when it is invoked with parameters.

Interactive Mode is when it runs in interactive CLI console

portqry-windows-native-security-port-network-scanner-nmap-equivalent-interactive-mode-screenshot

portqry-windows-native-security-port-network-scanner-nmap-equivalent-interactive-mode-help-screenshot
and Local Mode is used whether information on local system ports is required.

portqry-windows-native-security-port-network-scanner-nmap-equivalent-local-mode-screenshot


Here are some examples on basic usage of portqry:
 

1. Check if remote server is running webserver is listening on (HTTPS protocol) TCP port 80

portqry -n servername -e 80
 

Querying target system called:

 www.pc-freak.net

Attempting to resolve name to IP address…


Name resolved to 83.228.93.76

querying…

TCP port 80 (http service): FILTERED

2. Check whether some common Samba sharing and DNS UDP ports are listening

portqry -n servername -p UDP -o 37,53,88,135
 

Querying target system called:

servername

Attempting to resolve name to IP address…


Name resolved to 74.125.21.100

querying…

UDP port 37 (time service): NOT LISTENING

UDP port 53 (domain service): NOT LISTENING

UDP port 88 (kerberos service): NOT LISTENING

UDP port 135 (epmap service): NOT LISTENING

3. Scan open ports in a port range – Check common services port range (port 1-1024)

portqry -n 192.168.1.20 -r 1:1024 | find ": LISTENING"

4. Logging network scan output to file

Portqry –n localhost –e 135 -l port135.txt
 

Querying target system called:

 localhost

Attempting to resolve name to IP address…


Name resolved to 127.0.0.1

querying…

TCP port 135 (epmap service): LISTENING

Using ephemeral source port
Querying Endpoint Mapper Database…
Server's response:

UUID: d95afe70-a6d5-4259-822e-2c84da1ddb0d
ncacn_ip_tcp:localhost[49152]

UUID: 2f5f6521-cb55-1059-b446-00df0bce31db Unimodem LRPC Endpoint
ncacn_np:localhost[PIPEwkssvc]

Total endpoints found: 38


5. Scanning UDP and TCP protocols port

PortQry -n www.pc-freak.net -e 25 -p both


Querying target system called:

 www.pc-freak.net

Attempting to resolve name to IP address…


Name resolved to 83.228.93.76

querying…

TCP port 53 (domain service): LISTENING

UDP port 53 (domain service): LISTENING or FILTERED

Sending DNS query to UDP port 53…


6. Checking remote server whether LDAP ports are listening

Portqry -remotehost.com -p tcp -e 389
Portqry -n remotehost.com -p tcp -e 636
Portqry -n remotehost.com -p both -e 3268
Portqry -n remotehost.com -p tcp -e 3269


7. Making SNMP community name requests

portqry -n host2 -cn !my community name! -e 161 -p udp


8. Initiating scan from pre-selected source port

A network socket request initiation is useful from certain port because, some remote services expect connection from certain ports, lets say you're connecting to mail server, you might want to set as a source port – port 25, to make remote server another SMTP is connecting.

portqry -n www.pc-freak.net -e 25 -sp 25


9. Scanning whether server ports required by Active Directories are opened

Common ports used in Windows hosts to communicate between each other to sustain Active Directory are:

88 (Kerberos)
135 (RPC)
389 (LDAP)
445 (CIFS)
3268 (Global Catalog)

portqry -n remote-host.com -o 88,135,389,445,3268 -p both

portqry has also a silent mode with the "-q" switch if you want to get only whether a port is LISTENING (opened).

On port scan it returns three major return codes (very useful for scripting purposes);

  • returncode 0 – if port / service is listening
  • returncode 1 – if service is not listening
  • returncode 2 – if service is listening or filtered

PortQry is very simple port scanner for win sysadms and is precious tool for basic network debugging (services)  on Windows farms, however it doesn't have the powerful cracker functionality, application / OS versioning etc. like Nmap.


Linux / BSD: Check if Apache web server is listening on port 80 and 443

Tuesday, June 3rd, 2014

apache_check_if_web_server_running_port-80-and-port-443-logo-linux-and-bsd-check-apache-running
If you're configuring a new Webserver or adding a new VirtualHost to an existing Apache configuration you will need to restart Apache with or without graceful option once Apache is restarted to assure Apache is continuously running on server (depending on Linux distribution) issue:

1. On Debian Linux / Ubuntu servers

# ps axuwf|grep -i apache|grep -v grep

root 23280 0.0 0.2 388744 16812 ? Ss May29 0:13 /usr/sbin/apache2 -k start
www-data 10815 0.0 0.0 559560 3616 ? S May30 2:25 _ /usr/sbin/apache2 -k start
www-data 10829 0.0 0.0 561340 3600 ? S May30 2:31 _ /usr/sbin/apache2 -k start
www-data 10906 0.0 0.0 554256 3580 ? S May30 0:20 _ /usr/sbin/apache2 -k start
www-data 10913 0.0 0.0 562488 3612 ? S May30 2:32 _ /usr/sbin/apache2 -k start
www-data 10915 0.0 0.0 555524 3588 ? S May30 0:19 _ /usr/sbin/apache2 -k start
www-data 10935 0.0 0.0 553760 3588 ? S May30 0:29 _ /usr/sbin/apache2 -k start


2. On CentOS, Fedora, RHEL and SuSE Linux and FreeBSD

ps ax | grep httpd | grep -v grep


7661 ? Ss 0:00 /usr/sbin/httpd
7664 ? S 0:00 /usr/sbin/httpd
7665 ? S 0:00 /usr/sbin/httpd
7666 ? S 0:00 /usr/sbin/httpd
7667 ? S 0:00 /usr/sbin/httpd
7668 ? S 0:00 /usr/sbin/httpd
7669 ? S 0:00 /usr/sbin/httpd
7670 ? S 0:00 /usr/sbin/httpd
7671 ? S 0:00 /usr/sbin/httpd


Whether a new Apache IP Based VirtualHosts are added to already existing Apache and you have added new

Listen 1.1.1.1:80
Listen 1.1.1.1:443

directives, after Apache is restarted to check whether Apache is listening on port :80 and :443
 

netstat -ln | grep -E ':80|443'

tcp        0      0 0.0.0.0:80              0.0.0.0:*               LISTEN
tcp        0      0 0.0.0.0:443            0.0.0.0:*               LISTEN


Meaning of 0.0.0.0 is that Apache is configured to Listen on Any Virtualhost IPs and interfaces. This output is usually returned whether in Apache config httpd.conf / apache2.conf webserver is configured with directive.

Listen *:80
 

If in netstat output there is some IP poping up for example  "192.168.1.1:http", this means that only connections to the "192.168.1.1" IP address will be accepted by Apache.

Another way to look for Apache in netstat (in case Apache is configured to listen on some non-standard port number) is with:

netstat -l |grep -E 'http|www'

tcp        0      0 *:www                   *:*                     LISTEN


As sometimes it might be possible that Apache is listening but its processes are in in defunct (Zommbie) state it is always a good idea, also to check if pages server by Apache are opening in browser (check it with elinks, lynx or curl)

To get more thorough information on Apache listened ports, protocol, user with which Apache is running nomatter of Linux distribution use lsof command:
 

/usr/bin/lsof -i|grep -E 'httpd|http|www'

httpd     6982 nobody    3u  IPv4  29388359      0t0  TCP www.pc-freak.net:https (LISTEN)
httpd    18071 nobody    3u  IPv4 702790659      0t0  TCP www.pc-freak.net:http (LISTEN)
httpd    18071 nobody    4u  IPv4 702790661      0t0  TCP www.pc-freak.net.net:https (LISTEN)


If Apache is not showing up even though restarted check what is going wrong in the error logs:

– on Debian standard error log is /var/log/apache2/error.log
– On RHEL, CentOS, SuSE std. error log is in /var/log/httpd/error.log
– on FeeBSD /var/log/httpd-error.log