Posts Tagged ‘sbin’

Unfreeze stucked “freezed” messages from Exim Mail server queue

Friday, June 16th, 2023

how-to-unfreeze-messages-from-exim-mail-server-smtp-logo-linux-and-some-other-useful-exim-commands.png

Messages are frozen when the mail server has determined it cannot do anything to deliver the message. (they can also be manually frozen).

Exim has option to set how long frozen messages are kept on the system.

On a Debian/Ubuntu based install the /etc/exim4/conf.d/main/02_exim4-config_options file has the option timeout_frozen_after = 7d. Which means messages frozen for 7 days will get expunged.

Frozen messages really shouldn't be a problem on most systems. They are often just spam messages that can't get properly delivered.

If you have to deal with freezed mails from the exim mail server, unlike postfix, where there is no "freeze" scheme but the messages just stuck in the queue and you might want to simply ask the mail server to resend failed to deliver messages once again through a simple:

# postqueue -f


With exim to ask the server to resend the freeze-d states messages there is another aproach:

It is for this reason that I am writing this post to share how you can ask the exim to resend the "frozen" messages, as on exim there is no so much straight forward way.

To find out what letters are stored in the exim queue run

# exim -bp

To unfreeze the messages a simple while loop can be written, which lists all frozen state messages and unfreezes these letters one by one in a cycle:

# exim -bp | grep -i frozen | awk '{print $3}' | while read LINE; do exim -Mt $LINE; done

Another approach to unfreeze the frozen multitude of messages which should be a bit quicker if you have to do it for a very large amount of frozen states mails is to use xargs command:

# mailq | grep frozen | awk '{print $3}' | xargs exim -v -M

Since we on exim topic in this article, for starters with Exim, here is few other useful exim queue commands, that might be beneficial if you have to deal with EXIM SMTP.

Attempting to send a mail with a specified ID

# /usr/sbin/exim -M email-id


Forcefully run another queue to execute

# /usr/sbin/exim -qf

We see the logs related to letter

# /usr/sbin/exim -Mvl messageID

To see the body of the letter

# /usr/sbin/exim -Mvb messageID

To see the beginning (header) of the letter only

# /usr/sbin/exim -Mvh messageID

Deletes the mail without sending any error messages

# /usr/sbin/exim -Mrm messageID

Shows the number of letters in the queue

# /usr/sbin/exim -bpr | grep "<" | wc -l

Shows the number of frozen mails in the queue

# /usr/sbin/exim -bpr | grep frozen | wc -l

Deletes all frozen letters

# /usr/sbin/exim -bpr | grep frozen | awk {'print $3'} | xargs exim -Mrm

To remove a message from the Exim queue

# exim -Mrm {message-id}

Remove all messages from the Exim queue

# exim -bp | awk '/^ *[0-9]+[mhd]/{print "exim -Mrm " $3}' | bash

Another way to do it:

# exim -bp | exiqgrep -i | xargs exim -Mrm


Fastest solution to delete all emails in exim queue (for less than 5 seconds) is
 

# cd /var/spool
# mv exim exim.old
# mkdir -p exim/input
# mkdir -p exim/msglog
# mkdir -p exim/db
# chown -R mail:mail exim
# /sbin/service exim restart

or if you have AV / AntiSpam integrated to mail server:

# cd /var/spool
# mv exim exim.old
# mkdir -p exim/db
# mkdir -p exim/input
# mkdir -p exim/msglog
# mkdir -p exim/scan
# chown -R mail:mail exim
# /sbin/service exim restart

Deletes the entire exim queue

# /usr/sbin/exim -qff

How to log multiple haproxy / apache / mysql instance via haproxy log-tagging / Segregating log management for multiple HAProxy instances using rsyslog

Tuesday, May 23rd, 2023

rsyslog-logo-picture-use-programname-and-haproxy-log-tag-directives-together-to-log-as-many-process-streams-as-you-like


Introduction

This article provides a guide on refining haproxy  logging mechanism by leveraging the `programname` property in rsyslog, coupled with the `log-tag` directive in haproxy.
This approach will create a granular logging setup, separating logs according to their originating services and specific custom tags, enhancing overall log readability.

Though the article is written concretely for logging multiple log streams from haproxy this can be successfully applied
for any other Linux service to log as many concrete log-tagged data streams as you prefer.

Scope

The guide focuses on tailoring the logging mechanisms for two haproxy  instances named `haproxy` and `haproxyssl`, utilizing the `programname` property in rsyslog and the `log-tag` directive in haproxy for precise log management.

The haproxy and haproxyssl instances are two separate systemd config file prepared instances.
haproxy instance is simple haproxy proxying tcp traffic in non-encrypted form, whether haproxyssl is a special instance
prepared to tunnel the incoming http traffic in ssl form. Both instances of haproxy runs as a separate processes on the server.

Here is the systemd configuration of haproxy systemd service file:

# cat /usr/lib/systemd/system/haproxy.service
[Unit]
Description=HAProxy Load Balancer
After=network-online.target
Wants=network-online.target

[Service]
Environment="CONFIG=/etc/haproxy/haproxy.cfg" "PIDFILE=/run/haproxy.pid"
EnvironmentFile=/etc/sysconfig/haproxy
ExecStartPre=/usr/sbin/haproxy -f $CONFIG -c -q $OPTIONS
ExecStart=/usr/sbin/haproxy -Ws -f $CONFIG -p $PIDFILE $OPTIONS
ExecReload=/usr/sbin/haproxy -f $CONFIG -c -q $OPTIONS
ExecReload=/bin/kill -USR2 $MAINPID
SuccessExitStatus=143
KillMode=mixed
Type=notify

[Install]
WantedBy=multi-user.target


As well as the systemd service configuration for haproxyssl:
 

# cat /usr/lib/systemd/system/haproxyssl.service
[Unit]
Description=HAProxy Load Balancer
After=network-online.target
Wants=network-online.target

[Service]
Environment="CONFIG=/etc/haproxy/haproxy_ssl_prod.cfg" "PIDFILE=/run/haproxy_ssl_prod.pid"
EnvironmentFile=/etc/sysconfig/haproxy
ExecStartPre=/usr/sbin/haproxyssl -f $CONFIG -c -q $OPTIONS
ExecStart=/usr/sbin/haproxyssl -Ws -f $CONFIG -p $PIDFILE $OPTIONS
ExecReload=/usr/sbin/haproxyssl -f $CONFIG -c -q $OPTIONS
ExecReload=/bin/kill -USR2 $MAINPID
SuccessExitStatus=143
KillMode=mixed
Type=notify

[Install]
WantedBy=multi-user.target


Step 1: Configuring HAProxy instances with `log-tag`
 

To distinguish between logs from two HAProxy instances, `log-tag` directive is used to add tags to logs. This tag is used to filter these logs in rsyslog.
Modify the HAProxy configuration file in `/etc/haproxy/haproxy.*.cfg`

HAProxy Instance 1 (haproxy)
 

#———————————————————————
# Global settings
#———————————————————————
global
      log          127.0.0.1 local6 debug
      log-tag      haproxy

HAProxy Instance 2 (haproxyssl)


#———————————————————————
# Global settings
#———————————————————————
global
    log          127.0.0.1 local5 debug
    log-tag      haproxyssl


Step 2: Implementing rsyslog configuration for haproxy logs
 

Next, create a new rsyslog configuration file, stored in /etc/rsyslog.d/. Ensure the new configuration file ends in `.conf`

HAProxy Instance 1 (haproxy)

Now add rsyslog rules to filters logs based on the `programname` and the custom log tag:
 

# vi /etc/rsyslog.d/55_haproxy.conf
if $programname == 'haproxy' then /var/log/haproxy.log
&stop

HAProxy Instance 2 (haproxyssl)
# vi /etc/rsyslog.d/51_haproxy_ssl.conf
if $programname == 'haproxy_ssl' then /var/log/haproxy_ssl.log
&stop


These rules filter logs that originate from haproxy  and contain the respective string haproxy   or haproxy_ssl , directing them to their respective log files. The `& stop` directive ensures that rsyslog stops processing the log once a match is found, preventing dublication.

Finally, restart both the haproxy and rsyslog services for the changes to take effect:

# systemctl restart haproxy
# systemctl restart haproxyssl
# systemctl restart rsyslog


Reading References

haproxy:   log-tag directive

rsyslog:    rsyslogd documentation

This is a guest article originally written by: Dimitar Paskalev, guest blogging with good interesting articles is always mostly welcome 

Configure aide file integrity check server monitoring in Zabbix to track for file changes on servers

Tuesday, March 28th, 2023

zabbix-aide-log-monitoring-logo

Earlier I've written a small article on how to setup AIDE monitoring for Server File integrity check on Linux, which put the basics on how this handy software to improve your server overall Security software can be installed and setup without much hassle.

Once AIDE is setup and a preset custom configuration is prepared for AIDE it is pretty useful to configure AIDE to monitor its critical file changes for better server security by monitoring the AIDE log output for new record occurs with Zabbix. Usually if no files monitored by AIDE are modified on the machine, the log size will not grow, but if some file is modified once Advanced Linux Intrusion Detecting (aide) binary runs via the scheduled Cron job, the /var/log/app_aide.log file will grow zabbix-agentd will continuously check the file for size increases and will react.

Before setting up the Zabbix required Template, you will have to set few small scripts that will be reading a preconfigured list of binaries or application files etc. that aide will monitor lets say via /etc/aide-custom.conf
 

1. Configure aide to monitor files for changes


Before running aide, it is a good idea to prepare a file with custom defined directories and files that you plan to monitor for integrity checking e.g. future changes with aide, for example to capture bad intruders who breaks into server which runs aide and modifies critical files such as /etc/passwd /etc/shadow /etc/group or / /usr/local/etc/* or /var/* / /usr/* critical files that shouldn't be allowed to change without the admin to soon find out.

# cat /etc/aide-custom.conf

# Example configuration file for AIDE.
@@define DBDIR /var/lib/aide
@@define LOGDIR /var/log/aide
# The location of the database to be read.
database=file:@@{DBDIR}/app_custom.db.gz
database_out=file:@@{DBDIR}/app_aide.db.new.gz
gzip_dbout=yes
verbose=5

report_url=file:@@{LOGDIR}/app_custom.log
#report_url=syslog:LOG_LOCAL2
#report_url=stderr
#NOT IMPLEMENTED report_url=mailto:root@foo.com
#NOT IMPLEMENTED report_url=syslog:LOG_AUTH

# These are the default rules.
#
#p:      permissions
#i:      inode:
#n:      number of links
#u:      user
#g:      group
#s:      size
#b:      block count
#m:      mtime
#a:      atime
#c:      ctime
#S:      check for growing size
#acl:           Access Control Lists
#selinux        SELinux security context
#xattrs:        Extended file attributes
#md5:    md5 checksum
#sha1:   sha1 checksum
#sha256:        sha256 checksum
#sha512:        sha512 checksum
#rmd160: rmd160 checksum
#tiger:  tiger checksum

#haval:  haval checksum (MHASH only)
#gost:   gost checksum (MHASH only)
#crc32:  crc32 checksum (MHASH only)
#whirlpool:     whirlpool checksum (MHASH only)

FIPSR = p+i+n+u+g+s+m+c+acl+selinux+xattrs+sha256

#R:             p+i+n+u+g+s+m+c+acl+selinux+xattrs+md5
#L:             p+i+n+u+g+acl+selinux+xattrs
#E:             Empty group
#>:             Growing logfile p+u+g+i+n+S+acl+selinux+xattrs

# You can create custom rules like this.
# With MHASH…
# ALLXTRAHASHES = sha1+rmd160+sha256+sha512+whirlpool+tiger+haval+gost+crc32
ALLXTRAHASHES = sha1+rmd160+sha256+sha512+tiger
# Everything but access time (Ie. all changes)
EVERYTHING = R+ALLXTRAHASHES

# Sane, with multiple hashes
# NORMAL = R+rmd160+sha256+whirlpool
NORMAL = FIPSR+sha512

# For directories, don't bother doing hashes
DIR = p+i+n+u+g+acl+selinux+xattrs

# Access control only
PERMS = p+i+u+g+acl+selinux

# Logfile are special, in that they often change
LOG = >

# Just do sha256 and sha512 hashes
LSPP = FIPSR+sha512

# Some files get updated automatically, so the inode/ctime/mtime change
# but we want to know when the data inside them changes
DATAONLY =  p+n+u+g+s+acl+selinux+xattrs+sha256

##############TOUPDATE
#To delegate to app team create a file like /app/aide.conf
#and uncomment the following line
#@@include /app/aide.conf
#Then remove all the following lines
/etc/zabbix/scripts/check.sh FIPSR
/etc/zabbix/zabbix_agentd.conf FIPSR
/etc/sudoers FIPSR
/etc/hosts FIPSR
/etc/keepalived/keepalived.conf FIPSR
# monitor haproxy.cfg
/etc/haproxy/haproxy.cfg FIPSR
# monitor keepalived
/home/keepalived/.ssh/id_rsa FIPSR
/home/keepalived/.ssh/id_rsa.pub FIPSR
/home/keepalived/.ssh/authorized_keys FIPSR

/usr/local/bin/script_to_run.sh FIPSR
/usr/local/bin/another_script_to_monitor_for_changes FIPSR

#  cat /usr/local/bin/aide-config-check.sh
#!/bin/bash
/sbin/aide -c /etc/aide-custom.conf -D

# cat /usr/local/bin/aide-init.sh
#!/bin/bash
/sbin/aide -c /etc/custom-aide.conf -B database_out=file:/var/lib/aide/custom-aide.db.gz -i


# cat /usr/local/bin/aide-check.sh

#!/bin/bash
/sbin/aide -c /etc/custom-aide.conf -Breport_url=stdout -B database=file:/var/lib/aide/custom-aide.db.gz -C|/bin/tee -a /var/log/aide/custom-aide-check.log|/bin/logger -t custom-aide-check-report
/usr/local/bin/aide-init.sh


# cat /usr/local/bin/aide_app_cron_daily.txt

#!/bin/bash
#If first time, we need to init the DB
if [ ! -f /var/lib/aide/app_aide.db.gz ]
   then
    logger -p local2.info -t app-aide-check-report  "Generating NEW AIDE DATABASE for APPLICATION"
    nice -n 18 /sbin/aide –init -c /etc/aide_custom.conf
    mv /var/lib/aide/app_aide.db.new.gz /var/lib/aide/app_aide.db.gz
fi

nice -n 18 /sbin/aide –update -c /etc/aide_app.conf
#since the option for syslog seems not fully implemented we need to push logs via logger
/bin/logger -f /var/log/aide/app_aide.log -p local2.info -t app-aide-check-report
#Acknoledge the new database as the primary (every results are sended to syslog anyway)
mv /var/lib/aide/app_aide.db.new.gz /var/lib/aide/app_aide.db.gz

What above cron job does is pretty simple, as you can read it yourself. If the configuration predefined aide database store file /var/lib/aide/app_aide.db.gz, does not
exists aide will create its fresh empty database and generate a report for all predefined files with respective checksums to be stored as a comparison baseline for file changes. 

Next there is a line to write aide file changes via rsyslog through the logger and local2.info handler


2. Setup Zabbix Template with Items, Triggers and set Action

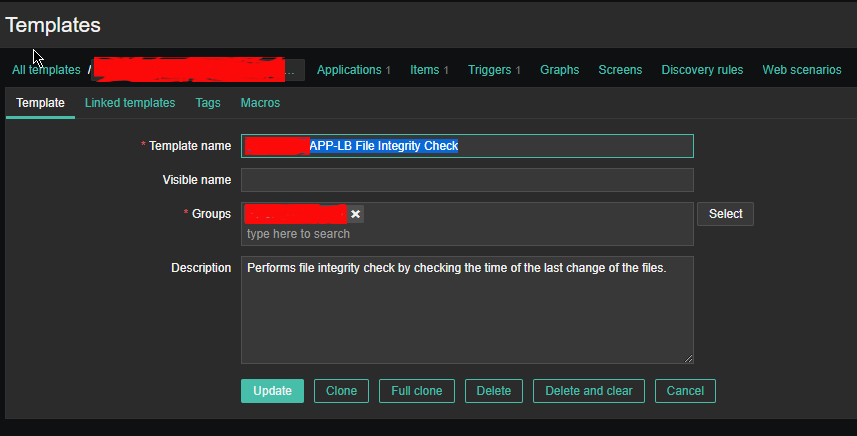
2.1 Create new Template and name it YourAppName APP-LB File integrity Check

aide-itengrity-check-zabbix_ Configuration of templates

Then setup the required Items, that will be using zabbix's Skip embedded function to scan file in a predefined period of file, this is done by the zabbix-agent that is
supposed to run on the server.

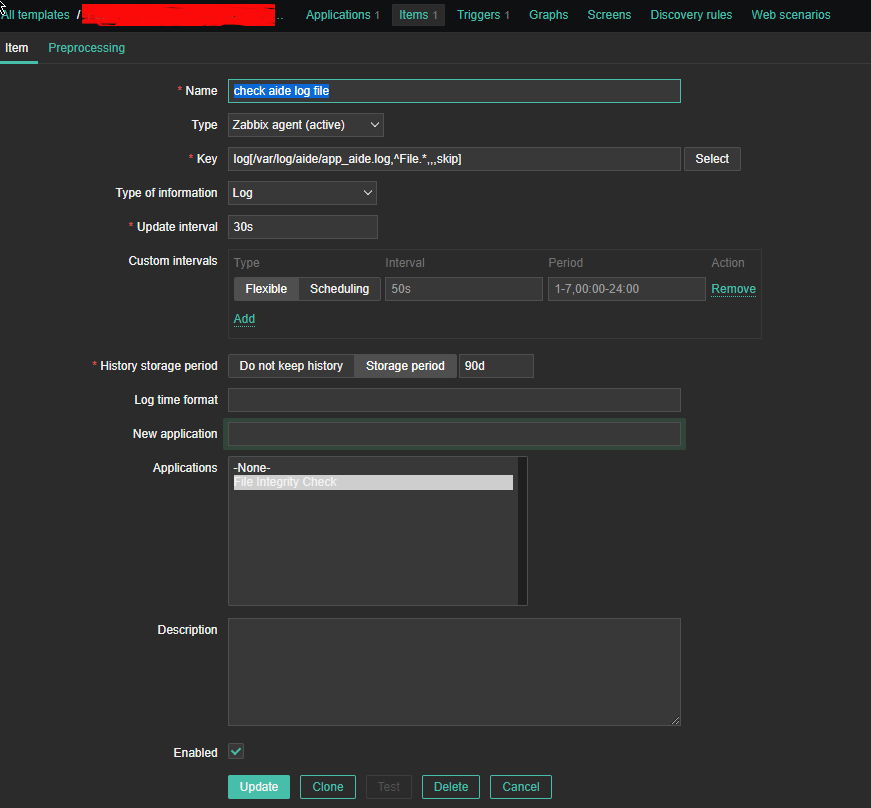
2.2 Configure Item like

aide-zabbix-triggers-screenshot
 

*Name: check aide log file

Type: zabbix (active)

log[/var/log/aide/app_aide.log,^File.*,,,skip]

Type of information: Log

Update Interval: 30s

Applications: File Integrity Check

Configure Trigger like

Enabled: Tick On

images/aide-zabbix-screenshots/check-aide-log-item


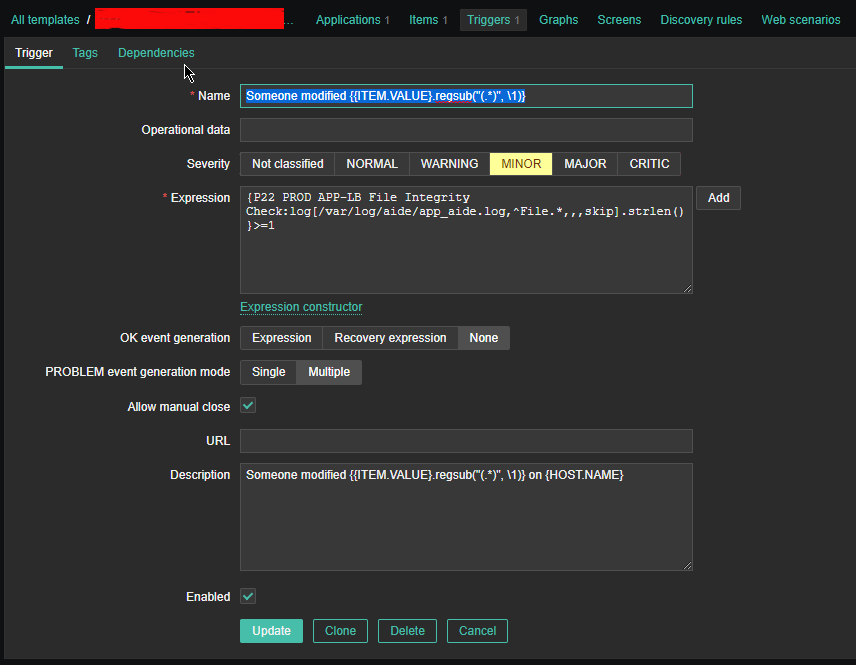
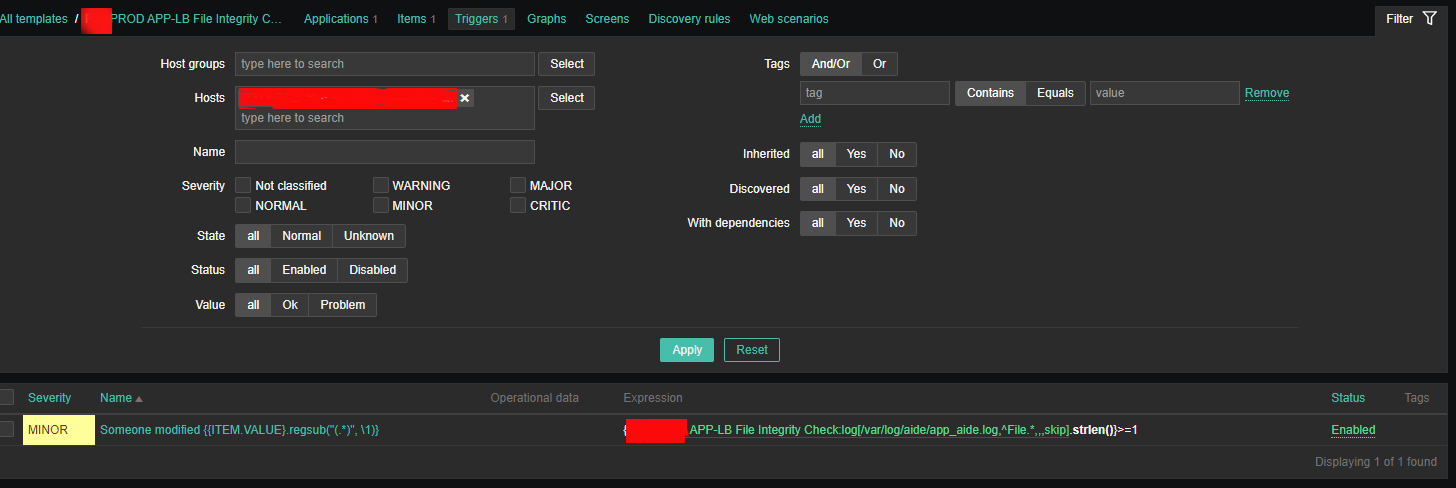
2.3 Create Triggers with the respective regular expressions, that would check the aide generated log file for file modifications


aide-zabbix-screenshot-minor-config

Configure Trigger like
 

Enabled: Tick On


*Name: Someone modified {{ITEM.VALUE}.regsub("(.*)", \1)}

*Expression: {PROD APP-LB File Integrity Check:log[/var/log/aide/app_aide.log,^File.*,,,skip].strlen()}>=1

Allow manual close: yes tick

*Description: Someone modified {{ITEM.VALUE}.regsub("(.*)", \1)} on {HOST.NAME}


2.4 Configure Action


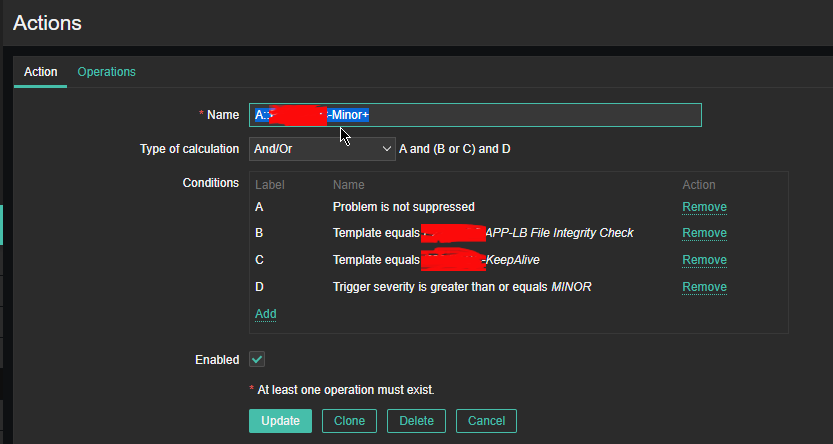
aide-zabbix-file-monitoring-action-screensho

Now assuming the Zabbix server has  a properly set media for communication and you set Alerting rules zabbix-server can be easily set tosend mails to a Support email to get Notifications Alerts, everytime a monitored file by aide gets changed.

That's all folks ! Enjoy being notified on every file change on your servers  !
 

Enable zabbix agent to work with SeLinux enabled on CentOS 7 Linux

Wednesday, October 19th, 2022

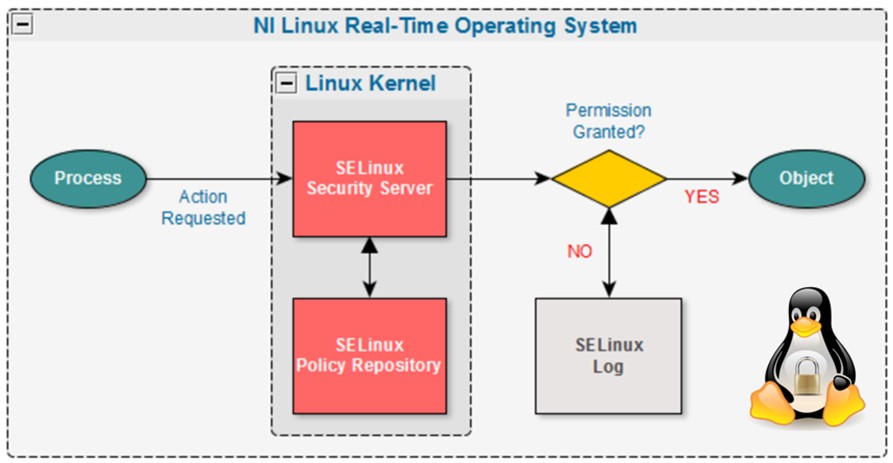
If you have the task to install and use zabbix-agent or zabbix-proxy to report to zabbix-server on CentOS 7 with enabled SeLinux services for security reasons and you have no mean to disable the selinux which is a common step to take under this circumstances, you will have to add the zabbix services to be exluded as permissive in selinux. In below article I'll show you how this is done in few easy steps.

zabbix-agent-service-selinux-linux-real-time-operating-sytems


1. Check the system sestatus

[root@linux zabbix]# sestatus
SELinux status:                 enabled
SELinuxfs mount:                /sys/fs/selinux
SELinux root directory:         /etc/selinux
Loaded policy name:             targeted
Current mode:                   enforcing
Mode from config file:          enforcing

Policy MLS status:              enabled
Policy deny_unknown status:     allowed
Max kernel policy version:      28


2. Enable zabbix to be permissive in selinux

To be able to set zabbix to be in permissive mode as well as for further troubleshooting if you have to enable other  linux services inside selinux you have to install below RPM packs.

[root@linux zabbix]# yum install setroubleshoot.x86_64 setools.x86_64 setools-console.x86_64 policycoreutils-python.x86_64

Set the zabbix permissive exclude rule in SeLINUX

[root@linux zabbix]# semanage permissive –add zabbix_t

Re-run the zabbix proxy (if you have a local zabbix-proxy running and the zabbix-agent)

[root@linux zabbix]# systemctl start zabbix-proxy.service

[root@linux zabbix]# systemctl start zabbix-agent.service

[root@linux zabbix]# systemctl status zabbix-agent
● zabbix-agent.service – Zabbix Agent
   Loaded: loaded (/usr/lib/systemd/system/zabbix-agent.service; enabled; vendor preset: disabled)
   Active: active (running) since Tue 2022-10-18 09:30:16 CEST; 1 day 7h ago
 Main PID: 962952 (zabbix_agentd)
    Tasks: 6 (limit: 100884)
   Memory: 5.1M
   CGroup: /system.slice/zabbix-agent.service
           ├─962952 /usr/sbin/zabbix_agentd -c /etc/zabbix/zabbix_agentd.conf
           ├─962955 /usr/sbin/zabbix_agentd: collector [idle 1 sec]
           ├─962956 /usr/sbin/zabbix_agentd: listener #1 [waiting for connection]
           ├─962957 /usr/sbin/zabbix_agentd: listener #2 [waiting for connection]
           ├─962958 /usr/sbin/zabbix_agentd: listener #3 [waiting for connection]
           └─962959 /usr/sbin/zabbix_agentd: active checks #1 [idle 1 sec]

Oct 18 09:30:16 linux systemd[1]: Starting Zabbix Agent…
Oct 18 09:30:16 linux systemd[1]: Started Zabbix Agent.

3. Check inside audit logs all is OK

To make sure zabbix is really enabled to be omitted by selinux rules check audit.log

[root@linux zabbix]# grep zabbix_proxy /var/log/audit/audit.log

That's all folks, Enjoy ! 🙂

How to configure multiple haproxies and frontends to log in separate log files via rsyslog

Monday, September 5th, 2022

log-multiple-haproxy-servers-to-separate-files-log-haproxy-froentend-to-separate-file-haproxy-rsyslog-Logging-diagram
In my last article How to create multiple haproxy instance separate processes for different configuration listeners,  I've shortly explained how to create a multiple instances of haproxies by cloning the systemd default haproxy.service and the haproxy.cfg to haproxyX.cfg.
But what if you need also to configure a separate logging for both haproxy.service and haproxy-customname.service instances how this can be achieved?

The simplest way is to use some system local handler staring from local0 to local6, As local 1,2,3 are usually used by system services a good local handler to start off would be at least 4.
Lets say we already have the 2 running haproxies, e.g.:

[root@haproxy2:/usr/lib/systemd/system ]# ps -ef|grep -i hapro|grep -v grep
root      128464       1  0 Aug11 ?        00:01:19 /usr/sbin/haproxy -Ws -f /etc/haproxy/haproxy.cfg -p /run/haproxy.pid -S /run/haproxy-master.sock
haproxy   128466  128464  0 Aug11 ?        00:49:29 /usr/sbin/haproxy -Ws -f /etc/haproxy/haproxy.cfg -p /run/haproxy.pid -S /run/haproxy-master.sock

root      346637       1  0 13:15 ?        00:00:00 /usr/sbin/haproxy-customname-wrapper -Ws -f /etc/haproxy/haproxy_customname_prod.cfg -p /run/haproxy_customname_prod.pid -S /run/haproxy-customname-master.sock
haproxy   346639  346637  0 13:15 ?        00:00:00 /usr/sbin/haproxy-customname-wrapper -Ws -f /etc/haproxy/haproxy_customname_prod.cfg -p /run/haproxy_customname_prod.pid -S /run/haproxy-customname-master.sock


1. Configure local messaging handlers to work via /dev/log inside both haproxy instance config files
 

To congigure the separte logging we need to have in /etc/haproxy/haproxy.cfg and in /etc/haproxy/haproxy_customname_prod.cfg the respective handlers.

To log in separate files you should already configured in /etc/haproxy/haproxy.cfg something like:


global
        stats socket /var/run/haproxy/haproxy.sock mode 0600 level admin #Creates Unix-Like socket to fetch stats
        log /dev/log    local0
        log /dev/log    local1 notice

#       nbproc 1
#       nbthread 2
#       cpu-map auto:1/1-2 0-1
        nbproc          1
        nbthread 2
        cpu-map         1 0
        cpu-map         2 1
        chroot /var/lib/haproxy
        user haproxy
        group haproxy
        daemon
        maxconn 99999

defaults
        log     global
        mode    tcp


        timeout connect 5000
        timeout connect 30s
        timeout server 10s

    timeout queue 5s
    timeout tunnel 2m
    timeout client-fin 1s
    timeout server-fin 1s

    option forwardfor
        maxconn 3000
    retries                 15

frontend http-in
        mode tcp

        option tcplog
        log global


        option logasap
        option forwardfor
        bind 0.0.0.0:80

default_backend webservers_http
backend webservers_http
    fullconn 20000
        balance source
stick match src
    stick-table type ip size 200k expire 30m

        server server-1 192.168.1.50:80 check send-proxy weight 255 backup
        server server-2 192.168.1.54:80 check send-proxy weight 254
        server server-3 192.168.0.219:80 check send-proxy weight 252 backup
        server server-4 192.168.0.210:80 check send-proxy weight 253 backup
        server server-5 192.168.0.5:80 maxconn 3000 check send-proxy weight 251 backup

For the second /etc/haproxy/haproxy_customname_prod.cfg the logging configuration should be similar to:
 

global
        stats socket /var/run/haproxy/haproxycustname.sock mode 0600 level admin #Creates Unix-Like socket to fetch stats
        log /dev/log    local5
        log /dev/log    local5 notice

#       nbproc 1
#       nbthread 2
#       cpu-map auto:1/1-2 0-1
        nbproc          1
        nbthread 2
        cpu-map         1 0
        cpu-map         2 1
        chroot /var/lib/haproxy
        user haproxy
        group haproxy
        daemon
        maxconn 99999

defaults
        log     global
        mode    tcp


2. Configure separate haproxy Frontend logging via local5 inside haproxy.cfg
 

As a minimum you need a configuration for frontend like:


frontend http-in
        mode tcp

        option tcplog
        log /dev/log    local5 debug
…..
….

..
.

Of course the mode tcp in my case is conditional you might be using mode http etc. 


3. Optionally but (preferrably) make local5 / local6 handlers to work via rsyslogs UDP imudp protocol


In this example /dev/log is straightly read by haproxy instead of sending the messages first to rsyslog, this is a good thing in case if you have doubts that rsyslog might stop working and respectively you might end up with no logging, however if you prefer to use instead rsyslog which most of people usually do you will have instead for /etc/haproxy/haproxy.cfg to use config:

global
    log          127.0.0.1 local6 debug

defaults
        log     global
        mode    tcp

And for /etc/haproxy_customname_prod.cfg config like:

global
    log          127.0.0.1 local5 debug

defaults
        log     global
        mode    tcp

If you're about to send the haproxy logs directly via rsyslog, it should have enabled in /etc/rsyslog.conf the imudp module if you're not going to use directly /dev/log

# provides UDP syslog reception
module(load="imudp")
input(type="imudp" port="514")


4. Prepare first and second log file and custom frontend output file and set right permissions
 

Assumably you already have /var/log/haproxy.log and this will be the initial haproxy log if you don't want to change it, normally it is installed on haproxy package install time on Linux and should have some permissions like following:

root@haproxy2:/etc/rsyslog.d# ls -al /var/log/haproxy.log
-rw-r–r– 1 haproxy haproxy 6681522  1 сеп 16:05 /var/log/haproxy.log


To create the second config with exact permissions like haproxy.log run:

root@haproxy2:/etc/rsyslog.d# touch /var/log/haproxy_customname.log
root@haproxy2:/etc/rsyslog.d# chown haproxy:haproxy /var/log/haproxy_customname.log

Create the haproxy_custom_frontend.log file that will only log output of exact frontend or match string from the logs
 

root@haproxy2:/etc/rsyslog.d# touch  /var/log/haproxy_custom_frontend.log
root@haproxy2:/etc/rsyslog.d# chown haproxy:haproxy  /var/log/haproxy_custom_frontend.log


5. Create the rsyslog config for haproxy.service to log via local6 to /var/log/haproxy.log
 

root@haproxy2:/etc/rsyslog.d# cat 49-haproxy.conf
# Create an additional socket in haproxy's chroot in order to allow logging via
# /dev/log to chroot'ed HAProxy processes
$AddUnixListenSocket /var/lib/haproxy/dev/log

# Send HAProxy messages to a dedicated logfile
:programname, startswith, "haproxy" {
  /var/log/haproxy.log
  stop
}


Above configs will make anything returned with string haproxy (e.g. proccess /usr/sbin/haproxy) to /dev/log to be written inside /var/log/haproxy.log and trigger a stop (by the way the the stop command works exactly as the tilda '~' discard one, except in some newer versions of haproxy the ~ is no now obsolete and you need to use stop instead (bear in mind that ~ even though obsolete proved to be working for me whether stop not ! but come on this is no strange this is linux mess), for example if you run latest debian Linux 11 as of September 2022 haproxy with package 2.2.9-2+deb11u3.
 

6. Create configuration for rsyslog to log from single Frontend outputting local2 to /var/log/haproxy_customname.log
 

root@haproxy2:/etc/rsyslog.d# cat 48-haproxy.conf
# Create an additional socket in haproxy's chroot in order to allow logging via
# /dev/log to chroot'ed HAProxy processes
$AddUnixListenSocket /var/lib/haproxy/dev/log

# Send HAProxy messages to a dedicated logfile
#:programname, startswith, "haproxy" {
#  /var/log/haproxy.log
#  stop
#}
# GGE/DPA 2022/08/02: HAProxy logs to local2, save the messages
local5.*                                                /var/log/haproxy_customname.log


You might also explicitly define the binary that will providing the logs inside the 48-haproxy.conf as we have a separate /usr/sbin/haproxy-customname-wrapper in that way you can log the output from the haproxy instance only based
on its binary command and you can omit writting to local5 to log via it something else 🙂

root@haproxy2:/etc/rsyslog.d# cat 48-haproxy.conf
# Create an additional socket in haproxy's chroot in order to allow logging via
# /dev/log to chroot'ed HAProxy processes
$AddUnixListenSocket /var/lib/haproxy/dev/log

# Send HAProxy messages to a dedicated logfile
#:programname, startswith, "haproxy" {
#  /var/log/haproxy.log
#  stop
#}
# GGE/DPA 2022/08/02: HAProxy logs to local2, save the messages

:programname, startswith, "haproxy-customname-wrapper " {
 
/var/log/haproxy_customname.log
  stop
}


7. Create the log file to log the custom frontend of your preference e.g. /var/log/haproxy_custom_frontend.log under local5 /prepare rsyslog config for
 

root@haproxy2:/etc/rsyslog.d# cat 47-haproxy-custom-frontend.conf
$ModLoad imudp
$UDPServerAddress 127.0.0.1
$UDPServerRun 514
#2022/02/02: HAProxy logs to local6, save the messages
local4.*                                                /var/log/haproxy_custom_frontend.log
:msg, contains, "https-in" ~

The 'https-in' is my frontend inside /etc/haproxy/haproxy.cfg it returns the name of it every time in /var/log/haproxy.log therefore I will log the frontend to local5 and to prevent double logging inside /var/log/haproxy.log of connections incoming towards the same frontend inside /var/log/haproxy.log, I have the tilda symbol '~' which instructs rsyslog to discard any message coming to rsyslog with "https-in" string in, immediately after the same frontend as configured inside /etc/haproxy/haproxy.cfg will output the frontend operations inside local5.


!!! Note that for rsyslog it is very important to have the right order of configurations, the configuration order is being considered based on the file numbering. !!!
 

Hence notice that my filter file number 47_* preceeds the other 2 configured rsyslog configs.
 

root@haproxy2:/etc/rsyslog.d# ls -1
47-haproxy-custom-frontend.conf
48-haproxy.conf
49-haproxy.conf

This will make 47-haproxy-custom-frontend.conf to be read and processed first 48-haproxy.conf processed second and 49-haproxy.conf processed third.


8. Reload rsyslog and haproxy and test


root@haproxy2: ~# systemctl restart rsyslog
root@haproxy2: ~# systemctl restart haproxy
root@haproxy2: ~# systemctl status rsyslog

● rsyslog.service – System Logging Service
     Loaded: loaded (/lib/systemd/system/rsyslog.service; enabled; vendor preset: enabled)
     Active: active (running) since Thu 2022-09-01 17:34:51 EEST; 1s ago
TriggeredBy: ● syslog.socket
       Docs: man:rsyslogd(8)
             man:rsyslog.conf(5)
             https://www.rsyslog.com/doc/
   Main PID: 372726 (rsyslogd)
      Tasks: 6 (limit: 4654)
     Memory: 980.0K
        CPU: 8ms
     CGroup: /system.slice/rsyslog.service
             └─372726 /usr/sbin/rsyslogd -n -iNONE

сеп 01 17:34:51 haproxy2 systemd[1]: Stopped System Logging Service.
сеп 01 17:34:51 haproxy2 rsyslogd[372726]: warning: ~ action is deprecated, consider using the 'stop' statement instead [v8.210>
сеп 01 17:34:51 haproxy2 systemd[1]: Starting System Logging Service…
сеп 01 17:34:51 haproxy2 rsyslogd[372726]: [198B blob data]
сеп 01 17:34:51 haproxy2 systemd[1]: Started System Logging Service.
сеп 01 17:34:51 haproxy2 rsyslogd[372726]: [198B blob data]
сеп 01 17:34:51 haproxy2 rsyslogd[372726]: imuxsock: Acquired UNIX socket '/run/systemd/journal/syslog' (fd 3) from systemd.  [>
сеп 01 17:34:51 haproxy2 rsyslogd[372726]: [origin software="rsyslogd" swVersion="8.2102.0" x-pid="372726" x-info="https://www.

Do some testing with some tool like curl / wget / lynx / elinks etc. on each of the configured haproxy listeners and frontends and check whether everything ends up in the correct log files.
That's all folks enjoy ! 🙂
 

How to create multiple haproxy instance separate processes for different configuration listeners with systemd on single Linux server

Tuesday, August 30th, 2022

HAProxy-Multiple-instanes-with-systemd-on-same-host-howto-Load-Balance-Your-Servers

In this aticle will be explained, howto configure multiple haproxy instances with separate haproxy binary wrappers and configs to run on the same Linux server host
by creating and using systemd additional .services.

Usually haproxy as installed and  ran standard on Linux swapns 2 listener processes which are configured to serve any proxy configuration setup inside /etc/haproxy/haproxy.cfg.

Here is example:

[root@haproxy2:~ ]# ps -ef|grep -i haproxy
root      128464       1  0 Aug11 ?        00:01:19 /usr/sbin/haproxy -Ws -f /etc/haproxy/haproxy.cfg -p /run/haproxy.pid -S /run/haproxy-master.sock
haproxy   128466  128464  0 Aug11 ?        00:49:24 /usr/sbin/haproxy -Ws -f /etc/haproxy/haproxy.cfg -p /run/haproxy.pid -S /run/haproxy-master.sock

However what if you need to have a multiple services to be proxied and you need to have multiple configuration files separated under various
/etc/haproxy/ stored files (.e.g /etc/haproxy/haproxy-customer1.cfg /etc/haproxy-customer2.cfg /etc/haproxy-custmXYZ.fg) etc. , what then how this can be done ?

Besides the many down sides of involving systemd into Linux, there is some good sides of it, as on any modern Linux there is a separate service to manage haproxy as of year 2022 on most modern Linuxes Debian / CentOS / Redhat the location where usually systemd service scripts are located is under directory /usr/lib/systemd/system/ the systemd managed service files are with extension .service

[root@haproxy2:/usr/lib/systemd/system ]# ls -al haproxy.service
-rw-r–r– 1 root root 1509 Sep  5  2021 haproxy.service

[root@haproxy2:/usr/lib/systemd/system ]# ls -al cron.service
-rw-r–r– 1 root root 316 Feb 23  2021 cron.service

[root@haproxy2:/usr/lib/systemd/system ]# ls -al networking.service
-rw-r–r– 1 root root 643 Sep 21  2020 networking.service

[root@haproxy2:/usr/lib/systemd/system ]# ls -al systemd-journald.service
-rw-r–r– 1 root root 1812 Jul 13  2021 systemd-journald.service


1. Create new haproxy-custom.service and /etc/haproxy.cfg file copies
 

Adding new services that will be managed by systemd is pretty simple hence, you just need to have the original service file in that case this is haproxy.service and modify it a bit, original haproxy.service file on Red Hat Enterprise Linux release 8.5 (Ootpa) would look like this

Make exact copy of haproxy.service to haproxy-your-custom.service

[root@haproxy2:/usr/lib/systemd/system ]#  cp -vprf haproxy.service haproxy-customname.service
'haproxy.service' -> 'haproxy-customname.service'

[root@haproxy2:/usr/lib/systemd/system]# cp -vrpf /etc/haproxy/haproxy.cfg /etc/haproxy/haproxy_customname_prod.cfg
'/etc/haproxy/haproxy.cfg' -> '/etc/haproxy/haproxy_customname_prod.cfg'


2. Modify the new haproxy-customname.service and haproxy-custoname.cfg

a) Create hardlink copy of /usr/sbin/haproxy binary

It is a good idea to separte the haproxy executable binary for the additional systemd haproxy instance. This can be done either by copying /usr/sbin/haproxy to something like /usr/sbin/haproxy-customname-wrapper or by creating a hard link. As i'm cautious to keep the haproxy-customname-wrapper binary up2date and updated together once the haproxy rpm package / deb package is updated either with yum or apt depending on the Linux distro, hard link  use is always better.
Just for reference hardlink does keep an own copy of the binary data and occupies additional Filesystem inodes, but at the same time the first inode of the binary does point to the original binary, meaning that a package update will make the hardlink be updated up to the latest version of the file and no extra management of the hard linked haproxy-customname-wrapper is necessery.

[root@haproxy2:/usr/sbin ]# ln haproxy haproxy-custname-wrapper

[root@haproxy2:/usr/sbin ]#  ls -al haproxy-custname-wrapper
-rwxr-xr-x 2 root root 2541848 Sep  5  2021 haproxy-custname-wrapper*
root@haproxy2:/usr/sbin# ls -al haproxy
-rwxr-xr-x 2 root root 2541848 Sep  5  2021 haproxy*


b) Modify haproxy-custoname.service systemd instance

The original service file will have content like

[Unit]
Description=HAProxy Load Balancer
After=network-online.target
Wants=network-online.target

[Service]
Environment="CONFIG=/etc/haproxy/haproxy.cfg" "PIDFILE=/run/haproxy.pid"
EnvironmentFile=/etc/sysconfig/haproxy
ExecStartPre=/usr/sbin/haproxy -f $CONFIG -c -q $OPTIONS
ExecStart=/usr/sbin/haproxy -Ws -f $CONFIG -p $PIDFILE $OPTIONS
ExecReload=/usr/sbin/haproxy -f $CONFIG -c -q $OPTIONS

ExecReload=/bin/kill -USR2 $MAINPID
SuccessExitStatus=143
KillMode=mixed
Type=notify

[Install]
WantedBy=multi-user.target


The modified one for the customname.service should have content similar to:
 

[Unit]
Description=HAProxy Load Balancer
After=network-online.target
Wants=network-online.target

[Service]
Environment="CONFIG=/etc/haproxy/haproxy_customname_prod.cfg" "PIDFILE=/run/haproxy_customname_prod.pid"
EnvironmentFile=/etc/sysconfig/haproxy
ExecStartPre=/usr/sbin/haproxy_customname -f $CONFIG -c -q $OPTIONS
ExecStart=/usr/sbin/haproxy_customname -Ws -f $CONFIG -p $PIDFILE $OPTIONS
ExecReload=/usr/sbin/haproxy_customname -f $CONFIG -c -q $OPTIONS

ExecReload=/bin/kill -USR2 $MAINPID
SuccessExitStatus=143
KillMode=mixed
Type=notify

[Install]
WantedBy=multi-user.target

c) modify haproxy_customname_prod.cfg

Do the required config and save the file, below is minimal config sample:

[root@haproxy2:/etc/haproxy ]#  vim /etc/haproxy/haproxy_customname_prod.cfg
 

#———————————————————————
# Global settings
#———————————————————————
global
    log          127.0.0.1 local6 debug
    chroot       /var/lib/haproxy
    pidfile      /run/haproxy.pid
    stats socket /var/lib/haproxy/haproxy.sock mode 0600 level admin
    maxconn      4000
    user         haproxy
    group        haproxy
    daemon
    #debug
    #quiet

#———————————————————————
# common defaults that all the 'listen' and 'backend' sections will
# use if not designated in their block
#———————————————————————
defaults
    mode        tcp
    log         global
#    option      dontlognull
#    option      httpclose
#    option      httplog
#    option      forwardfor
    option      redispatch
    option      log-health-checks
    timeout connect 10000 # default 10 second time out if a backend is not found
    timeout client 300000
    timeout server 300000
    maxconn     60000
    retries     3


#———————————————————————
# round robin balancing between the various backends
#———————————————————————

frontend Frotnend_customname1
        bind 10.10.10.1:15000
        mode tcp
        option tcplog
        #log global
        log-format [%t]\ %ci:%cp\ %bi:%bp\ %b/%s:%sp\ %Tw/%Tc/%Tt\ %B\ %ts\ %ac/%fc/%bc/%sc/%rc\ %sq/%bq

       default_backend Frontend_customname1

backend Frontend_customname1
        balance roundrobin
        timeout client 350000
        timeout server 350000
        timeout connect 35000
        server backend-server1 10.10.10.50:15000 weight 1 check port 15000
        server backend-server2 10.10.10.51:15000 weight 2  check port 15000


3. Reload systemd to make haproxy-customname.service known to systemctl, restart the freshly created service
and check its status


a) Execute daemon-reload to refresh known .service files in systemd

[root@haproxy2:/etc/haproxy ]# systemctl daemon-reload
[root@haproxy2:/etc/haproxy ]#


b) Restart haproxy-customname

[root@haproxy2:/usr/lib/systemd/system ]# systemctl restart haproxy-customname
[root@haproxy2:/usr/lib/systemd/system ]#

c) Check status is active running and process is properly forked

[root@haproxy2:/usr/lib/systemd/system ]# systemctl status haproxy-customname
● haproxy-customname.service – HAProxy Load Balancer
     Loaded: loaded (/lib/systemd/system/haproxy-customname.service; disabled; vendor preset: enabled)
     Active: active (running) since Tue 2022-08-30 13:15:35 EEST; 16s ago
       Docs: man:haproxy(1)
             file:/usr/share/doc/haproxy/configuration.txt.gz
    Process: 346635 ExecStartPre=/usr/sbin/haproxy-customname-wrapper -f $CONFIG -c -q $EXTRAOPTS (code=exited, status=0/SUCCES>
   Main PID: 346637 (haproxy-customn)
      Tasks: 3 (limit: 4654)
     Memory: 14.5M
        CPU: 68ms
     CGroup: /system.slice/haproxy-customname.service
             ├─346637 /usr/sbin/haproxy-customname-wrapper -Ws -f /etc/haproxy/haproxy_customname_prod.cfg -p /run/haproxy_cust>
             └─346639 /usr/sbin/haproxy-customname-wrapper -Ws -f /etc/haproxy/haproxy_customname_prod.cfg -p /run/haproxy_cust>

Aug 30 13:15:35 haproxy2 haproxy-customname-wrapper[346637]:    | timeouts are set to a non-zero value: 'client', 'connect', 's>
Aug 30 13:15:35 haproxy2 haproxy-customname-wrapper[346637]: [NOTICE] 241/131535 (346637) : New worker #1 (346639) forked
Aug 30 13:15:35 haproxy2 haproxy-customname-wrapper[346637]: Proxy webservers_http started.
Aug 30 13:15:35 haproxy2 haproxy-customname-wrapper[346637]: Proxy https-in started.
Aug 30 13:15:35 haproxy2 haproxy-customname-wrapper[346637]: Proxy webservers-https started.
Aug 30 13:15:35 haproxy2 haproxy-customname-wrapper[346637]: Proxy stats started.

The new haproxy-customname.service processes will be visible in process list together with the normal haproxy.service spawned processes:

[root@haproxy2:/usr/lib/systemd/system ]# ps -ef|grep -i hapro|grep -v grep
root      128464       1  0 Aug11 ?        00:01:19 /usr/sbin/haproxy -Ws -f /etc/haproxy/haproxy.cfg -p /run/haproxy.pid -S /run/haproxy-master.sock
haproxy   128466  128464  0 Aug11 ?        00:49:29 /usr/sbin/haproxy -Ws -f /etc/haproxy/haproxy.cfg -p /run/haproxy.pid -S /run/haproxy-master.sock

root      346637       1  0 13:15 ?        00:00:00 /usr/sbin/haproxy-customname-wrapper -Ws -f /etc/haproxy/haproxy_customname_prod.cfg -p /run/haproxy_customname_prod.pid -S /run/haproxy-customname-master.sock
haproxy   346639  346637  0 13:15 ?        00:00:00 /usr/sbin/haproxy-customname-wrapper -Ws -f /etc/haproxy/haproxy_customname_prod.cfg -p /run/haproxy_customname_prod.pid -S /run/haproxy-customname-master.sock


Following the same steps you can create as many separate haproxy instances as you like, but you have to be cautious not to intermix the listener ports for frontends. There is always risk when you copy from the original /etc/haproxy/haproxy.cfg to /etc/haproxy/haproxy-whatever.cfg to forget to change the listen port addresses in new config. 
Also note, that you might have problems, if you exceeed the usual maximum number of ports  65535 by using a high port ranges in the listeneres and due to that your additional systemd instances might refuse to start.

If you need to create a multiple bunch of systemd separte instances and haproxy configurations you can write easily a small script in bash that does this steps automatically.
Hope this article helped someone. If so drop me a thanks email or do your appreatiation for my blog by supporting my patreon.

Cheers ! 🙂

How to disable appArmor automatically installed and loaded after Linux Debian 10 to 11 Upgrade. Disable Apparmour on Deb based Linux

Friday, January 28th, 2022

check-apparmor-status-linux-howto-disable-Apparmor_on-debian-ubuntu-mint-and-other-deb-based-linux-distributions

I've upgraded recently all my machines from Debian Buster Linux 10 to Debian 11 Bullseye (if you wonder what Bullseye is) this is one of the heroes of Disneys Toy Stories which are used for a naming of General Debian Distributions.
After the upgrade most of the things worked expected, expect from some stuff like MariaDB (MySQL) and other weirdly behaving services. After some time of investigation being unable to find out what was causing the random issues observed on the machines. I finally got the strange daemon improper functioning and crashing was caused by AppArmor.

AppArmor ("Application Armor") is a Linux kernel security module that allows the system administrator to restrict programs' capabilities with per-program profiles. Profiles can allow capabilities like network access, raw socket access, and the permission to read, write, or execute files on matching paths. AppArmor supplements the traditional Unix discretionary access control (DAC) model by providing mandatory access control (MAC). It has been partially included in the mainline Linux kernel since version 2.6.36 and its development has been supported by Canonical since 2009.

The general idea of apparmor is wonderful as it could really strengthen system security, however it should be setup on install time and not setup on update time. For one more time I got convinced myself that upgrading from version to version to keep up to date with security is a hard task and often the results are too much unexpected and a better way to upgrade from General version to version any modern Linux / Unix distribution (and their forked mobile equivalents Android etc.) is to just make a copy of the most important configuration, setup the services on a freshly new installed machine be it virtual or a physical Server and rebuild the whole system from scratch, test and then run the system in production, substituting the old server general version with the new machine. 

The rest is leading to so much odd issues like this time with AppArmors causing distractions on the servers hosted applications.

But enough rent if you're unlucky and unwise enough to try to Upgrade Debian / Ubuntu 20, 21 / Mint 18, 19 etc. or whatever Deb distro from older general release to a newer One. Perhaps the best first thing to do onwards is stop and remove AppArmor (those who are hardcore enthusiasts could try to enable the failing services due to apparmor), by disabling the respective apparmor hardening profile but i did not have time to waste on stupid stuff and experiment so I preferred to completely stop it. 

To identify the upgrade oddities has to deal with apparmors service enabled security protections you should be able to find respective records inside /var/log/messages as well as in /var/log/audit/audit.log


# dmesg

[   64.210463] audit: type=1400 audit(1548120161.662:21): apparmor="DENIED" operation="sendmsg" info="Failed name lookup – disconnected path" error=-13 profile="/usr/sbin/mysqld" name="run/systemd/notify" pid=2527 comm="mysqld" requested_mask="w" denied_mask="w" fsuid=113 ouid=0
[  144.364055] audit: type=1400 audit(1548120241.595:22): apparmor="DENIED" operation="sendmsg" info="Failed name lookup – disconnected path" error=-13 profile="/usr/sbin/mysqld" name="run/systemd/notify" pid=2527 comm="mysqld" requested_mask="w" denied_mask="w" fsuid=113 ouid=0
[  144.465883] audit: type=1400 audit(1548120241.699:23): apparmor="DENIED" operation="sendmsg" info="Failed name lookup – disconnected path" error=-13 profile="/usr/sbin/mysqld" name="run/systemd/notify" pid=2527 comm="mysqld" requested_mask="w" denied_mask="w" fsuid=113 ouid=0
[  144.566363] audit: type=1400 audit(1548120241.799:24): apparmor="DENIED" operation="sendmsg" info="Failed name lookup – disconnected path" error=-13 profile="/usr/sbin/mysqld" name="run/systemd/notify" pid=2527 comm="mysqld" requested_mask="w" denied_mask="w" fsuid=113 ouid=0
[  144.666722] audit: type=1400 audit(1548120241.899:25): apparmor="DENIED" operation="sendmsg" info="Failed name lookup – disconnected path" error=-13 profile="/usr/sbin/mysqld" name="run/systemd/notify" pid=2527 comm="mysqld" requested_mask="w" denied_mask="w" fsuid=113 ouid=0
[  144.767069] audit: type=1400 audit(1548120241.999:26): apparmor="DENIED" operation="sendmsg" info="Failed name lookup – disconnected path" error=-13 profile="/usr/sbin/mysqld" name="run/systemd/notify" pid=2527 comm="mysqld" requested_mask="w" denied_mask="w" fsuid=113 ouid=0
[  144.867432] audit: type=1400 audit(1548120242.099:27): apparmor="DENIED" operation="sendmsg" info="Failed name lookup – disconnected path" error=-13 profile="/usr/sbin/mysqld" name="run/systemd/notify" pid=2527 comm="mysqld" requested_mask="w" denied_mask="w" fsuid=113 ouid=0


1. How to check if AppArmor is running on the system

If you have a system with enabled apparmor you should get some output like:

root@haproxy2:~# apparmor_status 
apparmor module is loaded.
5 profiles are loaded.
5 profiles are in enforce mode.
   /usr/sbin/ntpd
   lsb_release
   nvidia_modprobe
   nvidia_modprobe//kmod
   tcpdump
0 profiles are in complain mode.
1 processes have profiles defined.
1 processes are in enforce mode.
   /usr/sbin/ntpd (387) 
0 processes are in complain mode.
0 processes are unconfined but have a profile defined.


Also if you check the service you will find out that Debian's Major Release upgrade from 10 Buster to 11 BullsEye with.

apt update -y && apt upgrade -y && apt dist-update -y

automatically installed apparmor and started the service, e.g.:

# systemctl status apparmor
● apparmor.service – Load AppArmor profiles
     Loaded: loaded (/lib/systemd/system/apparmor.service; enabled; vendor pres>
     Active: active (exited) since Sat 2022-01-22 23:04:58 EET; 5 days ago
       Docs: man:apparmor(7)
             https://gitlab.com/apparmor/apparmor/wikis/home/
    Process: 205 ExecStart=/lib/apparmor/apparmor.systemd reload (code=exited, >
   Main PID: 205 (code=exited, status=0/SUCCESS)
        CPU: 43ms

яну 22 23:04:58 haproxy2 apparmor.systemd[205]: Restarting AppArmor
яну 22 23:04:58 haproxy2 apparmor.systemd[205]: Reloading AppArmor profiles
яну 22 23:04:58 haproxy2 systemd[1]: Starting Load AppArmor profiles…
яну 22 23:04:58 haproxy2 systemd[1]: Finished Load AppArmor profiles.


# dpkg -l |grep -i apparmor
ii  apparmor                          2.13.6-10                      amd64        user-space parser utility for AppArmor
ii  libapparmor1:amd64                2.13.6-10                      amd64        changehat AppArmor library
ii  libapparmor-perl:amd64               2.13.6-10


In case AppArmor is disabled, you will get something like:

root@pcfrxenweb:~# aa-status 
apparmor module is loaded.
0 profiles are loaded.
0 profiles are in enforce mode.
0 profiles are in complain mode.
0 processes have profiles defined.
0 processes are in enforce mode.
0 processes are in complain mode.
0 processes are unconfined but have a profile defined.


2. How to disable AppArmor for particular running services processes

In my case after the upgrade of a system running a MySQL Server suddenly out of nothing after reboot the Database couldn't load up properly and if I try to restart it with the usual

root@pcfrxen: /# systemctl restart mariadb

I started getting errors like:

DBI connect failed : Can't connect to local MySQL server through socket '/var/run/mysqld/mysqld.sock' (2)

To get an idea of what kind of profile definitions, could be enabled disabled on apparmor enabled system do:
 

root@pcfrxen:/var/log# ls -1 /etc/apparmor.d/
abstractions/
force-complain/
local/
lxc/
lxc-containers
samba/
system_tor
tunables/
usr.bin.freshclam
usr.bin.lxc-start
usr.bin.man
usr.bin.tcpdump
usr.lib.telepathy
usr.sbin.clamd
usr.sbin.cups-browsed
usr.sbin.cupsd
usr.sbin.ejabberdctl
usr.sbin.mariadbd
usr.sbin.mysqld
usr.sbin.named
usr.sbin.ntpd
usr.sbin.privoxy
usr.sbin.squid

Lets say you want to disable any protection AppArmor profile for MySQL you can do it with:

root@pcfrxen:/ #  ln -s /etc/apparmor.d/usr.sbin.mysqld /etc/apparmor.d/disable/
root@pcfrxen:/ # apparmor_parser -R /etc/apparmor.d/usr.sbin.mysqld 


To make the system know you have disabled a profile you should restart apparmor service:
 

root@pcfrxen:/ # systemctl restart apparmor.service


3. Disable completely AppArmor to save your time weird system behavior and hang bangs

In my opinion the best thing to do anyways, especially if you don't run Containerized applications, that runs only one single application / service at at time is to completely disable apparmor, otherwise you would have to manually check each of the running applications before the upgrade and make sure that apparmor did not bring havoc to some of it.
Hence my way was to simple get rid of apparmor by disable and remove the related package completely out of the system to do so:

root@pcfrxen:/ # systemctl stop apparmor
root@pcfrxen:/ # systemctl disable apparmor
root@pcfrxen:/ # apt-get remove -y apparmor

Once  disabled to make the system completely load out anything loaded related to apparmor loaded into system memory, you should do machine reboot.

root@pcfrxen:/ # shutdown -r now

Hopefully if you run into same issue after removal of apparmor most of the things should be working fine after the upgrade. Anyways I had to go through each and every app everywhere and make sure it is working as expected. The major release upgrade has also automatically enabled me some of the already disable services, thus if you have upgraded like me I would advice you do a close check on every enabled / running service everywhere:

root@pcfrxen:/# systemctl list-unit-files|grep -i enabled

Beware of AppArmor  !!! 🙂

How to set up dsmc client Tivoli ( TSM ) release version and process check monitoring with Zabbix

Thursday, December 17th, 2020

zabbix-monitor-dsmc-client-monitor-ibm-tsm-with-zabbix-howto

As a part of Monitoring IBM Spectrum (the new name of IBM TSM) if you don't have the money to buy something like HP Open View monitoring or other kind of paid monitoring system but you use Zabbix open source solution to monitor your Linux server infrastructure and you use Zabbix as a main Services and Servers monitoring platform you will want to monitor at least whether the running Tivoli dsmc backup clients run fine on each of the server (e.g. the dsmc client) runs normally as a backup solution with its common /usr/bin/dsmc process service that connects towards remote IBM TSM server where the actual Data storage is kept.

It might be a kind of weird monitoring to setup to have the tsm version frequently reported to a Zabbix server on a first glimpse, but in reality this is quite useful especially if you want to have a better overview of your multiple servers environment IBM (Spectrum Protect) Storage manager backup solution actual release.
 
So the goal is to have reported dsmc interactive storage manager version as reported from
 

[root@server ~]# dsmc

IBM Spectrum Protect
Command Line Backup-Archive Client Interface
  Client Version 8, Release 1, Level 11.0
  Client date/time: 12/17/2020 15:59:32
(c) Copyright by IBM Corporation and other(s) 1990, 2020. All Rights Reserved.

Node Name: Sub-Hostname.FQDN.COM
Session established with server TSM_SERVER: AIX
  Server Version 8, Release 1, Level 10.000
  Server date/time: 12/17/2020 15:59:34  Last access: 12/17/2020 13:28:01


into zabbix and set reports in case if your sysadmins have changed version of a IBM TSM to a newer version. Thus for non sysadmins and less technical persons as Service Delivery Managers (SDMs) it is much easier to track changes of multiple servers Tivoli version to a newer one.

Enough talk let me next show you how to setup the required with a small UserParameter one liner bash shell script.
 

1. Create TSM Userparameter script


With Userparameter key and content as below:

[root@server ~]# vim /etc/zabbix/zabbix_agentd.d/userparameter_TSM.conf


UserParameter=dsmc.version,cat /var/tsm/sched.log | grep Clie | tail -n 1 | awk '{print $7 " " $8 " " $9 " " $10 " " $11 " " $12 " " $13}'


The script output of TivSM version will be reported as so:

[root@server ~]# cat /var/tsm/sched.log | grep Clie | tail -n 1 | awk '{print $7 " " $8 " " $9 " " $10 " " $11 " " $12 " " $13}'
Client Version 8, Release 1, Level 11.0


If you want to get only a major version report from dsmc:

UserParameter=dsmc.version,cat /var/tsm/sched.log | grep Clie | tail -n 1 | awk '{print $7 " " $8 " " $9}'


The output as a major version you will get is

[root@server ~]# cat /var/tsm/sched.log | grep Clie | tail -n 1 | awk '{print $7 " " $8 " " $9}'
Client Version 8,


2. Restart the zabbix agent to load userparam script

To load above configured Userparameter script we need to restart zabbix-agent client

[root@server ~]# systemctl restart zabbix-agent

[root@server ~]#  systemctl status zabbix-agent
● zabbix-agent.service – Zabbix Agent
   Loaded: loaded (/usr/lib/systemd/system/zabbix-agent.service; enabled; vendor preset: disabled)
   Active: active (running) since Wed 2020-07-22 16:17:17 CEST; 4 months 26 days ago
 Main PID: 7817 (zabbix_agentd)
   CGroup: /system.slice/zabbix-agent.service
           ├─7817 /usr/sbin/zabbix_agentd -c /etc/zabbix/zabbix_agentd.conf
           ├─7818 /usr/sbin/zabbix_agentd: collector [idle 1 sec]
           ├─7819 /usr/sbin/zabbix_agentd: listener #1 [waiting for connection]
           ├─7820 /usr/sbin/zabbix_agentd: listener #2 [waiting for connection]
           ├─7821 /usr/sbin/zabbix_agentd: listener #3 [waiting for connection]
           └─7822 /usr/sbin/zabbix_agentd: active checks #1 [idle 1 sec]


3. Create template for TSM Service check and TSM Version


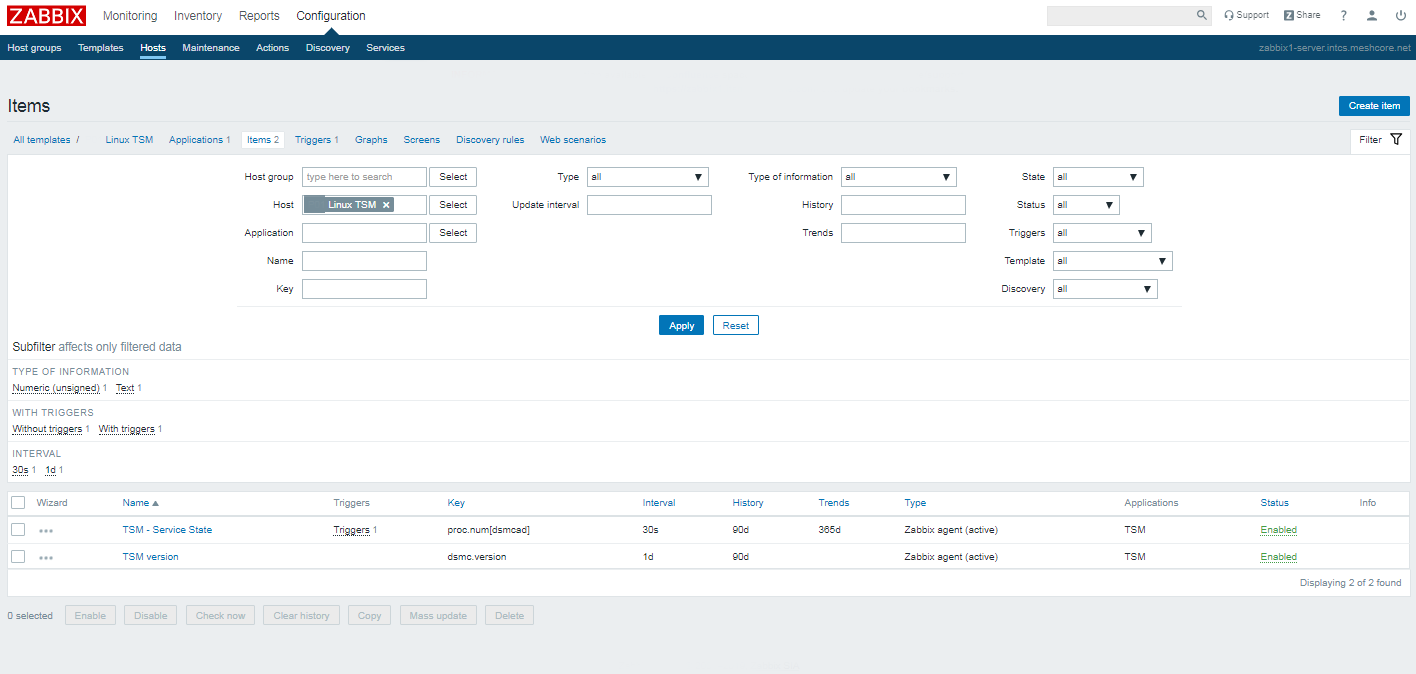
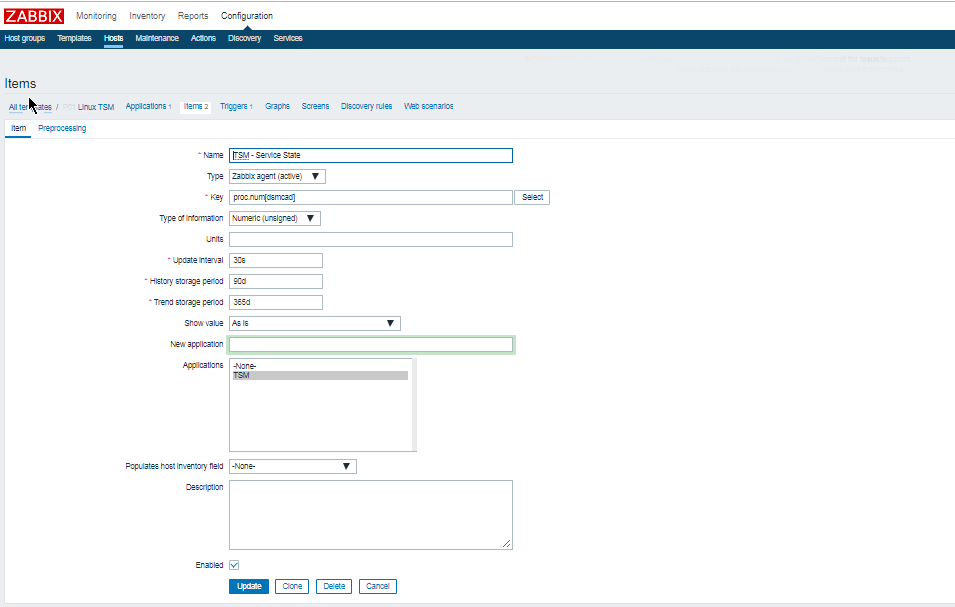
You will need to create 1 Trigger and 2 Items for the Service check and for TSM version reporting

tsm-service-version-screenshot-zabbix
As you see necessery names / keys to create are:

Name / Key: TSM – Service State proc.num{dsmcad}

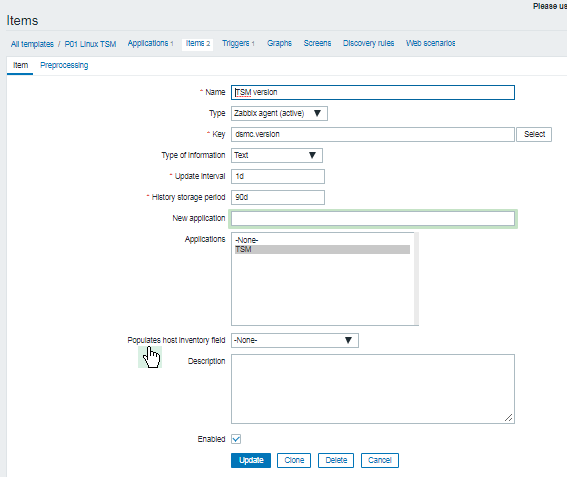
Name / key: TSM version dmsc.version


3.1 Create the trigger


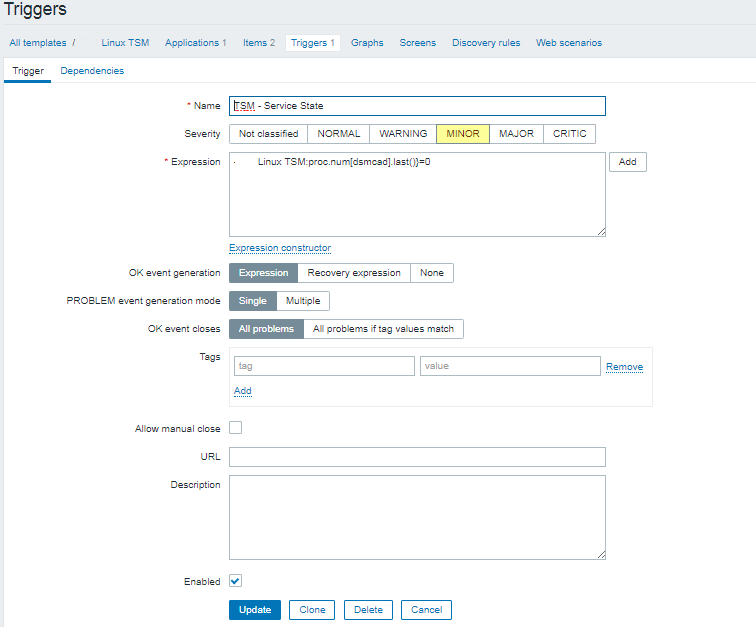
Now lets create the trigger that will report the Service State

tsm-service-state-zabbix-screenshot


Linux TSM:proc.num[dsmcad].last()}=0


3.2 Create the Items


zabbix-dsmc-proc-num-item-setting-screenshot-linux


Name: dsmcad
Key: proc.num{dsmcad}


tsm-version-item-zabbix-screenshot
 

Update interval: 1d
History Storage period: 90d
Applications: TSM


3.3 Create Zabbix Action

As usual if you want to receive some Email Alerting or lets say send SMS in case of Trigger is matched create the necessery Action with
instructions on how to solve the problem if there is a Standard Operation Procedure ( SOP ) as often called in the corporate world for that.

That's all folks ! 🙂


Linux: How to set KVM Virtual Machine to autostart on system boot

Thursday, July 15th, 2021

linux-kvm-set-vm-to-automatically-boot-on-linux-system-boot

Recently I've written a short article on how to make auto boot OpenVZ container Virtual Machine if system gets rebooted as I had the task to do so in daily job as sysadmin.
Few days ago after some power outage in one of Frankfurt based Data Centers, some Rack tech equipment has been temporary powered of and once the electricity was up again, some Linux servers  running Kernel Based Virtualization ( KVM ) some of the virtual machines did not managed to automatically start up and we had to manually start them one by one.
To manually start each of the machines that did not start up had to do the trivial:

[root@hypervisor ~]# virsh list
 Id    Name                           State
—————————————————-
 3     VM500                   running

[root@hypervisor ~]# virsh dominfo VM500
Id:             3
Name:           VM500
UUID:           82075903-a4ce-5ec0-a3d8-9ee83d85fc75
OS Type:        hvm
State:          running
CPU(s):         2
CPU time:       247407.9s
Max memory:     2097152 KiB
Used memory:    2097152 KiB
Persistent:     yes
Autostart:      disable
Managed save:   no
Security model: selinux
Security DOI:   0
Security label: system_u:system_r:svirt_t:s0:c447,c723 (permissive)

[root@hypervisor ~]# virsh start VM_domain_Name

Of course logcally to prevent future issues in case if Linux server gets suddenly rebooted due to whatever reason, we had to configure the machines in questions to automatically boot on OS system boot.

In some rare cases if above start command does not help you might want to check what is the status of libvirtd and investigate the logs in /var/log/libvirt/ i.e. /var/log/libvirt/libvirt.log

An alternative but more complicated way to set virtual machine to automatically start on boot is by using default location for automatic VM start just like OpenXEn has its /etc/xen/auto/ dirtory from where each soft symlinked VM configuration from /etc/xen/VM_name.cfg is started in KVM Hypervisor hosts to auto boot a certain vm you have to link /etc/libvirt/qemu/VM-to-autoboot-name.xml to /etc/libvirt/qemu/autostart/VM-to-autoboot-name.xml

[root@hypervisor ~]# systemctl status libvirtd
● libvirtd.service – Virtualization daemon
   Loaded: loaded (/usr/lib/systemd/system/libvirtd.service; enabled; vendor preset: enabled)
   Active: active (running) since Tue 2021-06-29 10:21:30 CEST; 2 weeks 2 days ago
     Docs: man:libvirtd(8)
           https://libvirt.org
 Main PID: 1809 (libvirtd)
    Tasks: 22 (limit: 32768)
   CGroup: /system.slice/libvirtd.service
           ├─1809 /usr/sbin/libvirtd
           ├─2335 /usr/sbin/dnsmasq –conf-file=/var/lib/libvirt/dnsmasq/default.conf –leasefile-ro –dhcp-script=/us…
           ├─2336 /usr/sbin/dnsmasq –conf-file=/var/lib/libvirt/dnsmasq/default.conf –leasefile-ro –dhcp-script=/us…
           ├─2386 /usr/sbin/dnsmasq –conf-file=/var/lib/libvirt/dnsmasq/Host-Only.conf –leasefile-ro –dhcp-script=/…
           └─2387 /usr/sbin/dnsmasq –conf-file=/var/lib/libvirt/dnsmasq/Host-Only.conf –leasefile-ro –dhcp-script=/…

If for some reason libvirtd is not running or disabled state you will have to enable it with:

[root@hypervisor ~]# systemctl enable libvirtd

If the virtualization is running on some RPM based distribtuion OpenSuse whatever and libvirtd is controlled via chkconfig (redhat runlevel alternative system), you will have to :

[root@hypervisor ~]# chkconfig libvirtd on

Disabling KVM Virtual Machine from auto start on server boot

[root@hypervisor ~]# virsh autostart Debian10 –disable
Domain Debian10 unmarked as autostarted

Fix Zabbix selinux caused permission issues on CentOS 7 Linux / cannot set resource limit: [13] Permission denied error solution

Tuesday, July 6th, 2021

zabbix-selinux-logo-fix-zabbix-permission-issues-when-running-on-ceontos-linux-change-selinux-to-permissive-howto.

If you have to install Zabbix client that has to communicate towards Zabbix server via a Zabbix Proxy you might be unpleasently surprised that it cannot cannot be start if the selinux mode is set to Enforcing.
Error message like on below screenshot will be displayed when starting proxy client with systemctl.

zabbix-proxy-cannot-be-started-due-to-selinux-permissions

In the zabbix logs you will see error  messages such as:
 

"cannot set resource limit: [13] Permission denied, CentOS 7"


29085:20160730:062959.263 Starting Zabbix Agent [Test host]. Zabbix 3.0.4 (revision 61185).
29085:20160730:062959.263 **** Enabled features ****
29085:20160730:062959.263 IPv6 support: YES
29085:20160730:062959.263 TLS support: YES
29085:20160730:062959.263 **************************
29085:20160730:062959.263 using configuration file: /etc/zabbix/zabbix_agentd.conf
29085:20160730:062959.263 cannot set resource limit: [13] Permission denied
29085:20160730:062959.263 cannot disable core dump, exiting…


Next step to do is to check whether zabbix is listed in selinux's enabled modules to do so run:
 

[root@centos ~ ]# semodules -l

…..
vhostmd    1.1.0
virt    1.5.0
vlock    1.2.0
vmtools    1.0.0
vmware    2.7.0
vnstatd    1.1.0
vpn    1.16.0
w3c    1.1.0
watchdog    1.8.0
wdmd    1.1.0
webadm    1.2.0
webalizer    1.13.0
wine    1.11.0
wireshark    2.4.0
xen    1.13.0
xguest    1.2.0
xserver    3.9.4
zabbix    1.6.0
zarafa    1.2.0
zebra    1.13.0
zoneminder    1.0.0
zosremote    1.2.0


[root@centos ~ ]# sestatus
# sestatusSELinux status:                 enabled
SELinuxfs mount:                /sys/fs/selinux
SELinux root directory:         /etc/selinux
Loaded policy name:             targeted
Current mode:                   enforcing
Mode from config file:          enforcing
Policy MLS status:              enabled
Policy deny_unknown status:     allowed
Max kernel policy version:      28

To get exact zabbix IDs that needs to be added as permissive for Selinux you can use ps -eZ like so:

[root@centos ~ ]# ps -eZ |grep -i zabbix
system_u:system_r:zabbix_agent_t:s0 1149 ?     00:00:00 zabbix_agentd
system_u:system_r:zabbix_agent_t:s0 1150 ?     00:04:28 zabbix_agentd
system_u:system_r:zabbix_agent_t:s0 1151 ?     00:00:00 zabbix_agentd
system_u:system_r:zabbix_agent_t:s0 1152 ?     00:00:00 zabbix_agentd
system_u:system_r:zabbix_agent_t:s0 1153 ?     00:00:00 zabbix_agentd
system_u:system_r:zabbix_agent_t:s0 1154 ?     02:21:46 zabbix_agentd

As you can see zabbix is enabled and hence selinux enforcing mode is preventing zabbix client / server to operate and communicate normally, hence to make it work we need to change zabbix agent and zabbix proxy to permissive mode.

Setting selinux for zabbix agent and zabbix proxy to permissive mode

If you don't have them installed you might neet the setroubleshoot setools, setools-console and policycoreutils-python rpms packs (if you have them installed skip this step).

[root@centos ~ ]# yum install setroubleshoot.x86_64 setools.x86_64 setools-console.x86_64 policycoreutils-python.x86_64

Then to add zabbix service to become permissive either run

[root@centos ~ ]# semanage permissive –add zabbix_t

[root@centos ~ ]# semanage permissive -a zabbix_agent_t


In some cases you might also need in case if just adding the permissive for zabbix_agent_t try also :

setsebool -P zabbix_can_network=1

Next try to start zabbox-proxy and zabbix-agent systemd services 

[root@centos ~ ]# systemctl start zabbix-proxy.service

[root@centos ~ ]# systemctl start zabbix-agent.service

Hopefully all should report fine with the service checking the status should show you something like:

[root@centos ~ ]# systemctl status zabbix-agent
● zabbix-agent.service – Zabbix Agent
   Loaded: loaded (/usr/lib/systemd/system/zabbix-agent.service; enabled; vendor preset: disabled)
   Active: active (running) since Thu 2021-06-24 07:47:42 CEST; 1 weeks 5 days ago
 Main PID: 1149 (zabbix_agentd)
   CGroup: /system.slice/zabbix-agent.service
           ├─1149 /usr/sbin/zabbix_agentd -c /etc/zabbix/zabbix_agentd.conf
           ├─1150 /usr/sbin/zabbix_agentd: collector [idle 1 sec]
           ├─1151 /usr/sbin/zabbix_agentd: listener #1 [waiting for connection]
           ├─1152 /usr/sbin/zabbix_agentd: listener #2 [waiting for connection]
           ├─1153 /usr/sbin/zabbix_agentd: listener #3 [waiting for connection]
           └─1154 /usr/sbin/zabbix_agentd: active checks #1 [idle 1 sec]

Check the Logs finally to make sure all is fine with zabbix being allowed by selinux.

[root@centos ~ ]# grep zabbix_proxy /var/log/audit/audit.log

[root@centos ~ ]# tail -n 100 /var/log/zabbix/zabbix_agentd.log


If no errors are in and you receive and you can visualize the usual zabbix collected CPU / Memory / Disk etc. values you're good, Enjoy ! 🙂