haproxy logging can be managed in different form the most straight forward way is to directly use /dev/log either you can configure it to use some log management service as syslog or rsyslogd for that.
If you don't use rsyslog yet to install it:
# apt install -y rsyslog
Then to activate logging via rsyslogd we can should add either to /etc/rsyslogd.conf or create a separte file and include it via /etc/rsyslogd.conf with following content:
Enable haproxy logging from rsyslogd
Log haproxy messages to separate log file you can use some of the usual syslog local0 to local7 locally used descriptors inside the conf (be aware that if you try to use some wrong value like local8, local9 as a logging facility you will get with empty haproxy.log, even though the permissions of /var/log/haproxy.log are readable and owned by haproxy user.
When logging to a local Syslog service, writing to a UNIX socket can be faster than targeting the TCP loopback address. Generally, on Linux systems, a UNIX socket listening for Syslog messages is available at /dev/log because this is where the syslog() function of the GNU C library is sending messages by default. To address UNIX socket in haproxy.cfg use:
log /dev/log local2
If you want to log into separate log each of multiple running haproxy instances with different haproxy*.cfg add to /etc/rsyslog.conf lines like:
local2.* -/var/log/haproxylog2.log
local3.* -/var/log/haproxylog3.log
One important note to make here is since rsyslogd is used for haproxy logging you need to have enabled in rsyslogd imudp and have a UDP port listener on the machine.
E.g. somewhere in rsyslog.conf or via rsyslog include file from /etc/rsyslog.d/*.conf needs to have defined following lines:
$ModLoad imudp
$UDPServerRun 514
I prefer to use external /etc/rsyslog.d/20-haproxy.conf include file that is loaded and enabled rsyslogd via /etc/rsyslog.conf:
# vim /etc/rsyslog.d/20-haproxy.conf
$ModLoad imudp
$UDPServerRun 514
local2.* -/var/log/haproxy2.log
It is also possible to produce different haproxy log output based on the severiy to differentiate between important and less important messages, to do so you'll need to rsyslog.conf something like:
# Creating separate log files based on the severity
local0.* /var/log/haproxy-traffic.log
local0.notice /var/log/haproxy-admin.log
Prevent Haproxy duplicate messages to appear in /var/log/messages
If you use local2 and some default rsyslog configuration then you will end up with the messages coming from haproxy towards local2 facility producing doubled simultaneous records to both your pre-defined /var/log/haproxy.log and /var/log/messages on Proxy servers that receive few thousands of simultanous connections per second.
This is a problem since doubling the log will produce too much data and on systems with smaller /var/ partition you will quickly run out of space + this haproxy requests logging to /var/log/messages makes the file quite unreadable for normal system events which are so important to track clearly what is happening on the server daily.
To prevent the haproxy duplicate messages you need to define somewhere in rsyslogd usually /etc/rsyslog.conf local2.none near line of facilities configured to log to file:
*.info;mail.none;authpriv.none;cron.none;local2.none /var/log/messages
This configuration should work but is more rarely used as most people prefer to have haproxy log being written not directly to /dev/log which is used by other services such as syslogd / rsyslogd.
To use /dev/log to output logs from haproxy configuration in global section use config like:
global
log /dev/log local2 debug
chroot /var/lib/haproxy
stats socket /run/haproxy/admin.sock mode 660 level admin
stats timeout 30s
user haproxy
group haproxy
daemon
The log global directive basically says, use the log line that was set in the global section for whole config till end of file. Putting a log global directive into the defaults section is equivalent to putting it into all of the subsequent proxy sections.
Using global logging rules is the most common HAProxy setup, but you can put them directly into a frontend section instead. It can be useful to have a different logging configuration as a one-off. For example, you might want to point to a different target Syslog server, use a different logging facility, or capture different severity levels depending on the use case of the backend application.
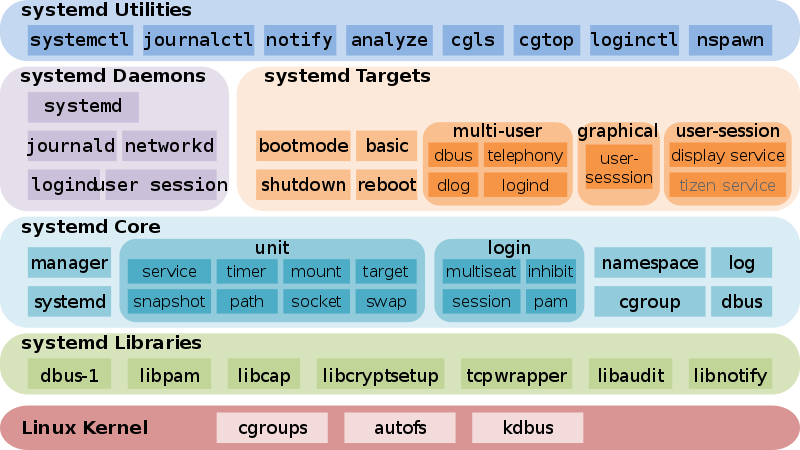
Insetad of using /dev/log interface that is on many distributions heavily used by systemd to store / manage and distribute logs, many haproxy server sysadmins nowdays prefer to use rsyslogd as a default logging facility that will manage haproxy logs.
Admins prefer to use some kind of mediator service to manage log writting such as rsyslogd or syslog, the reason behind might vary but perhaps most important reason is by using rsyslogd it is possible to write logs simultaneously locally on disk and also forward logs to a remote Logging server running rsyslogd service.
Logging is defined in /etc/haproxy/haproxy.cfg or the respective configuration through global section but could be also configured to do a separate logging based on each of the defined Frontend Backends or default section.
A sample exceprt from this section looks something like:
#———————————————————————
# Global settings
#———————————————————————
global
log 127.0.0.1 local2
chroot /var/lib/haproxy
pidfile /var/run/haproxy.pid
maxconn 4000
user haproxy
group haproxy
daemon
# turn on stats unix socket
stats socket /var/lib/haproxy/stats
#———————————————————————
defaults
mode tcp
log global
option tcplog
#option dontlognull
#option http-server-close
#option forwardfor except 127.0.0.0/8
option redispatch
retries 7
#timeout http-request 10s
timeout queue 10m
timeout connect 30s
timeout client 20m
timeout server 10m
#timeout http-keep-alive 10s
timeout check 30s
maxconn 3000
# HAProxy Monitoring Config
#———————————————————————
listen stats 192.168.0.5:8080 #Haproxy Monitoring run on port 8080
mode http
option httplog
option http-server-close
stats enable
stats show-legends
stats refresh 5s
stats uri /stats #URL for HAProxy monitoring
stats realm Haproxy\ Statistics
stats auth hproxyauser:Password___ #User and Password for login to the monitoring dashboard
#———————————————————————
# frontend which proxys to the backends
#———————————————————————
frontend ft_DKV_PROD_WLPFO
mode tcp
bind 192.168.233.5:30000-31050
option tcplog
log-format %ci:%cp\ [%t]\ %ft\ %b/%s\ %Tw/%Tc/%Tt\ %B\ %ts\ %ac/%fc/%bc/%sc/%rc\ %sq/%bq
default_backend Default_Bakend_Name
#———————————————————————
# round robin balancing between the various backends
#———————————————————————
backend bk_DKV_PROD_WLPFO
mode tcp
# (0) Load Balancing Method.
balance source
# (4) Peer Sync: a sticky session is a session maintained by persistence
stick-table type ip size 1m peers hapeers expire 60m
stick on src
# (5) Server List
# (5.1) Backend
server Backend_Server1 10.10.10.1 check port 18088
server Backend_Server2 10.10.10.2 check port 18088 backup
The log directive in above config instructs HAProxy to send logs to the Syslog server listening at 127.0.0.1:514. Messages are sent with facility local2, which is one of the standard, user-defined Syslog facilities. It’s also the facility that our rsyslog configuration is expecting. You can add more than one log statement to send output to multiple Syslog servers.
Once rsyslog and haproxy logging is configured as a minumum you need to restart rsyslog (assuming that haproxy config is already properly loaded):
# systemctl restart rsyslogd.service
To make sure rsyslog reloaded successfully:
systemctl status rsyslogd.service
Restarting HAproxy
If the rsyslogd logging to 127.0.0.1 port 514 was recently added a HAProxy restart should also be run, you can do it with:
# /usr/sbin/haproxy -f /etc/haproxy/haproxy.cfg -D -p /var/run/haproxy.pid -sf $(cat /var/run/haproxy.pid)
Or to restart use systemctl script (if haproxy is not used in a cluster with corosync / heartbeat).
# systemctl restart haproxy.service
You can control how much information is logged by adding a Syslog level by
log 127.0.0.1 local2 info
The accepted values are the standard syslog security level severity:
| Value | Severity | Keyword | Deprecated keywords | Description | Condition |
| 0 | Emergency |
emerg
|
panic
| System is unusable | A panic condition. |
| 1 | Alert |
alert
| | Action must be taken immediately | A condition that should be corrected immediately, such as a corrupted system database. |
| 2 | Critical |
crit
| | Critical conditions | Hard device errors. |
| 3 | Error |
err
|
error
| Error conditions | |
| 4 | Warning |
warning
|
warn
| Warning conditions | |
| 5 | Notice |
notice
| | Normal but significant conditions | Conditions that are not error conditions, but that may require special handling. |
| 6 | Informational |
info
| | Informational messages | |
| 7 | Debug |
debug
| | Debug-level messages | Messages that contain information normally of use only when debugging a program. |
Logging only errors / timeouts / retries and errors is done with option:
Note that if the rsyslog is configured to listen on different port for some weird reason you should not forget to set the proper listen port, e.g.:
log 127.0.0.1:514 local2 info
option dontlog-normal
in defaults or frontend section.
You most likely want to enable this only during certain times, such as when performing benchmarking tests.
(or log-format-sd for structured-data syslog) directive in your defaults or frontend
Haproxy Logging shortly explained
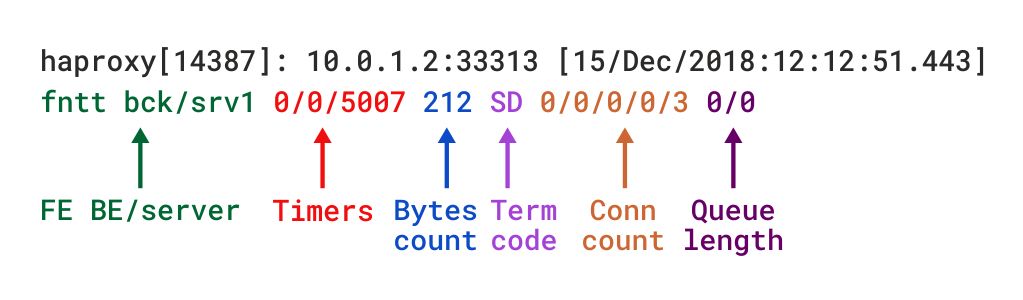
The type of logging you’ll see is determined by the proxy mode that you set within HAProxy. HAProxy can operate either as a Layer 4 (TCP) proxy or as Layer 7 (HTTP) proxy. TCP mode is the default. In this mode, a full-duplex connection is established between clients and servers, and no layer 7 examination will be performed. When in TCP mode, which is set by adding mode tcp, you should also add option tcplog. With this option, the log format defaults to a structure that provides useful information like Layer 4 connection details, timers, byte count and so on.
Below is example of configured logging with some explanations:
Log-format "%ci:%cp [%t] %ft %b/%s %Tw/%Tc/%Tt %B %ts %ac/%fc/%bc/%sc/%rc %sq/%bq"
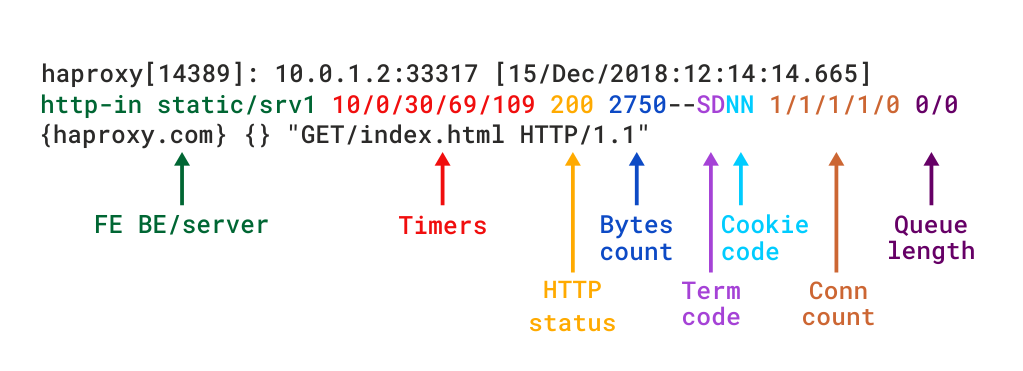
Example of Log-Format configuration as shown above outputted of haproxy config:
Log-format "%ci:%cp [%tr] %ft %b/%s %TR/%Tw/%Tc/%Tr/%Ta %ST %B %CC %CS %tsc %ac/%fc/%bc/%sc/%rc %sq/%bq %hr %hs %{+Q}r"
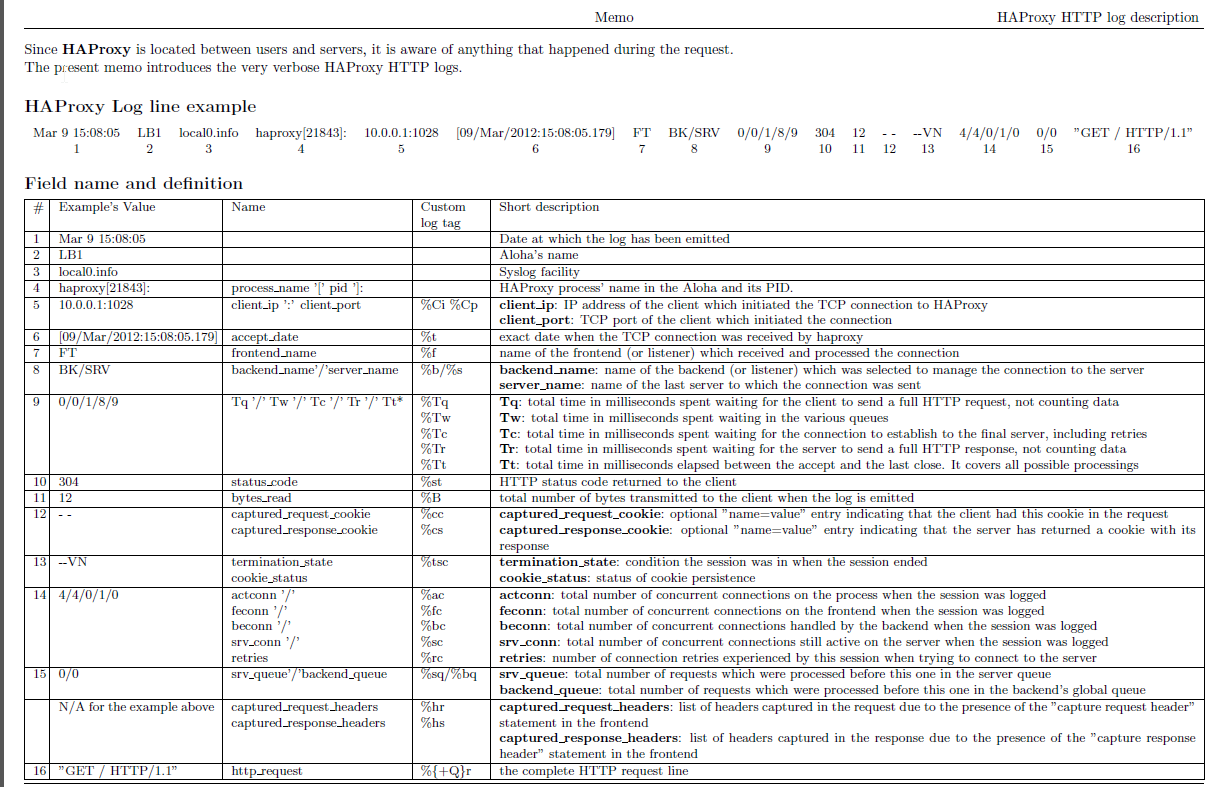
To understand meaning of this abbreviations you'll have to closely read haproxy-log-format.txt. More in depth info is to be found in HTTP Log format documentation
Logging HTTP request headers
HTTP request header can be logged via:
http-request capture
frontend website
bind :80
http-request capture req.hdr(Host) len 10
http-request capture req.hdr(User-Agent) len 100
default_backend webservers
The log will show headers between curly braces and separated by pipe symbols. Here you can see the Host and User-Agent headers for a request:
192.168.150.1:57190 [20/Dec/2018:22:20:00.899] website~ webservers/server1 0/0/1/0/1 200 462 – – —- 1/1/0/0/0 0/0 {mywebsite.com|Mozilla/5.0 (X11; Linux x86_64) AppleWebKit/537.36 (KHTML, like Gecko) Ubuntu Chromium/71.0.3578.80 } "GET / HTTP/1.1"
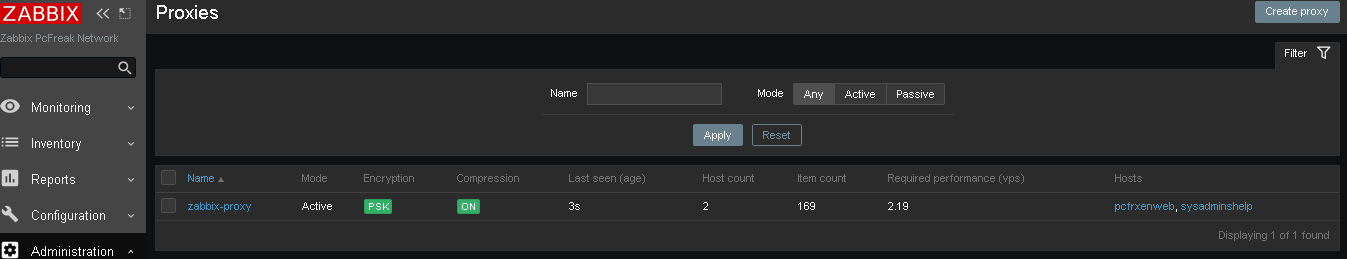
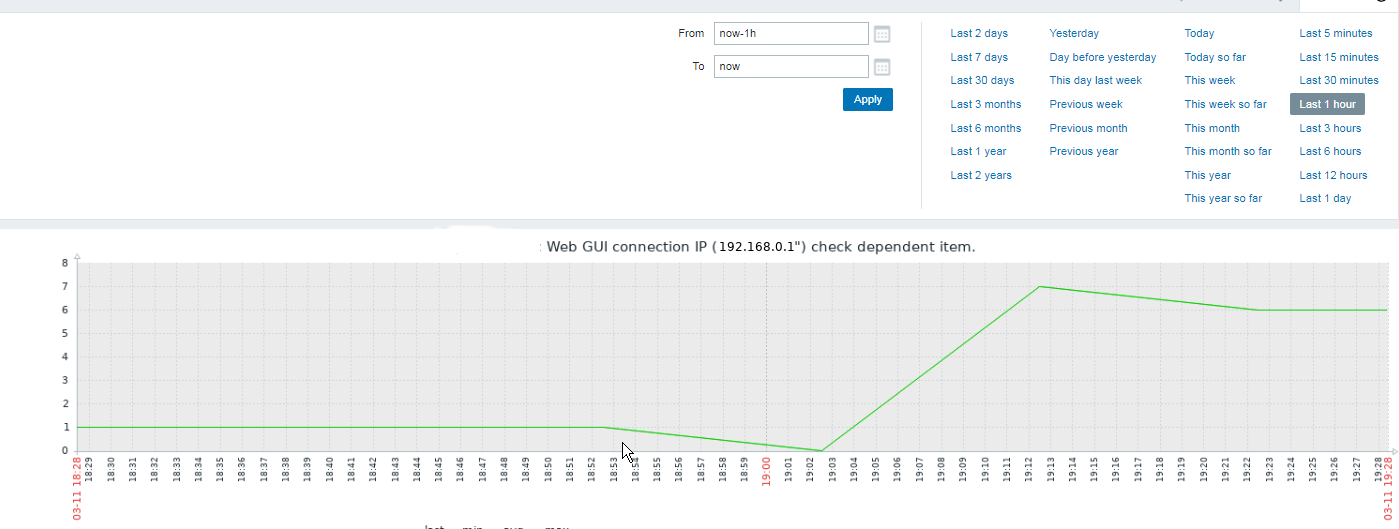
Haproxy Stats Monitoring Web interface
Haproxy is having a simplistic stats interface which if enabled produces some general useful information like in above screenshot, through which
you can get a very basic in browser statistics and track potential issues with the proxied traffic for all configured backends / frontends incoming outgoing
network packets configured nodes experienced downtimes etc.
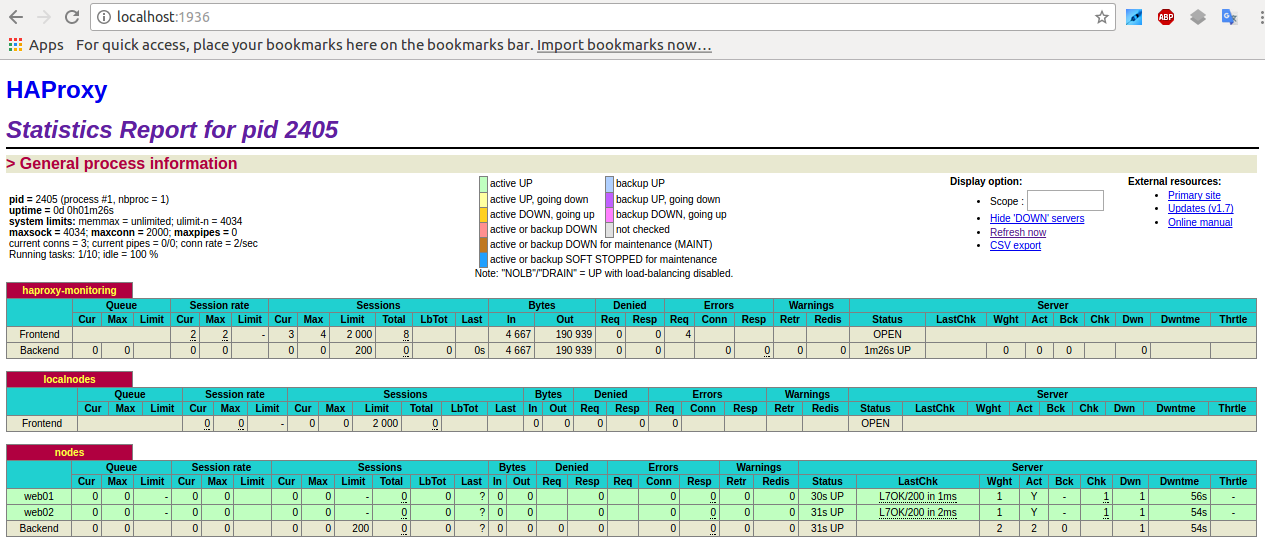
The basic configuration to make the stats interface accessible would be like pointed in above config for example to enable network listener on address
https://192.168.0.5:8080/stats
with hproxyuser / password config would be:
# HAProxy Monitoring Config
#———————————————————————
listen stats 192.168.0.5:8080 #Haproxy Monitoring run on port 8080
mode http
option httplog
option http-server-close
stats enable
stats show-legends
stats refresh 5s
stats uri /stats #URL for HAProxy monitoring
stats realm Haproxy\ Statistics
stats auth hproxyauser:Password___ #User and Password for login to the monitoring dashboard
Sessions states and disconnect errors on new application setup
Both TCP and HTTP logs include a termination state code that tells you the way in which the TCP or HTTP session ended. It’s a two-character code. The first character reports the first event that caused the session to terminate, while the second reports the TCP or HTTP session state when it was closed.
Here are some essential termination codes to track in for in the log:
Here are some termination code examples most commonly to see on TCP connection establishment errors:
Two-character code Meaning
— Normal termination on both sides.
cD The client did not send nor acknowledge any data and eventually timeout client expired.
SC The server explicitly refused the TCP connection.
PC The proxy refused to establish a connection to the server because the process’ socket limit was reached while attempting to connect.
To get all non-properly exited codes the easiest way is to just grep for anything that is different from a termination code –, like that:
tail -f /var/log/haproxy.log | grep -v ' — '
This should output in real time every TCP connection that is exiting improperly.
There’s a wide variety of reasons a connection may have been closed. Detailed information about all possible termination codes can be found in the HAProxy documentation.
To get better understanding a very useful reading to haproxy Debug errors with is in haproxy-logging.txt in that small file are collected all the cryptic error messages codes you might find in your logs when you're first time configuring the Haproxy frontend / backend and the backend application behind.
Another useful analyze tool which can be used to analyze Layer 7 HTTP traffic is halog for more on it just google around.