How to install Viber client on Debian GNU / Linux / Ubuntu / Mint in 2022 and enable Bulgarian language cyrillic phonetic keyboard
![]()
So far I've always used Viber on my mobile phone earlier on my Blu H1 HD and now after my dear friend Nomen give me his old iPhone X, i have switched to the iOS version which i find still a bit strangely looking.
Using Viber on the phone and stretching for the Phone all day long is really annoying especially if you work in the field of Information technology like me as System Administrator programmer. Thus having a copy of Viber on your Linux desktop that is next to you is a must.
Viber is proprietary software on M$ Windows its installation is a piece of cake, you install confirm that you want to use it on a secondary device by scanning the QR and opening the URL with your phone and you're ready to Chat and Viber Call with your friends or colleagues.
As often on Linux, it is a bit more complicated as the developers of Viber, perhaps did not put too much effort to port it to Linux or did not have much knowledge of how Linux is organized or they simply did not have the time to put for enough testing, and hence installing the Viber on Linux does not straight supported the Bulgarian traditional cyrillic. I've done some small experimentation and installed Viber on Linux both as inidividual package from their official Linux .deb package as well as of a custom build flatpak. In this small article, i'll put it down how i completed that as well as how managed to workaround the language layout problems with a simple setxkbmap cmd.
How to install Viber client on Debian GNU / Linux / Ubuntu / Mint in 2022 and enable Bulgarian language cyrillic phonetic
1.Install and use Viber as a standard Desktop user Linux application
Download latest Debian AMD64 .deb binary from official Viber website inside some dir with Opera / Chrome / Firefox browser and store it in:
hipo@jericho: ~$ cd /usr/local/src
Alternatively you can run the above wget command, but this is not the recommended way since you might end up with Viber Linux version that is older.
hipo@jericho: ~$ sudo wget http://download.cdn.viber.com/cdn/desktop/Linux/viber.deb
hipo@jericho: ~$ su – root
1.2. Resolve the required Viber .deb package dependecies
To resolve the required dependencies of viber.deb package, easiest way is to use gdebi-core # apt-cache show gdebi-core|grep Description-en -A4 Description-en: simple tool to install deb files gdebi lets you install local deb packages resolving and installing its dependencies. apt does the same, but only for remote (http, ftp) located packages. # apt-get install gdebi-core … # apt-get install -f ./viber …
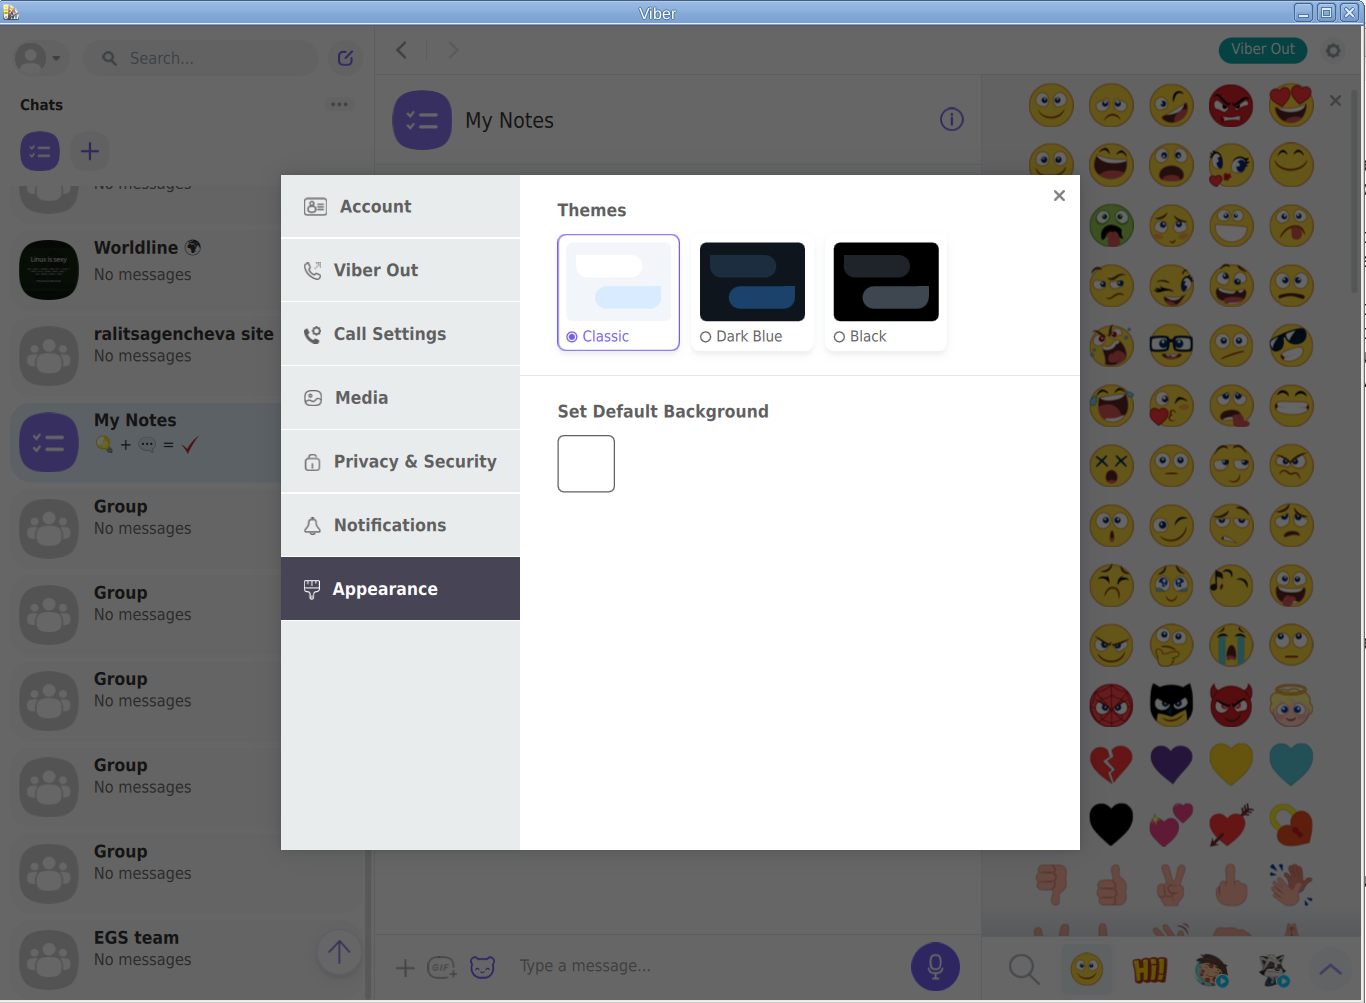
1.3. Setting the default language for Viber to support non-latin languages like Cyrillic
I'm Bulgarian and I use the Phonetic Traidional BG keyboard that is UTF8 compatible but cyrillic and non latin. However Viber developers seems to not put much effort and resolve that the Bulgarian Phonetic Traditional keyboard added in my Mate Desktop Environment to work out of the box with Viber on Linux. So as usual in Linux you need a hack ! The hack consists of using setxkbmap to set supported keyboard layouts for Viber US,BG and Traditional Phonetic. This can be done with above command:
setxkbmap -layout 'us,bg' -variant ' ,phonetic' -option 'grp:lalt_lshift_toggle'
To run it everytime together with the Viber binary executable that is stored in location /opt/viber/Viber as prepared by the package developer by install and post-install scripts in the viber.deb, prepared also a 3 liner tine script:
# cat start_viber.sh
#!/bin/bash
cd /opt/viber; setxkbmap -layout 'us,bg' -variant ' ,phonetic' -option 'grp:lalt_lshift_toggle'
./Viber
2. Install Viber in separated isolated sandbox from wider system
Second way if you don't trust a priorietary third party binary of Viber (and don't want for Viber to be able to possibly read data of your login GNOME / KDE user, e.g. not be spied by KGB 🙂
For those curious why i'm saying that Viber is mostly used mainly in the ex Soviet Union and in the countries that used to be Soviet satellite ones for one or another reason and though being developed in Israel some of its development in the past was done in Belarus as far as I remember one of the main 3 members (Ukraine, Belarus and Russia) that took the decision to dissolve the USSR 🙂
Talking about privacy if you're really concerned about privacy the best practice is not to use neither WhatApp nor Viber at all on any OS, but this is hard as usually most people are already "educated" to use one of the two.
For the enthusiasts however I do recommend just to use the Viber / WhatsApp free GPLed software alternative for Vital communication that you don't want to have been listened to by the China / USA / Russia etc.
Such a good free software alternative is Jitsy and it has both a Web interface that can be used very easily straight inside a browser or you could install a desktop version for PC / iOS and Android and more.
An interesting and proud fact to mention about Jitsy is that its main development that led the project to the state it is now is being done by a buddy Bulgarian ! Good Job man ! 🙂
If you want to give jitsy a try in web with a friend just clik over my pc-freak home lab machine has installed usable version on meet.pc-freak.net
In the same way people in most countries with American and English free world use the WhatsApp which is a another free spy and self analysis software offered by America most likely collecting your chat data and info about you in the (US Central Intelligence Agency) CIA databases. But enough blant so to minimize a bit the security risks of having the binary run directly as a process you can use a containerization like docker to run it inside and isolate from the rest of your Linux desktop. flatpak is a tool developed exactly for that.
hipo@jeremiah:/opt/viber$ apt-cache show flatpak|grep -i Description-en -A 13
Description-en: Application deployment framework for desktop apps
Flatpak installs, manages and runs sandboxed desktop application bundles.
Application bundles run partially isolated from the wider system, using
containerization techniques such as namespaces to prevent direct access
to system resources. Resources from outside the sandbox can be accessed
via "portal" services, which are responsible for access control; for
example, the Documents portal displays an "Open" dialog outside the
sandbox, then allows the application to access only the selected file.
.
Each application uses a specified "runtime", or set of libraries, which is
available as /usr inside its sandbox. This can be used to run application
bundles with multiple, potentially incompatible sets of dependencies within
the same desktop environment.Having Viber installed on Linux inside a container with flatpak is as simple as to adding, repository and installing the flatpak package
already bundled and stored inside flathub repository, e.g.:
2.1. Install flatpak
# sudo apt install flatpak
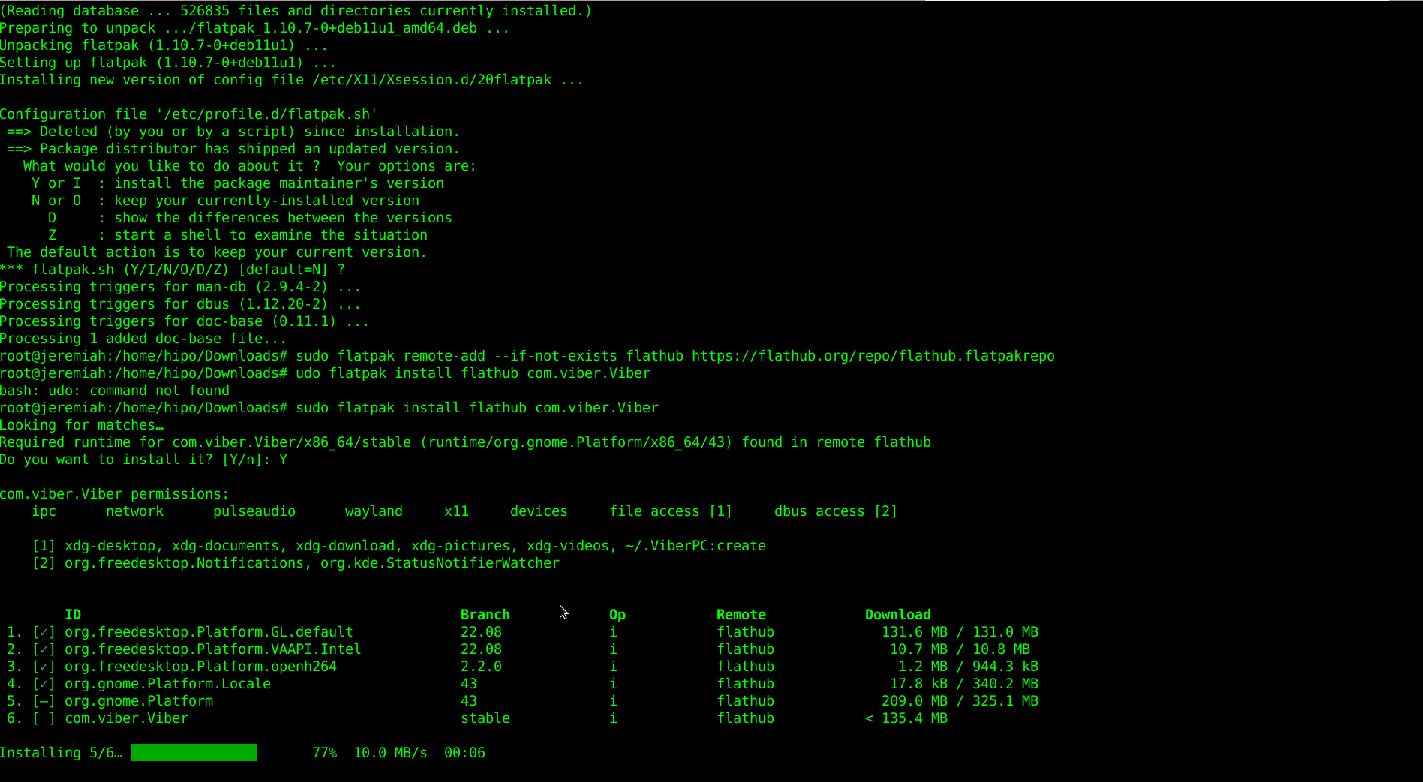
2.2. Add flathub install repository
flatpak is pretty much like dockerhub, it contains images of containered sandbox copies of software, the main advantage of flatpak is its portability, scalability and security.
Of course if you're a complete security freak you can prepare yourself an own set of Viber and add it to flathub and use instead of the original one 🙂
# sudo flatpak remote-add –if-not-exists flathub https://flathub.org/repo/flathub.flatpakrepo
2.3. Install Flatpak-ed Viber
#sudo flatpak install flathub com.viber.Viber
Reboot the PC and to test Viber will run containerized normally issue below flapak start command:
# /usr/bin/flatpak run –branch=stable –arch=x86_64 –command=viber com.viber.Viber
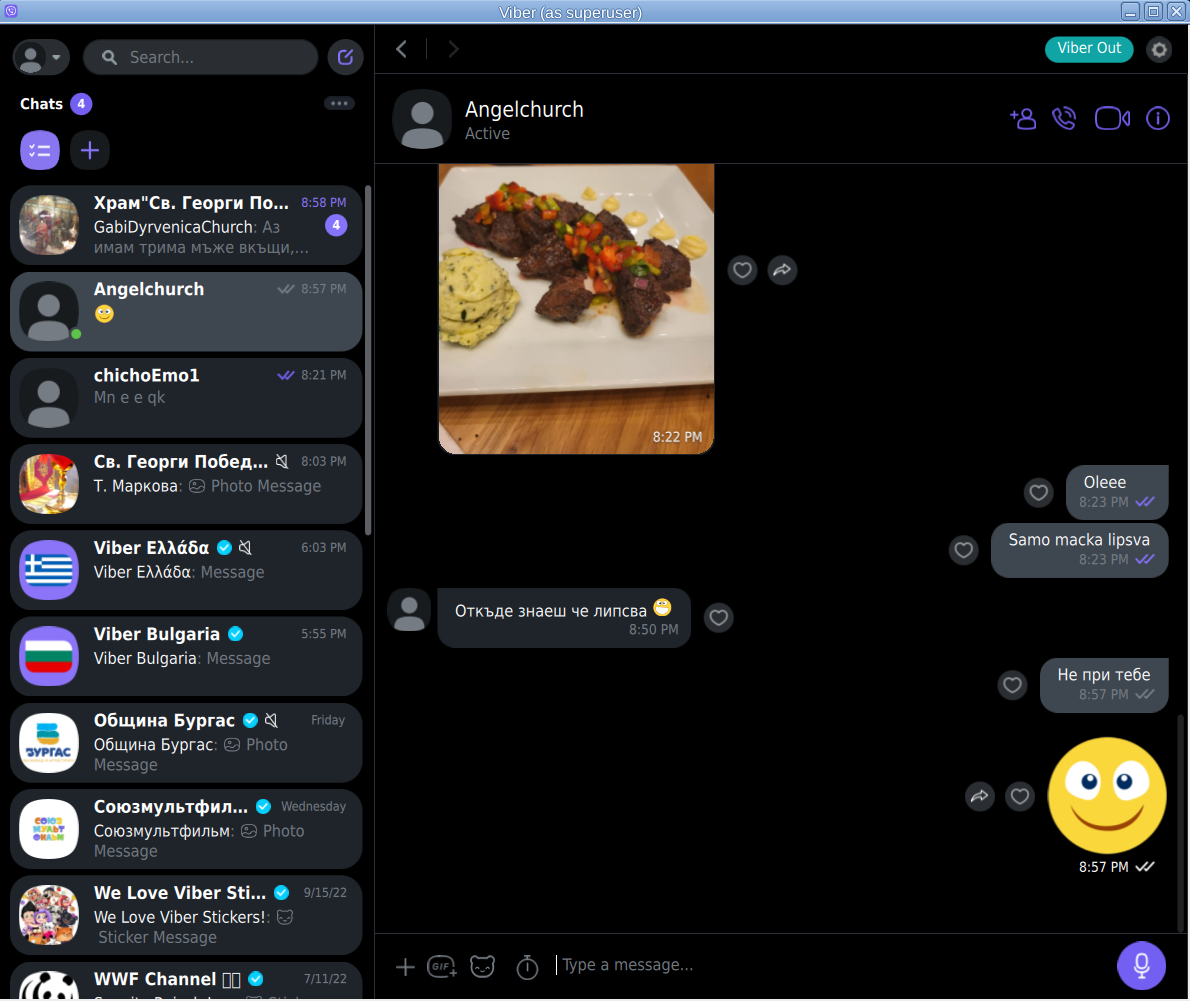
! NOTE ! The Linux version of Viber is missing Backups options, exclusively the Settings -> Account -> Viber backup menus is missing, but the good news is that if you're using the Viber client
as a secondary device message client, on first login you'll be offered to Synchronize your Viber data with your 1st Active device (usually your Smart Phone). Just click on it and allow the synchronization from your phone and in a while the Contacts and message history should be on the Linux Viber client.
That's it Enjoy your Viber Sound and Video on Linux ! 🙂