Posts Tagged ‘node’

Howto Upgrade IBM Spectrum Protect Backup Client TSM 7.X to 8.1.8, Update Tivoli 8.1.8 to 8.1.11 on CentOS and Redhat Linux

Thursday, December 3rd, 2020


IBM-spectrum-protect-backup-logo-tivoli-tsm-logo

Having another day of a system administrator boredom, we had a task to upgrade some Tivoli TSM Backup clients running on a 20+ machines powered by CentOS and RHEL Linux to prepare the systems to be on the latest patched IBM Spectrum Backup client version available from IBM. For the task of patching I've used a central server where, I've initially downloaded the provided TSM client binaries archives. From this machine, we have copied TivSM*.tar to each and every system that needs to be patched and then patched. The task is not too complex as the running TSM in the machines are all at the same version and all running a recent patched version of Linux. Hence to make sure all works as expected we have tested TSM is upgraded from 7.X.X to 8.X.X on one machine and then test 8.1.8 to 8.1.11 upgrade on another one. Once having confirmed that Backups works as expected after upgrade. We have proceeded to do it massively on each of the rest 20+ hosts.
Below article's goal is to help some lazy sysadmin with the task to prepare an TSM Backup upgrade procedure to standartize TSM Upgrade, which as many of the IBM's softwares is very specific and its upgrade requires, a bit of manual work and extra cautious as there seems to be no easy way (or at least I don't know it), to do the upgrade by simply adding an RPM repository and doing, something like yum install tivsm*.


0. Check if there is at least 2G free of space

According to documentation the minimum space you need to a functional install without having it half installed or filling up your filesystem is 2 Gigabytes of Free Memory on a filesystem where the .tar and rpms will be living.

Thus check what is the situation with your filesystem where you wills store the .tar archice and extract .RPM files / install the RPM files.

# df -h

1. Download the correct tarball with 8.1 Client

On one central machine you would need to download the Tivoli you can do that via wget / curl / lynx whatever is at hand on the Linux server.

As of time of writting this article TSM's 8.1.11 location is at
URL:

http://public.dhe.ibm.com/storage/tivoli-storage-management/maintenance/client/v8r1/Linux/LinuxX86/BA/v8111/

I've made a local download mirror of Tivoli TSM 8.1.11 here.
In case you need to install IBM Spectrum Backup Client to a PCI secured environment to a DMZ-ed LAN network from a work PC you can Download it first from your local PC and via Citrix client upload program or WinSCP upload it to a central replication host from where you will later copy to each of the other server nodes that needs to be upgraded.

Lets Copy archive to all Server hosts where you want it later installed, using a small hack

Assuming you already have an Excel document or a Plain text document with all the IPs of the affected hosts where you will need to get TSM upgraded. Extract this data and from it create a plain text file /home/user/hosts.txt containing all the machine IPs lined up separated with carriage return separations (\n), so you can loop over each one and use scp to send the files.

– Replicate Tivoli tar to all machine hosts where you want to get IBM Spectrum installed or upgraded.
Do it with a loop like this:

# for i in $(cat hosts.txt); do scp 8.1.11.0-TIV-TSMBAC-LinuxX86.tar user@$i:/home/user/; done

 Copy to a Copy buffer temporary your server password assuming all your passwords to each machine are identical and paste your login user pass for each host to initiate transfer
 

2. SSH to each of the Machine hosts IPs

Once you login to the host you want to upgrade
Go to your user $HOME /home/user and create files where we'll temporary store Tivoli archive files and extract RPMs

[root@linux-server user]# mkdir -p ~/tsm/TSM_BCK/
[root@linux-server user]# mv 8.1.11.0-TIV-TSMBAC-LinuxX86.tar ~/tsm
[root@linux-server user]# cd tsm
[root@linux-server user]# tar -xvvf 8.1.11.0-TIV-TSMBAC-LinuxX86.tar
gskcrypt64-8.0.55.17.linux.x86_64.rpm
GSKit.pub.pgp
gskssl64-8.0.55.17.linux.x86_64.rpm
README_api.htm
README.htm
RPM-GPG-KEY-ibmpkg
TIVsm-API64.x86_64.rpm
TIVsm-APIcit.x86_64.rpm
TIVsm-BAcit.x86_64.rpm
TIVsm-BAhdw.x86_64.rpm
TIVsm-BA.x86_64.rpm
TIVsm-filepath-source.tar.gz
TIVsm-JBB.x86_64.rpm
TIVsm-WEBGUI.x86_64.rpm
update.txt

3. Create backup of old backup files

It is always a good idea to keep old backup files

[root@linux-server tsm]# cp -av /opt/tivoli/tsm/client/ba/bin/dsm.opt ~/tsm/TSM_BCK/dsm.opt_bak_$(date +'%Y_%M_%H')
[root@linux-server tsm]# cp -av /opt/tivoli/tsm/client/ba/bin/dsm.sys ~/tsm/TSM_BCK/dsm.sys_bak_$(date +'%Y_%M_%H')

[root@linux-server tsm]# [[ -f /etc/adsm/TSM.PWD ]] && cp -av /etc/adsm/TSM.PWD ~/TSM_BCK/ || echo 'file doesnt exist'

/etc/adsm/TSM.PWD this file is only there as legacy for TSM it contained encrypted passwords inver 7 for updates. In TSM v.8 encryption file is not there as new mechanism for sensitive data was introduced.
Be aware that from Tivoli 8.X it will return error
exist'

!! Note – if dsm.opt , dsm.sys files are on different locations – please use correct full path locations !!

4. Stop  dsmcad – TSM Service daemon

[root@linux-server tsm]# systemctl stop dsmcad

5. Locate and deinstall all old Clients

Depending on the version to upgrade if you're upgrading from TSM version 7 to 8, you will get output like.

[root@linux-server tsm]# rpm -qa | grep 'TIVsm-'
TIVsm-BA-7.1.6-2.x86_64
TIVsm-API64-7.1.6-2.x86_64

If you're one of this paranoid admins you can remove TIVsm packs  one by one.

[root@linux-server tsm]# rpm -e TIVsm-BA-7.1.6-2.x86_64
[root@linux-server tsm]# rpm -e TIVsm-API64-7.1.6-2.x86_64

Instead if upgrading from version 8.1.8 to 8.1.11 due to the Security CVE advisory recently published by IBM e.g. (IBM Runtime Vulnerability affects IBM Spectrum Backup archive Client) and  vulnerability in Apache Commons Log4J affecting IBM Spectrum Protect Backup Archive Client.

[root@linux-server tsm]# rpm -qa | grep 'TIVsm-'
TIVsm-API64-8.1.8-0.x86_64
TIVsm-BA-8.1.8-0.x86_64

Assuming you're not scared of a bit automation you can straight do it with below one liner too 🙂

# rpm -e $(rpm -qa | grep TIVsm)

[root@linux-server tsm]# rpm -qa | grep gsk
[root@linux-server tsm]# rpm -e gskcrypt64 gskssl64

6. Check uninstallation success:

[root@linux-server tsm]# rpm -qa | grep TIVsm
[root@linux-server tsm]# rpm -qa | grep gsk

Here you should an Empty output, if packages are not on the system, e.g. Empty output is good output ! 🙂

7. Install new client IBM Spectrum Client (Tivoli Storage Manager) and lib dependencies

[root@linux-server tsm]# rpm -ivh gskcrypt64-8.0.55.4.linux.x86_64.rpm
[root@linux-server tsm]# rpm -ivh gskssl64-8.0.55.4.linux.x86_64.rpm

 If you're lazy to type you can do as well

[root@linux-server tsm]# rpm -Uvh gsk*

Next step is to install main Tivoli SM components the the API files and BA (The Backup Archive Client)

[root@linux-server tsm]# rpm -ivh TIVsm-API64.x86_64.rpm
[root@linux-server tsm]# rpm -ivh TIVsm-BA.x86_64.rpm

If you have to do it on multiple servers and you do it manually following a guide like this, you might instead want to install them with one liner.

[root@linux-server tsm]# rpm -ivh TIVsm-API64.x86_64.rpm TIVsm-BA.x86_64.rpm

There are some Not mandatory "Common Inventory Technology" components (at some cases if you're using the API install it we did not need that), just for the sake if you need them on your servers due to backup architecture, install also below commented rpm files.

## rpm -ivh TIVsm-APIcit.x86_64.rpm

## rpm -ivh TIVsm-BAcit.x86_64.rpm

These packages not needed only for operation WebGUI TSM GUI management, (JBB) Journal Based Backup, BAhdw (the ONTAP library)


— TIVsm-WEBGUI.x86_64.rpm
— TIVsm-JBB.x86_64.rpm
— TIVsm-BAhdw.x86_64.rpm

8. Start and enable dsmcad service

[root@linux-server tsm]# systemctl stop dsmcad

You will get

##Warning: dsmcad.service changed on disk. Run 'systemctl daemon-reload' to reload units.

[root@linux-server tsm]# systemctl daemon-reload

[root@linux-server tsm]# systemctl start dsmcad


## enable dsmcad – it is disabled by default after install

[root@linux-server ~]# systemctl enable dsmcad

[root@linux-server tsm]# systemctl status dsmcad

9. Check dmscad service is really running

Once enabled IBM TSM will spawn a process in the bacground dmscad if it started properly you should have the process backgrounded.

[root@linux-server tsm]# ps -ef|grep -i dsm|grep -v grep
root      2881     1  0 18:05 ?        00:00:01 /usr/bin/dsmcad

If process is not there there might be some library or something not at place preventing the process to start …

10. Check DSMCAD /var/tsm logs for errors

After having dsmcad process enabled and running in background

[root@linux-server tsm]# grep -i Version /var/tsm/sched.log|tail -1
12/03/2020 18:06:29   Server Version 8, Release 1, Level 10.000


[root@linux-server tsm]# cat /var/tsm/dsmerror.log

To see the current TSM configuration files we can  grep out comments *

[root@linux-server tsm]# grep -v '*' /opt/tivoli/tsm/client/ba/bin/dsm.sys

Example Configuration of the agent:
—————————————————-
   *TSM SERVER NODE Location
   Servername           tsm_server
   COMMmethod           TCPip
   TCPPort              1400
   TCPServeraddress     tsmserver2.backuphost.com
   NodeName             NODE.SERVER-TO-BACKUP-HOSTNAME.COM
   Passwordaccess       generate
   SCHEDLOGNAME         /var/tsm/sched.log
   SCHEDLOGRETENTION    21 D
   SCHEDMODE            POLLING
   MANAGEDServices      schedule
   ERRORLOGNAME         /var/tsm/dsmerror.log
   ERRORLOGRETENTION    30 D
   INCLEXCL             /opt/tivoli/tsm/client/ba/bin/inclexcl.tsm

11. Remove tsm install directory tar ball and rpms to save space on system

The current version of Tivoli service manager is 586 Megabytes.

[root@linux-server tsm]# du -hsc 8.1.11.0-TIV-TSMBAC-LinuxX86.tar
586M    8.1.11.0-TIV-TSMBAC-LinuxX86.tar

Some systems are on purpose configured to have less space under their /home directory,
hence it is a good idea to clear up unnecessery files after completion.

Lets get rid of all the IBM Spectrum archive source files and the rest of RPMs used for installation.

[root@linux-server tsm]# rm -rf ~/tsm/{*.tar,*.rpm,*.gpg,*.htm,*.txt}

12. Check backups are really created on the configured remote Central backup server

To make sure after the upgrade the backups are continuously created and properly stored on the IBM Tivoly remote central backup server, either manually initiate a backup or wait for lets say a day and run dsmc client to show all created backups from previous day. To make sure you'll not get empty output you can on purpose modify some file by simply opening it and writting over without chaning anything e.g. modify your ~/.bashrc or ~/.bash_profile

## List all backups for '/' root directory from -fromdate='DD/MM/YY'

[root@linux-server tsm]# dsmc
Protect>
IBM Spectrum Protect
Command Line Backup-Archive Client Interface
  Client Version 8, Release 1, Level 11.0
  Client date/time: 12/03/2020 18:14:03
(c) Copyright by IBM Corporation and other(s) 1990, 2020. All Rights Reserved.

Node Name: NODE.SERVER-TO-BACKUP-HOSTNAME.COM
Session established with server TSM2_SERVER: AIX
  Server Version 8, Release 1, Level 10.000
  Server date/time: 12/03/2020 18:14:04  Last access: 12/03/2020 18:06:29
 
Protect> query backup -subdir=yes "/" -fromdate=12/3/2020
           Size        Backup Date                Mgmt Class           A/I File
           —-        ———–                ———-           — —-
         6,776  B  12/03/2020 01:26:53             DEFAULT              A  /etc/freshclam.conf
         6,685  B  12/03/2020 01:26:53             DEFAULT              A  /etc/freshclam.conf-2020-12-02
         5,602  B  12/03/2020 01:26:53             DEFAULT              A  /etc/hosts
         5,506  B  12/03/2020 01:26:53             DEFAULT              A  /etc/hosts-2020-12-02
           398  B  12/03/2020 01:26:53             DEFAULT              A  /opt/tivoli/tsm/client/ba/bin/tsmstats.ini
       114,328  B  12/03/2020 01:26:53             DEFAULT              A  /root/.bash_history
           403  B  12/03/2020 01:26:53             DEFAULT              A  /root/.lesshst

What is Vertical scaling and Horizontal scaling – Vertical and Horizontal hardware / services scaling

Friday, June 13th, 2014

horizontal-vs-vertical-scaling-vertical-and-horizontal-scaling-explained-diagram

If you're coming from a small or middle-sized company to a corporations like HP or IBM probably you will not a clear defined idea on the 2 types (2 dimensions) of system Scaling (Horizontal and Vertical scaling). I know from my pesronal experience that in small companies – all needed is to guarantee a model for as less probels as possible without too much of defining things and with much less planning. Other thing is being a sysadmin in middle-sized companies, often doesn't give you opportunity to discuss issues to solve with other admins but you have to deal as "one man (machine) for all" and thus often to solve office server and services tasks you do some custom solution.
hence for novice system administrators probably it will be probably unclear what is the difference between Horizontal and Vertical Scaling?

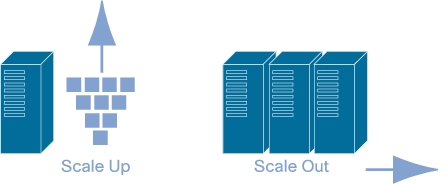
horizontal-vertical-scaling-scale-up-and-scale-out-server-infrastructure-diagram


Vertical Scaling (scale vertically or scale up) :- adding more resources(CPU/RAM/DISK) to your server (database or application server is still remains one).
Vertical Scaling is much more used in small and middle-sized companies and in applications and products of middle-range. Very common example for Virtual Scaling nowdays is to buy an expensive hardware and use it as a Virtual Machine hypervisor (VMWare ESX). Where a database is involved using Vertical Scaling without use of multiple virtual machines might be not the best solution, as even though hardware might suffice (creation of database locks might impose problems). Reasons to scale vertically include increasing IOPS (Input / Ouput Operations), increasing CPU/RAM capacity, and increasing disk capacity.
Because Vertical Scaling usually means upgrade of server hardware – whenever an improved performance is targeted, even though if Virtualization is used, the risk for downtimes with it is much higher than whenever horizontal scaling.

Horizontal Scaling (scale horizontally or scale out):- adding more processing units (phyiscal machine) to your server (infrastructure be it application web/server or database).
Horizontal scaling, means increasing  the number of nodes in the cluster, reduces the responsibilities of each member node by spreading the keyspace wider and providing additional end-points for client connections. The capacity of each individual node does not change, but its load is decreased (because load is distributed between separate server nodes). Reasons to scale horizontally include increasing I/O concurrency, reducing the load on existing nodes, and increasing disk capacity.
Horizontal Scaling has been historically much more used for high level of computing and for application and services. The Internet and particular web services gave a boom of Horizontal Scaling use, most companies nowadays that provide well known web services like Google (Gmail, Youtube), Yahoo, Facebook, Ebay, Amazon etc. are using heavily horizontal scaling. Horizontal Scaling is a must use technology – whenever a high availability of (server) services are required.

Tracking graphically MySQL, Apache and Network performance in web with Munin on Debian Linux

Saturday, March 19th, 2011

munin_monitor_cpu_network_hard_drive_apache_mysql_performance-in-web-on-linux_logo

Munin is great software for surveillance software for your MySQL, Apache, Qmail, Postfix and many other of the classical daemon services which most of the Linux, BSD servers online are running on.

1. Munin on Debian Linux is really easy to be installed and comes to executing:

debian:~# apt-get install munin munin-node munin-plugins-extra

2. Link /var/www/munin/ to some VirtualHost or ServerHost
For instance if your munin is to be placed on the domain www.pc-freak.net.net which has the DocumentRoot of /var/www

debian:~# cd /var/www
debian:/var/www# ln -sf /var/www/munin munin

3. Add some extra MySQL related plugins

To check whole list of pmunin plugins you can enable check in /etc/munin/plugins directory

Lets say our Munin will be providing statistics mainly for MySQL, enable this bunch of plugins:

cd /etc/munin/plugins
ln -s /usr/share/munin/plugins/mysql_ mysql_
ln -s /usr/share/munin/plugins/mysql_bytes mysql_bytes
ln -s /usr/share/munin/plugins/mysql_innodb mysql_innodb
ln -s /usr/share/munin/plugins/mysql_isam_space_ mysql_isam_space_
ln -s /usr/share/munin/plugins/mysql_queries mysql_queries
ln -s /usr/share/munin/plugins/mysql_slowqueries mysql_slowqueries
ln -s /usr/share/munin/plugins/mysql_threads mysql_threads


Though above command would enable mysql monitoring it will be not working out of the box. You will find in munin logs error like:

Missing dependency Cache::Cache at /usr/share/munin/plugins/mysql_ line 716."

To fix this install libcache-perl and libcache-cache-perl

apt-get install --yes libcache-perl libcache-cache-perl
 

Then regenerate munin plugin configuration issue cmd:

munin-node-configure --suggest --shell | sh

and restart Munin-node server

service munin-node restart
 

Munin Node should be able login to the MySQL server using the Debian System Maintenance user however if you should need to create a custom user you can add the following configuration to:
 

/etc/munin/plugin-conf.d/munin-node


[mysql*]
    user root
    env.mysqluser muninmonitor
    env.mysqlpassword Your-Secret-Password

4. Edit Munin config

Make sure you have at least the following variables enabled in /etc/munin/munin.conf
 

 dbdir  /var/lib/munin
 htmldir /var/cache/munin/www
 logdir /var/log/munin
 rundir  /var/run/munin

 tmpldir    /etc/munin/templates

includedir /etc/munin/munin-conf.d

[localhost.localdomain]
    address 127.0.0.1
    use_node_name yes


5. Add Munin Alias or Virtualhost

To make Munin Accessible from Webserver you need to at least add an alias create a file
/etc/apache2/conf.d/munin with following content:

vim /etc/apache2/conf.d/munin

Alias /munin /var/cache/munin/www

<Directory /var/cache/munin/www>
        Order allow,deny
        #Allow from localhost 127.0.0.0/8 ::1
        Allow from all
        Options None
        php_value engine off

    <IfModule mod_expires.c>
        ExpiresActive On
        ExpiresDefault M310
    </IfModule>

</Directory>


If you want to access Munin from Apache subdomain create it lets say you want to access it via stats.www.pc-freak.net, use following config file:

vi /etc/apache2/sites-enabled/stats.www.pc-freak.net
 

<VirtualHost *>
   ServerAdmin hipo@www.pc-freak.net
   ServerName stats.www.pc-freak.net
   DocumentRoot /var/cache/munin/www
   <Directory />
       Options FollowSymLinks
       #AllowOverride All
       php_value engine off
   </Directory>
   LogLevel debug
   CustomLog /var/log/apache2/munin/access.log combined
   ErrorLog /var/log/apache2/munin/error.log
   ServerSignature On
<Directory /var/cache/munin/www>
        Order allow,deny
        #Allow from localhost 127.0.0.0/8 ::1
        Allow from all
        Options FollowSymlinks
        #AllowOverride All
        php_value engine off

</Directory>

</VirtualHost>


6. Restart Apache;

debian:~# /etc/init.d/apache2 restart

Now to access the newly installed munin point your favorite browser to (either the subdirectory configured for access or the Virtualhost subdomain):

https://www.pc-freak.net/munin/
or
http://munin.www.pc-freak.net

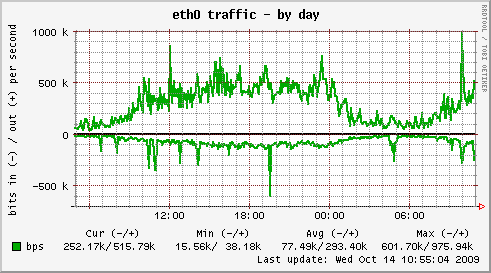
eth0-network-traffic-munin-server-statistics

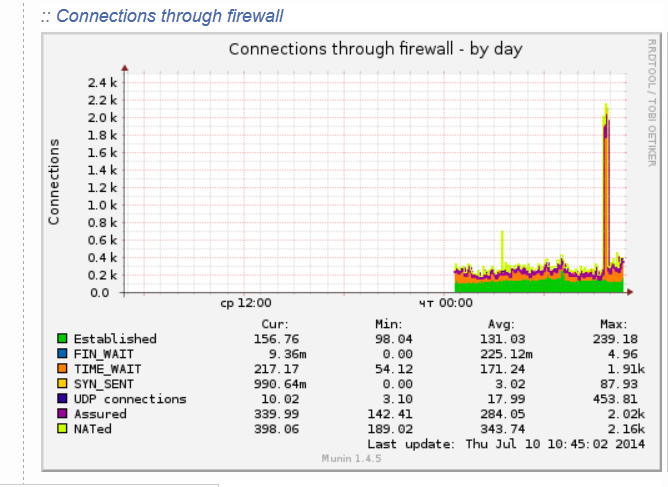
connections_through_firewall-statistics-munin-debian-linux
7. Protecting Munin with a password

As it could be a security leak to expose statistics regarding your server (Disk I/O, Memory, Load Avarage, Apache, MySQL Postfix) operations it is good security practice to protect munin with a password.

I've earlied blogged on how to protect your server munin web-statistics wtih an htaccess password (read it here)


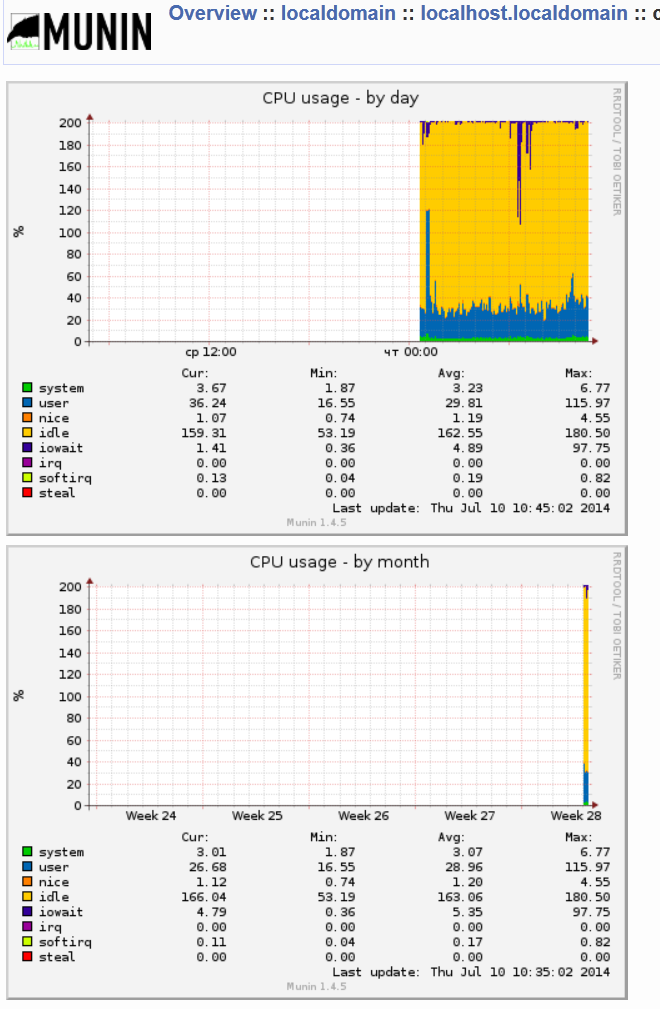
munin-cup-statistics-by-day-and-by-month-screenshot

Happy Monitoring

How to check if your Linux WebServer is under a DoS attack

Friday, July 22nd, 2011

There are few commands I usually use to track if my server is possibly under a Denial of Service attack or under Distributed Denial of Service

Sys Admins who still have not experienced the terrible times of being under a DoS attack are happy people for sure …

1. How to Detect a TCP/IP Denial of Service Attack This are the commands I use to find out if a loaded Linux server is under a heavy DoS attack, one of the most essential one is of course netstat.
To check if a server is under a DoS attack with netstat, it’s common to use:

linux:~# netstat -ntu | awk '{print $5}' | cut -d: -f1 | sort | uniq -c | sort -n|wc -l

If the output of below command returns a result like 2000 or 3000 connections!, then obviously it’s very likely the server is under a DoS attack.

To check all the IPS currently connected to the Apache Webserver and get a very brief statistics on the number of times each of the IPs connected to my server, I use the cmd:

linux:~# netstat -ntu | awk '{print $5}' | cut -d: -f1 | sort | uniq -c | sort -n
221 80.143.207.107 233 145.53.103.70 540 82.176.164.36

As you could see from the above command output the IP 80.143.207.107 is either connected 221 times to the server or is in state of connecting or disconnecting to the node.

Another possible way to check, if a Linux or BSD server is under a Distributed DoS is with the list open files command lsof
Here is how lsof can be used to list the approximate number of ESTABLISHED connections to port 80.

linux:~# lsof -i TCP:80
litespeed 241931 nobody 17u IPv4 18372655 TCP server.www.pc-freak.net:http (LISTEN)
litespeed 241931 nobody 25u IPv4 18372659 TCP 85.17.159.89:http (LISTEN)
litespeed 241931 nobody 30u IPv4 29149647 TCP server.www.pc-freak.net:http->83.101.6.41:54565 (ESTABLISHED)
litespeed 241931 nobody 33u IPv4 18372647 TCP 85.17.159.93:http (LISTEN)
litespeed 241931 nobody 34u IPv4 29137514 TCP server.www.pc-freak.net:http->83.101.6.41:50885 (ESTABLISHED)
litespeed 241931 nobody 35u IPv4 29137831 TCP server.www.pc-freak.net:http->83.101.6.41:52312 (ESTABLISHED)
litespeed 241931 nobody 37w IPv4 29132085 TCP server.www.pc-freak.net:http->83.101.6.41:50000 (ESTABLISHED)

Another way to get an approximate number of established connections to let’s say Apache or LiteSpeed webserver with lsof can be achieved like so:

linux:~# lsof -i TCP:80 |wc -l
2100

I find it handy to keep track of above lsof command output every few secs with gnu watch , like so:

linux:~# watch "lsof -i TCP:80"

2. How to Detect if a Linux server is under an ICMP SMURF attack

ICMP attack is still heavily used, even though it’s already old fashioned and there are plenty of other Denial of Service attack types, one of the quickest way to find out if a server is under an ICMP attack is through the command:

server:~# while :; do netstat -s| grep -i icmp | egrep 'received|sent' ; sleep 1; done
120026 ICMP messages received
1769507 ICMP messages sent
120026 ICMP messages received
1769507 ICMP messages sent

As you can see the above one liner in a loop would check for sent and recieved ICMP packets every few seconds, if there are big difference between in the output returned every few secs by above command, then obviously the server is under an ICMP attack and needs to hardened.

3. How to detect a SYN flood with netstat

linux:~# netstat -nap | grep SYN | wc -l
1032

1032 SYNs per second is quite a high number and except if the server is not serving let’s say 5000 user requests per second, therefore as the above output reveals it’s very likely the server is under attack, if however I get results like 100/200 SYNs, then obviously there is no SYN flood targetting the machine 😉

Another two netstat command application, which helps determining if a server is under a Denial of Service attacks are:

server:~# netstat -tuna |wc -l
10012

and

server:~# netstat -tun |wc -l
9606

Of course there also some other ways to check the count the IPs who sent SYN to the webserver, for example:

server:~# netstat -n | grep :80 | grep SYN |wc -l

In many cases of course the top or htop can be useful to find, if many processes of a certain type are hanging around.

4. Checking if UDP Denial of Service is targetting the server

server:~# netstat -nap | grep 'udp' | awk '{print $5}' | cut -d: -f1 | sort |uniq -c |sort -n

The above command will list information concerning possible UDP DoS.

The command can easily be accustomed also to check for both possible TCP and UDP denial of service, like so:

server:~# netstat -nap | grep 'tcp|udp' | awk '{print $5}' | cut -d: -f1 | sort |uniq -c |sort -n
104 109.161.198.86
115 112.197.147.216
129 212.10.160.148
227 201.13.27.137
3148 91.121.85.220

If after getting an IP that has too many connections to the server and is almost certainly a DoS host you would like to filter this IP.

You can use the /sbin/route command to filter it out, using route will probably be a better choice instead of iptables, as iptables would load up the CPU more than simply cutting the route to the server.

Here is how I remove hosts to not be able to route packets to my server:

route add 110.92.0.55 reject

The above command would null route the access of IP 110.92.0.55 to my server.

Later on to look up for a null routed IP to my host, I use:

route -n |grep -i 110.92.0.55

Well hopefully this should be enough to give a brief overview on how, one can dig in his server and find if he is under a Distributed Denial of Service, hope it’s helpful to somebody out there.
Cheers 😉

Web Application Load Balancer types and when to use what kind of Load Balancer

Monday, February 3rd, 2014

General load balancer types description / active / passive / static / dynamic and additional
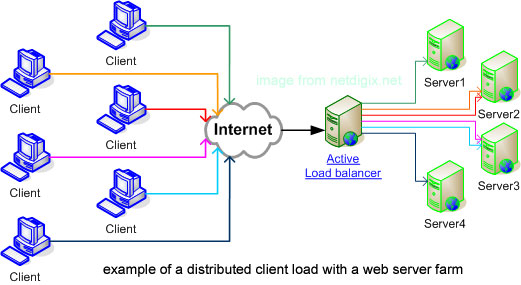
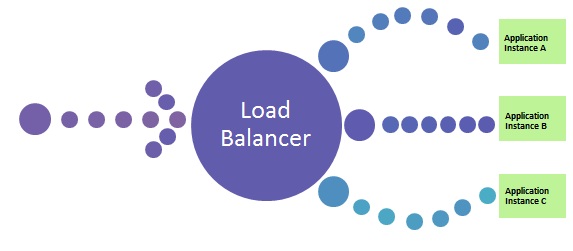
In this small article I will try to clear it up the general types of Web Server Load Balancers available. Whether one choose a Load Balancer he has the option to use a software LB or a hardware LB one there are plenty of software load balancer scripts out there. In this pos t I will mention just what choice is available in hardware load balancer interface BigIP LTM F5 standard. Generally BigIP LTM Load Balancers can be grouped in Static, Dynamic and Additional. One or more Load Balancers can be configured in front of group or farm of appplication servers. When more than one load balancer is used in front of application Load Balancer could be Active Load Balancer and Passive Load Balancer.
Below information will hopefully be useful to Web and Middleware working sys admins and anybody involved in frequent and large web systems integration.

Static Load Balancing

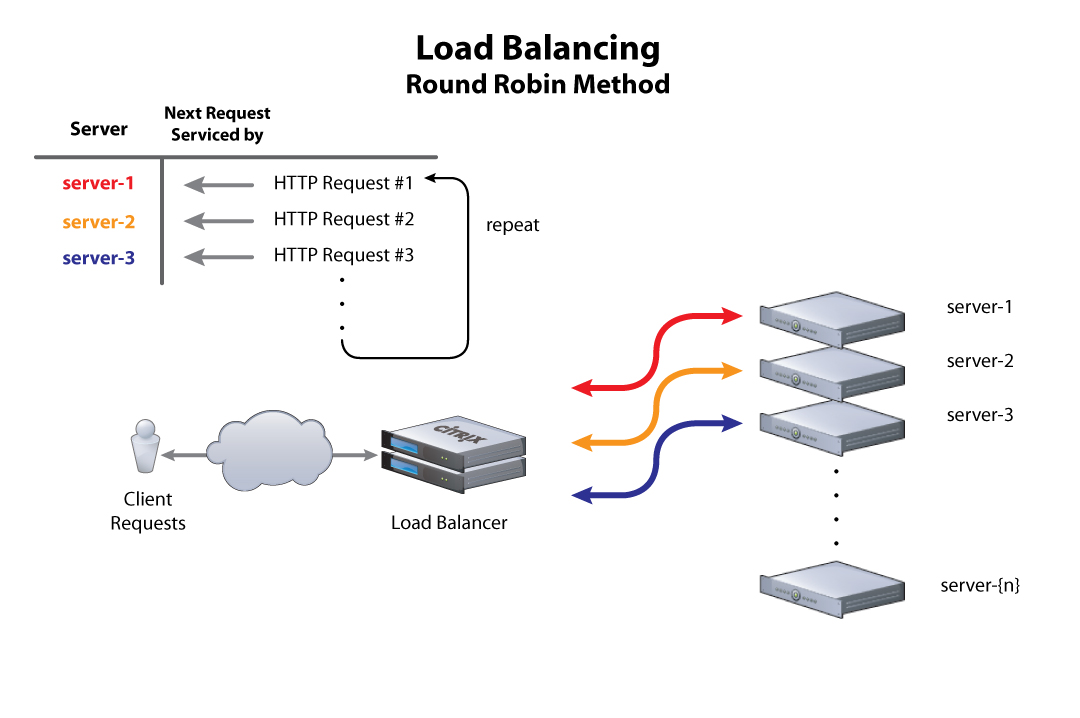
LB_RoundRobin_ type of load balancing example picture


Round Robin
Load Balancing

This is the default load balancing method. Round Robin mode passes each new connection request to the next server in line, eventually distributing connections evenly across the array of machines being load balanced.
Round Robin mode works well in most configurations, especially if the equipment that you are load balancing is roughly equal in processing speed and memory.

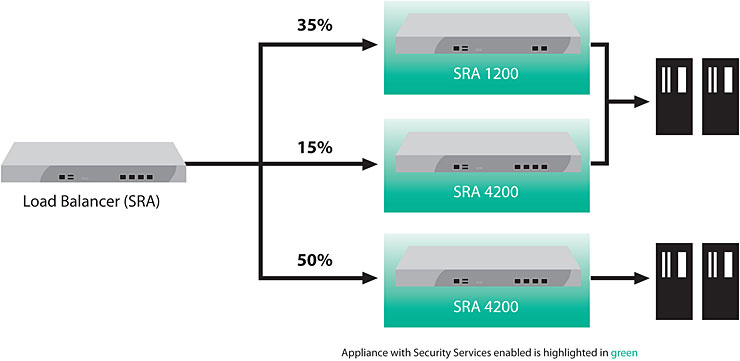
ratio_member_load_balancer picture diagram

Ratio (member) / Ratio (node) Load Balancer

   
The Ratio (member) system distributes connections among pool members or nodes in a static rotation according to ratio weights that you define. In this case, the number of connections that each system receives over time is proportionate to the ratio weight you defined for each pool member or node. You set a ratio weight when you create each pool member or node.

These are static load balancing methods, basing distribution on user-specified ratio weights that are proportional to the capacity of the servers.

dynamic_ratio_member_load_balancer picture diagram

Dynamic Load Balancers


Dynamic Ratio (member) Dynamic Ratio (node) LB

The Dynamic Ratio load balancing select a server based on various aspects of real-time server performance analysis. These methods are similar to the Ratio methods, except that with Dynamic Ratio methods, the ratio weights are system-generated, and the values of the ratio weights are not static. These methods are based on continuous monitoring of the servers, and the ratio weights are therefore continually changing.
   
The Dynamic Ratio LBs are used specifically for load balancing traffic to RealNetworks® RealSystem® Server platforms, Windows® platforms equipped with Windows Management Instrumentation (WMI), or any server equipped with an SNMP agent such as the UC Davis SNMP agent or Windows 2000 Server SNMP agent.

dynamic_load_balancing load balancer diagram picture with circles

Fastest (node) /Fastest (application) LB

   
The Fastest methods select a server based on the least number of current sessions. The following rules apply to the Fastest load balancing methods:

These LB require that you assign both a Layer 7 and a TCP type of profile to the virtual server interface where LB IP is binded.
If a Layer 7 profile is not configured, the virtual server falls back to Least Connections load balancing mode.

Note: If the OneConnect feature is enabled, the Least Connections methods do not include idle connections in the calculations when selecting a pool member or node. The Least Connections balancing use only active connections in their calculations.
   
Fastest node load balancing is useful in environments where nodes are distributed across separate logical networks.


Least Connections (member) / Least Connections (node) LB    

The Least Connections method are relatively simple in that the system passes a new connection to the pool member or node that has the least number of active connections.

Note: If the OneConnect feature is enabled, the Least Connections methods do not include idle connections in the calculations when selecting a pool member or node. The Least Connections methods use only active connections in their calculations.
   
The Least Connections balancing function best in environments where the servers have similar capabilities. Otherwise, some amount of latency can occur.

For example, consider the case where a pool has two servers of differing capacities, A and B. Server A has 95 active connections with a connection limit of 100, while server B has 96 active connections with a much larger connection limit of 500. In this case, the Least Connections method selects server A, the server with the lowest number of active connections, even though the server is close to reaching capacity.

If you have servers with varying capacities, consider using the Weighted Least Connections load balancing instead.


Weighted Least Connections (member) / Weighted Least Connections (node)

Like  Least Connections, these load balancing methods select pool members or nodes based on the number of active connections. However, the Weighted Least Connections methods also base their selections on server capacity.

The Weighted Least Connections (member) method specifies that the system uses the value you specify in Connection Limit to establish a proportional algorithm for each pool member. The system bases the load balancing decision on that proportion and the number of current connections to that pool member. Example is member_a has 40 connections and its connection limit is 200, so it is at 20% of capacity. Similarly, member_b has 40 connections and its connection limit is 400, so it is at 10% of capacity. In this case, the system select selects member_b. This algorithm requires all pool members to have a non-zero connection limit specified.

The Weighted Least Connections (node) method specifies that the system uses the value you specify in the node's Connection Limit setting and the number of current connections to a node to establish a proportional algorithm. This algorithm requires all nodes used by pool members to have a non-zero connection limit specified.

If all servers have equal capacity, these load balancing  behave in the same way as the Least Connections methods.

Note: If the OneConnect feature is enabled, the Weighted Least Connections methods do not include idle connections in the calculations when selecting a pool member or node. The Weighted Least Connections  use only active connections in their calculations.
   

Weighted Least Connections methods work best in environments where the servers have differing capacities.
For example, if two servers have the same number of active connections but one server has more capacity than the other, the BIG-IP system calculates the percentage of capacity being used on each server and uses that percentage in its calculations.


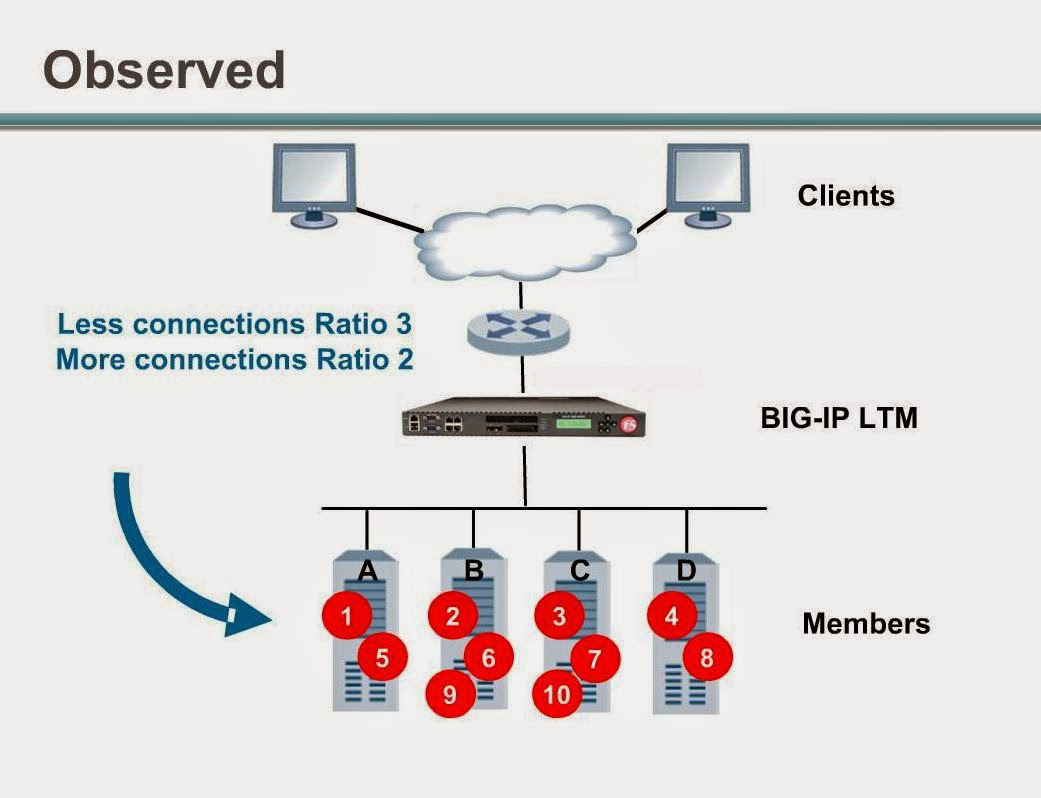
Observed (member) / Observed (node)

With the Observed methods, nodes are ranked based on the number of connections. The Observed methods track the number of Layer 4 connections to each node over time and creates a ratio for load balancing.
   

The need for the Observered methods is rare, and they are not recommended for large pools.

Predictive (member) / Predictive (node)

The Predictive methods use the ranking methods used by the Observed methods, where servers are rated according to the number of current connections. However, with the Predictive methods, the BIG-IP system analyzes the trend of the ranking over time, determining whether a nodes performance is currently improving or declining. The servers with performance rankings that are currently improving, rather than declining, receive a higher proportion of the connections.
   

The need for the Predictive methods is rare, and they are not recommend for large pools.

Least Sessions LB type

The Least Sessions method selects the server that currently has the least number of entries in the persistence table. Use of this load balancing method requires that the virtual server reference a type of profile that tracks persistence connections, such as the Source Address Affinity or Universal profile type.

Note: The Least Sessions methods are incompatible with cookie persistence.
   
The Least Sessions method works best in environments where the servers or other equipment that you are load balancing have similar capabilities.


L3 Address

L3 Address is same LB type as Least Connections methods.
  

How to change hostname permanently on Debian and Ubuntu Linux

Thursday, March 14th, 2013

Change hostname on Debian and Ubuntu Linux terminal hostname screenshot

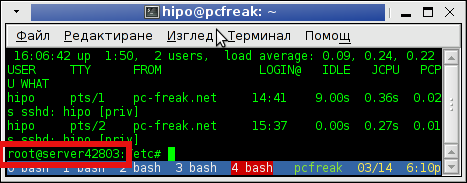
I had to configure a newly purchased dedicated server from UK2. New servers cames shipped with some random assigned node hostname  like server42803. This is pretty annoying, and has to be changed especially if your company has a naming server policy in some format like; company-s1#, company-s2#, company-sN#.

Changing hostname via hosts definition file /etc/hosts to assign the IP address of the host to the hostname is not enough for changing the hostname shown in shell via SSH user login.

To display full hostname on Debian and Ubuntu, had to type:

server42803:~# hostname
server42803.uk2net.com

To change permanently server host to lets say company-s5;

server42803:~# cat /etc/hostname | \
sed -e 's#server42803.uk2net.com#company-s5#' > /etc/hostname

To change for current logged in SSH session:

server42803:~# hostname company-s5
company-s5:~#

Finally because already old hostname is red by sshd, you have to also restart sshd for new hostname to be visible on user ssh:

company-s5:~# /etc/init.d/ssh restart
...

As well as run script:

company-s5:~# /etc/init.d/hostname.sh

Mission change host accomplished, Enjoy 🙂