Posts Tagged ‘hosts’

Build a Central Linux Logging Server to Collect, Store, and Visualize All Infrastructure node Logs

Friday, March 20th, 2026

build-a-central-linux-logging-server-to-collect-store-and-visualize-all-infrastructure-node-logs
If you manage multiple servers or collection of multiple services on many nodes within a company server infrastructure, you know the pain of dealing with logs scattered to multiple locations across systems. It is really crazy and takes up a lot of time and drains energy.
One server shows nothing, another rotated logs yesterday, and your app logs are buried somewhere in /var/log/app.

A central logging server solves this problem, as all logs collected, stored, and accessible in one single place.

In this article will present shortly how to build one using ELK Stack + Beats (lightweight agents) on a Linux server.

1. Architecture Overview

Here’s the typical flow looks like this:

[ Servers / Apps ] –> [ Filebeat / Metricbeat ] –> [ Logstash ] –> [ Elasticsearch ] –> [ Kibana / Grafana (Visualization) ]

  • Beats → Lightweight log shippers installed on all machines.
  • Logstash → Optional pipeline for parsing, filtering, and enriching logs.
  • Elasticsearch → Storage and search engine.
  • Kibana / Grafana → Visualization dashboards.

2. Prepare Your Central Logging Server

Requirements:

  • Debian Linux 12 recommended / Ubuntu or Fedora RHEL
  • At least 4 GB RAM (8+ GB for production ELK)
  • Plan enough SSD storage (logs grow fast)
  • Open ports: 5044 for Beats, 9200 for Elasticsearch, 5601 for Kibana

Install Prerequisites

# apt update && sudo apt install openjdk-17-jdk wget curl apt-transport-https -y

ELK requires Java, OpenJDK 17 should work fine.

3. Install Elasticsearch

# wget https://artifacts.elastic.co/downloads/elasticsearch/elasticsearch-8.11.1-amd64.deb
# dpkg -i elasticsearch-8.11.1-amd64.deb
# systemctl enable elasticsearch
# systemctl start elasticsearch


Check ElasticSearch server is running:

# curl -X GET "localhost:9200/"

That should see the Cluster info in JSON format.

4. Install Kibana

# wget https://artifacts.elastic.co/downloads/kibana/kibana-8.11.1-amd64.deb
# dpkg -i kibana-8.11.1-amd64.deb
# systemctl enable kibana
# systemctl start kibana


Access Kibana URL in browser:

http://<server-ip>:5601

5. Install Logstash to Process logs before sending to Elasticserch

# wget https://artifacts.elastic.co/downloads/logstash/logstash-8.11.1.deb
# dpkg -i logstash-8.11.1.deb
# systemctl enable logstash
# systemctl start logstash

Logstash allows filtering and structuring logs before sending them to Elasticsearch. Example simple pipeline:

# vim /etc/logstash/conf.d/syslog.conf

input {
  beats {
    port => 5044
  }
}
filter {
  grok { match => { "message" => "%{SYSLOGTIMESTAMP:timestamp} %{SYSLOGHOST:host} %{DATA:program}: %{GREEDYDATA:message}" } }
}
output {
  elasticsearch {
    hosts => [“localhost:9200”]
    index => "central-logs-%{+YYYY.MM.dd}"
  }
}

Start Logstash

# systemctl restart logstash

6. Install Beats on Client Machines

On each server you want to monitor:

# apt install filebeat metricbeat -y


Configure Filebeat

Edit config

# vim  /etc/filebeat/filebeat.yml

Set the output to your central server:

output.logstash:

hosts: [":5044"]

Start the agent:

systemctl enable filebeat
systemctl start filebeat

Do the same for Metricbeat if you want metrics like CPU, memory, disk.

7. Create Dashboards in Kibana or Grafana

  • In Kibana, use Discover to view logs.
  • Create visualizations for errors, warnings, top endpoints, etc.
  • Use Grafana if you want multi-source dashboards, combining logs and metrics.

8. Optional: Secure Your Logging Server

  • Enable TLS/SSL in Beats and Elasticsearch.
  • Use firewall rules to restrict access.
  • Create dedicated users in Elasticsearch for log access.

9. Maintenance Tips

  • Index Lifecycle Management → Rotate daily and delete old logs automatically.
  • Monitor disk usage → Logs grow fast. SSDs are better.
  • Filter noise → Don’t ship debug logs unless needed.
  • Backup Elasticsearch → Especially if logs are critical.

Sum Up, how it Works

  • All logs are centralized → easier troubleshooting.
  • Scalable → add new servers, Beats handle shipping automatically.
  • Searchable → find errors instantly using Elasticsearch.
  • Visual → dashboards in Kibana/Grafana give real-time insight.

How to Install and Use Kibana for Log Visualization

Wednesday, February 18th, 2026

/images/kibana-logo how to install it on linux
I saw Kibana in my professional career and I find it a very interesting tool for sysadmins, so I thought it might be helpful to someone out there to write a small article on how to install and use to to visualize data inside some elasticsearch software.

Kibana is an open-source data visualization and exploration tool used to analyze large volumes of data, especially logs. It is part of the ELK Stack (Elasticsearch, Logstash, Kibana), and is commonly used for centralized log management, security monitoring, and observability.

Kibana is often used in the so-called ELK pipeline for log file collection, analysis and visualization:

  • Elasticsearch is for searching, analyzing, and storing your data
  • Logstash (and Beats) is for collecting and transforming data, from any source, in any format
  • Kibana is a portal for visualizing the data and to navigate within the elastic stack
     

In this article, you'll learn how to:

  • Install Kibana
  • Connect it to Elasticsearch
  • Visualize log data
  • Use its basic features

Prerequisites

Before installing Kibana, make sure you have the following:

  • A Linux server running (Ubuntu / Debian / CentOS / RHEL)
  • Elasticsearch installed and running
  • Root or sudo access

Install Kibana

I. On Debian/Ubuntu
 

  1. Import the Elastic GPG key:

# wget -qO – https://artifacts.elastic.co/GPG-KEY-elasticsearch | sudo apt-key add –

  1. Add the repository:

# echo "deb https://artifacts.elastic.co/packages/8.x/apt stable main" | sudo tee -a /etc/apt/sources.list.d/elastic-8.x.list

  1. Update and install:


# apt update

# apt install kibana

II. On RHEL/CentOS Linux

  1. Create repo file:

# tee /etc/yum.repos.d/elastic.repo <<EOF

[elastic-8.x]

name=Elastic repository for 8.x packages

baseurl=https://artifacts.elastic.co/packages/8.x/yum

gpgcheck=1

gpgkey=https://artifacts.elastic.co/GPG-KEY-elasticsearch

enabled=1

autorefresh=1

type=rpm-md

EOF

  1. Install Kibana:

# yum install kibana

2. Configure Kibana

The configuration file is located at:

/etc/kibana/kibana.yml

Edit the file:

# vim /etc/kibana/kibana.yml

Update or add the following:
 

# Server settings
server.port: 5601
server.host: "0.0.0.0"

# Elasticsearch connection
elasticsearch.hosts: [“http://localhost:9200”]

# Logging
logging.level: info

# Security (only if Elasticsearch security is enabled)
# elasticsearch.username: "kibana_system"
# elasticsearch.password: "your_password_here"

Optional: Set basic auth or SSL settings if needed.


3. Start and Enable Kibana

# systemctl enable kibana

# systemctl start kibana

Check status:

# systemctl status kibana


4. Access Kibana Web Interface

Open your browser and go to:

http://<your-server-ip>:5601

You’ll be welcomed with the Kibana dashboard.

5. Import and Visualize Logs

Option A: Use Filebeat to Send Logs

Install Filebeat on the server with logs and configure it to send data to Elasticsearch. Kibana will then be able to visualize it.

# apt install filebeat

# filebeat modules enable system

# filebeat setup

# systemctl start filebeat

Option B: Ingest Logs via Logstash or Elasticsearch API

If you already have data in Elasticsearch, Kibana will automatically detect indices.
 

6. Create Index Pattern

  1. In Kibana, go to Stack Management -> Index Patterns
  2. Click Create Index Pattern
  3. Enter the name (e.g., filebeat-*)
  4. Select the timestamp field (usually @timestamp)
  5. Save

Now Kibana knows how to query and visualize your data.

7. Create Visualizations and Dashboards

  1. Go to Visualize -> Create visualization
  2. Choose a type (bar, pie, line, etc.)
  3. Select an index pattern
  4. Configure metrics and buckets

You can then save visualizations and add them to dashboards.

8. Secure Kibana

  • Configure TLS/SSL for Kibana / ElasticSearch (such as Logstash)
  • Use additional Elastic Security features like RBAC (Role Based Access Control, SSO (Single Sign On)
  • Secure Kibana with a reverse proxy (e.g., Nginx + Basic Auth or Apache / Haproxy infront)

Example Nginx config simple snippet:

location / {

  proxy_pass http://localhost:5601;

  auth_basic "Restricted";

  auth_basic_user_file /etc/nginx/.htpasswd;

}


What is Kibana used for and what it can do for you?

Use Case

Description

Log Monitoring

Visualize system and application logs in real time

Security Analytics

Detect anomalies, failed logins, suspicious activity

DevOps Dashboards

Track uptime, error rates, and system performance

SIEM

Use Elastic Security for threat detection


Once Kibana is installed on a server, you typically use it to visualize and explore data stored in Elasticsearch. Here’s a practical guide with sample usage scenarios:

Access Kibana

After installation, Kibana usually runs on port 5601 by default.

http://<your-server-ip>:5601

  • Open this URL in a browser.
  • You should see the Kibana dashboard.

Connect to Elasticsearch

Kibana automatically connects to your Elasticsearch instance if installed locally.
You can verify the connection:

GET /_cluster/health

  • Go to Dev ToolsConsole in Kibana.
  • Run the above query to check cluster status.

Visualize Data

Kibana allows multiple types of visualizations:

  • Bar/line chart: trends over time.
  • Pie chart: distribution of values.
  • Data table: top IP addresses or most visited URLs.
  • Maps: geolocation of IP addresses.

Create Dashboards

  • Combine multiple visualizations in a Dashboard.
  • Useful for monitoring logs, metrics, or application performance.
  • Example: Create a dashboard with:


    • Requests per URL (bar chart)
    • Requests over time (line chart)
    • Top client IPs (data table)
    • Errors by type (pie chart)

 Search & Query Logs

  • Use Discover to search logs interactively.
  • Example KQL query:

status:500 AND url:"/login"

This finds all failed login requests.

Set Alerts (Optional)

  • Kibana’s Alerts and Actions can trigger notifications (email, Slack, etc.) when certain thresholds are crossed.
  • Example: alert if error responses exceed 100 in 5 minutes.

Once Kibana is installed on a server, you typically use it to visualize and explore data stored in Elasticsearch. Here’s a practical guide with sample usage scenarios:

Access Kibana

After installation, Kibana usually runs on port 5601 by default.

http://<your-server-ip>:5601

  • Open this URL in a browser.
  • You should see the Kibana dashboard.

Connect to Elasticsearch

Kibana automatically connects to your Elasticsearch instance if installed locally.
You can verify the connection:

GET /_cluster/health

  • Go to Dev ToolsConsole in Kibana.
  • Run the above query to check cluster status.

Visualize Data

Kibana allows multiple types of visualizations:

  • Bar/line chart: trends over time.
  • Pie chart: distribution of values.
  • Data table: top IP addresses or most visited URLs.
  • Maps: geolocation of IP addresses.

Create Dashboards

  • Combine multiple visualizations in a Dashboard.
  • Useful for monitoring logs, metrics, or application performance.
  • Example: Create a dashboard with:
     

    • Requests per URL (bar chart)
    • Requests over time (line chart)
    • Top client IPs (data table)
    • Errors by type (pie chart)

 Search & Query Logs

  • Use Discover to search logs interactively.
  • Example KQL query:

status:500 AND url:"/login"

This finds all failed login requests.

Set Alerts (Optional)

  • Kibana’s Alerts and Actions can trigger notifications (email, Slack, etc.) when certain thresholds are crossed.
  • Example: alert if error responses exceed 100 in 5 minutes.

Once Kibana is installed on a server, you typically use it to visualize and explore data stored in Elasticsearch. Here’s a practical guide with sample usage scenarios:

Access Kibana

After installation, Kibana usually runs on port 5601 by default.

http://your-server-ip:5601

  • Open this URL in a browser.
  • You should see the Kibana dashboard.

Connect to Elasticsearch

Kibana automatically connects to your Elasticsearch instance if installed locally.
You can verify the connection:

GET /_cluster/health

  • Go to Dev ToolsConsole in Kibana.
  • Run the above query to check cluster status.

Visualize Data

Kibana allows multiple types of visualizations:

  • Bar/line chart: trends over time.
  • Pie chart: distribution of values.
  • Data table: top IP addresses or most visited URLs.
  • Maps: geolocation of IP addresses.

Create Dashboards

  • Combine multiple visualizations in a Dashboard.
  • Useful for monitoring logs, metrics, or application performance.
  • Example: Create a dashboard with:

    • Requests per URL (bar chart)
    • Requests over time (line chart)
    • Top client IPs (data table)
    • Errors by type (pie chart)

 Search & Query Logs

  • Use Discover to search logs interactively.
  • Example KQL query:

status:500 AND url:"/login"

This finds all failed login requests.

Set Alerts (Optional)

  • Kibana’s Alerts and Actions can trigger notifications (email, Slack, etc.) when certain thresholds are crossed.
  • Example: alert if error responses exceed 100 in 5 minutes.

kibana-sample-dashboard-screenshot

Sample Kibana dashboard
 

kibana-geo-kibana-web-traffic-by-location

Kibana with connected servers to find out Geo Location
 

Summary closing words (what we did)

Step

Action

 1

Install Kibana from Elastic repo

2

Configure to connect to Elasticsearch

3

Start and enable the service

4

Access it via http://<ip>:5601

5

Ingest log data

6

Define index pattern

7

Create dashboards and visualizations

The idea of this article was just to introduce you to the existence of Elasticsearch / kibana and filebeat and logstack and not to give you a fully fine tuned install guide. The usual way to deploy Kibana on multiple servers of course is using a dockerized container version of it. There is plenty to learned on how to use kibana to do a monitoring of your machines. But most simple use is to directly access the locally visible kibana on a server and check the status of processes on the host instead of logging via SSH. Kibana can do pretty much


Some further useful Reading Resources


Deploying a Server and Managing a 10-Node Linux Infrastructure with Ansible

Friday, May 30th, 2025

File:Ansible Logo.png - Wikimedia Commons

As organizations grow, manually configuring and maintaining servers quickly becomes inefficient, error-prone, and unscalable. Ansible, a powerful open-source automation tool, allows sysadmins and DevOps engineers to automate server provisioning, configuration management, and application deployment across multiple nodes—making it ideal for managing a fleet of Linux servers.

In this article, you’ll learn how to deploy a server using Ansible and manage an infrastructure of 10 Linux servers with ease.


What Is Ansible?

Ansible is a suite of software tools that enables infrastructure as code. It is open-source and the suite includes software provisioning, configuration management, and application deployment functionality.Ansible is an agentless IT automation tool. It uses SSH to connect to remote machines and YAML-based playbooks to define automation tasks. With Ansible, you can:

  • Install and configure software packages
  • Enforce configuration consistency
  • Perform updates across nodes
  • Deploy applications
  • Orchestrate complex workflows
     

Pre-requisites

To follow this guide, you need:

  • A control node (the machine from which you run Ansible)
  • 10 Linux servers (can be VMs or physical machines)
  • SSH access from the control node to all servers
  • Python installed on the target machines (most Linux distros have this by default)
     

1. Install Ansible on the Control Node 

On Ubuntu / Debian Linux

# apt update sudo apt install ansible -y

Or for CentOS/RHEL

# yum install epel-release -y
# yum install ansible -y

Verify installation:

# ansible –version

2. Configure Your Inventory File

Ansible uses an inventory file to define which servers to manage. By default, this is located at /etc/ansible/hosts , but you can also create a custom one.

Create an inventory file hosts.ini

[webservers]
server1 ansible_host=192.168.1.101
server2 ansible_host=192.168.1.102
server3 ansible_host=192.168.1.103
[dbservers]
server4 ansible_host=192.168.1.104
[all:vars]
ansible_user=ansible_user
ansible_ssh_private_key_file=~/.ssh/id_rsa

You can also use hostnames if DNS is configured.

3. Test Connectivity

# ansible -i hosts.ini all -m ping

If everything is set up correctly, you should see pong responses from all servers.

4. Write Your First Playbook (Provisioning Example)

Create a file called server_setup.yml:


– name: Provision and configure Linux servers
  hosts: all
  become: yes
  tasks:

    – name: Update apt cache (Debian/Ubuntu)
      apt:
        update_cache: yes
      when: ansible_os_family == "Debian"

    – name: Install common packages
      package:
        name:
          – curl
          – git
          – htop
        state: present

    – name: Ensure Nginx is installed on webservers
      apt:
        name: nginx
        state: present
      when: "'webservers' in group_names"

    – name: Start and enable Nginx
      service:
        name: nginx
        state: started
        enabled: yes
      when: "'webservers' in group_names"
 

5. Run the Playbook

ansible-playbook -i hosts.ini server_setup.yml

Ansible will SSH into each server, execute the tasks, and return status messages.

6. Scaling to 10+ Servers

Managing a growing infrastructure is simple with Ansible:

  • Add new servers to hosts.ini
  • Reuse existing playbooks for setup
  • Use roles to modularize configuration (e.g., webserver, database, monitoring)
  • Schedule playbooks using cron or CI/CD pipelines (e.g., GitHub Actions, Jenkins)

7. Sample Ansible Project Structure

Organizing your Ansible project effectively is crucial for scalability and maintainability. Here's a sample recommended directory layout:

ansible-infra/
├── hosts.ini
├── server_setup.yml
├── roles/
│   ├── common/
│   │   ├── tasks/
│   │   │   └── main.yml
│   │   └── files/
│   └── webserver/
│       ├── tasks/
│       │   └── main.yml
│       └── templates/
└── group_vars/
    └── all.yml
 

Key Components:
 

  • ansible.cfg: Configuration file defining paths and settings.
  • inventories/: Directory containing environment-specific inventory files.
  • playbooks/: Directory for playbooks that define automation tasks.
  • roles/: Directory for reusable roles, each with its own tasks and variables.
  • requirements.yml: File listing external roles or collections.
     

For a detailed explanation of this structure, refer to the Ansible Documentation.

Visual Workflow (text) Diagram

To illustrate the workflow, here's a diagram depicting how Ansible interacts with your infrastructure:

+——————+        +——————+        +——————+
|   Control Node   |        |    Ansible      |        |   Managed Nodes  |
|  (Your Machine)  |        |  (Ansible Core) |        |  (10 Linux Servers)|
+——————+        +——————+        +——————+
        |                               |                                 |
        | SSH                      | Execute Playbooks  | Apply Configurations
        |                               |                                 |
        +————————->+————————->+

Workflow Steps:

  1. Control Node: You initiate commands from your local machine.

  2. Ansible Core: Ansible connects via SSH to each managed node.

  3. Managed Nodes: Ansible applies configurations as defined in your playbooks and roles.

This workflow ensures consistent and automated management of your infrastructure.

Best Practices

  • Use roles: Organize playbooks into reusable roles
     (ansible-galaxy init myrole)
  • Maintain version control: Keep playbooks and inventory in Git
  • Encrypt secrets: Use ansible-vault for secure credentials
  • Test in staging: Always validate changes before pushing to production

Conclusion

Ansible is a game-changer for managing Linux infrastructure. With a few simple playbooks, you can provision, configure, and maintain your servers consistently and securely.
For a 10-node infrastructure, it offers the perfect balance of simplicity and power—letting you scale efficiently without the overhead of agent-based solutions.

How to filter an IP, and IP range or domain to access to access service with /etc/hosts.allow /etc/hosts.deny , filtering Network range to sshd tcp port 22 through sshd service

Tuesday, June 4th, 2024

how-to-allow-and-deny-services-without-firewall-on-linux-logo-picture-tux

If you want to filter a range of IPs to be able to or unable to access a TCP port service because someone is trying to brute force you from the network or just because you don't want a connected LAN IPs to have access to your server for whatever security reasons. The simplest way you can do IP and IP range restrictions to allow or disable access towards a Linux server via defining allow or prohibition rules in  /etc/hosts.allow and /etc/hosts.deny.

This files are there and useful since the beginning of UNIX OS-es and has been widely used on Linux in the past and rarely known by people nowadays.


The hosts.allow and hosts.deny files could be used on a Linux system to deny connection attempts from one or more IP addresses, hostnames, or domains. 
/etc/hosts.allow and /etc/hosts.deny are just a plain text configuration file with a rather simple syntax, that can be used for decades to allow or filter IPs without applying a special firewall rules like iptables locally.
It can work with any TCP wrapped service on your system. The hosts.deny file is used in conjunction with hosts.allow to determine whether a connection attempt gets accepted or denied.

In this small tutorial, you will see an example of the hosts.allow file and how to use it to allow or deny connections to IPs or networks, as well as how a simple prohibition to access SSH service only via specific IP network can be done.

For full understanding of hosts.allow / hosts.deny file, check the manuals man hosts.allow , man hosts.deny, man hosts_options, man hosts_options.

root@pcfreak:~# apropos hosts|grep -iE '^hosts.*'
hosts.equiv (5)      – list of hosts and users that are granted "trusted" r command access to your system
hosts (5)            – static table lookup for hostnames
hosts.allow (5)      – format of host access control files
hosts.deny (5)       – format of host access control files
hosts_access (5)     – format of host access control files
hosts_options (5)    – host access control language extensions

General hosts.allow / hosts.deny syntax

The /etc/hosts.allow and /etc/hosts.deny understood syntax form is: 

service : host/network

Each value is separated by a colon :

You can also supply an option, but this is not as common. We will cover some other niche choices below. More options can be added if necessary, with each one separated by another colon.

service : host/network [:

The following line would allow all traffic to the sshd service. ALL is used as a wildcard.

sshd : ALL

Few examples to allow access to SSH Daemon from IPv4 and IPv6
This line would allow connections from all hosts on the 10.11 network. Connections from all other hosts can then be denied by the hosts.deny file. This type of configuration would work as intended since the allow line precedes our corresponding deny line in the other file, thus will be triggered first.

sshd : 10.11


Accept connections from a particular IPv4 and IPv6 address
 

sshd : 10.10.136.241
sshd : [2a02:2143:88f1:5c00:9991:9daa:b580:aee2]


Rather than using IPs, you can also specify hostnames to accept or deny connections from.

sshd : some.host


Accept connections from all hosts using the main domain .pc-freak.net domain name.

sshd : .pc-freak.net

You can also use a wildcard for both the service and the host/network field. This will accept all connections to any service. This would make all other rules (including those in hosts.deny) irrelevant, as all connections will be accepted by this rule before they have a chance to be denied.

ALL : ALL

The EXCEPT operator can be used to create an exception in an otherwise all allowing rule. 
For example, this rule would allow all connections from the .pc-freak.net domain name, except for one sub-domain org.pc-freak.net

sshd : .pc-freak.net EXCEPT org.pc-freak.net


Allow connectivity towards SSH TCP port 22 for all IP / hosts except for certain IPs and domains
 

To control connectivity towards sshd service via allow hosts  /etc/hosts.allow for all except a bad.host and a certain IP range:


sshd : ALL : allow
sshd : bad.host : deny
sshd : 85.5.1. : deny (1)


Disable access to all remote services to the network

Lets say if you're running the Linux as  desktop station and you want to disable access to any local services running on TCP ports

If you want to be paranoid and disable all remote access to server to any IP network, you can do it with:

# echo "ALL: ALL" >/etc/hosts.deny


Completely allow access to a certain running TCP port service on server
 

To allow completely access to a service
 

service_name : ALL : allow

Allow access for a a range of IPs subnet

You can also specifcy the IP netmask range to allow, like this:

ALL : 192.168.0.0/255.255.254.0


Allow access to all server network services for a domain except for a certain domain
 

Enable access to ALL running server services listening on TCP port except for domain

ALL : .example.com EXCEPT skiddie-attacker.example-domain.com


Allow access to al services except to a service for a local port range via hosts.allow

Here is example onw how to use hosts.allow file to allow connections all running server services except access to VSFTP, coming from Local LAN IPs with netmask /24 (e.g. from the 192.168.0.x.):

ALL EXCEPT vsftpd : 192.168.0


Filtering IPs and IP Ranges from within /usr/sbin/sshd openssh service via /etc/ssh/sshd_config (allow and disable access to concrete IPs trying to brute force you)


Lets say however, you don't want to do the filtering of openssh connections via hosts.allow / hosts.deny but rather on a SSH Service level, this can be done with the following /etc/ssh/sshd_config configuration.

# vim /etc/ssh/sshd_config

Match Address *,!192.168.1.0/24
    ForceCommand /bin/false

For more on the use of Match Address check documentation with man 5 sshd_config


To re-load the opensshd config

# systemctl restart sshd


Of course manually filtering villains is a tedious task and ultimately to save yourself time and inconvenience to regullary look up within /var/log/security or /var/log/messages (depending on the Linux distribution) and the configuration for SSHD to login imposters you would prefer to use fail2ban (if you're not familiar with fail2ban check out my previous article on how to easily Stop ssh bruteforce authentication attempt Attacks with fail2ban or if you want to use the Linux native way check out the article how to prevent SSH and FTP bruteforce attacks with IPtables.

Switching from PasswordSafe to Keepass database, migrating .psafe3 to .kdbx format howto

Thursday, February 23rd, 2023

passwordsafe-to-keepass-migration-logo

I have been using PasswordSafe for many years within my job location as system administrator on the Windows computers I do use as dumb hosts to administrate remotely via ssh servers, develop code in bash / perl or just store different SysAdmin management tools and interfaces passwords. The reason behind was simply that I come out from a Linux background as I've used for daily Sysadmin job for many years GNU / Linux and there I always prefer GNOME (gnome GTK interface) in favour of KDE's (QT Library), and whence I came to work for the "Evil" Windows oriented world of corporations  for the sake of Outlook use and Office 365 as well as Citrix accessibility i've become forced by the circumstances to use Windows. 
Hence for a PasswordManager for Windows back in the years, I preferred the simplicity of interface of PasswordSafe instead of Keepass which always reminded me of the nasty KDE.
PasswordSafe is really cool and a handy program and it works well, but recetnly when I had to store many many passwords and easily navigate through each of it I realized, by observing colleagues, that KeePass as of time of writting this article is much more Powerful and easy to use, as I can see all records of a searched passwords on a Single screen, instead of scrolling like crazy with PasswordSafe through the passowrds.

I didn’t really feel like cutting and pasting every field for all my passwords (plus I started experiencing some PasswordSafe copy / paste passwords issues – maybe not related to PasswordSafe itself so this was the turning point I decided to migrate to Keepass.

For that, started looking at the import export functions for each program. 

After a quick search, I found few articles online explaining on how the migration of PasswordSafe to KeePass can be easily handled as the versions of Keepass and Password safe are moving all the time, of course usually some of the guides to be found online are never competely upto date, so I had to slightly modify one of the articles and come up with this one 🙂 .
 

  •  My PasswordSafe program that keeps my account password records and notes is version is
    V 3.59 built on May 28 2022 and is running on my Windows 10 OS 64 bit release
  • The installed KeePass version to where I have migrated the Pwsafe password database Successfully is 2.48 64 Bit
     
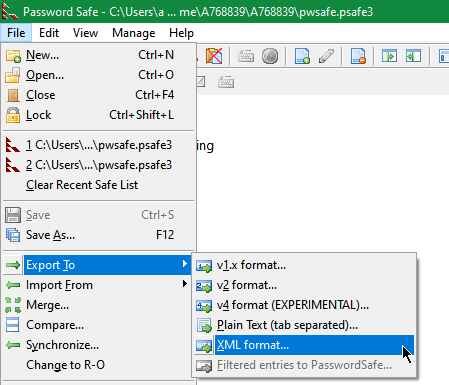
  1. Use the Password Safe function to export to XML file Format
    (File -> Export To -> XML Format )


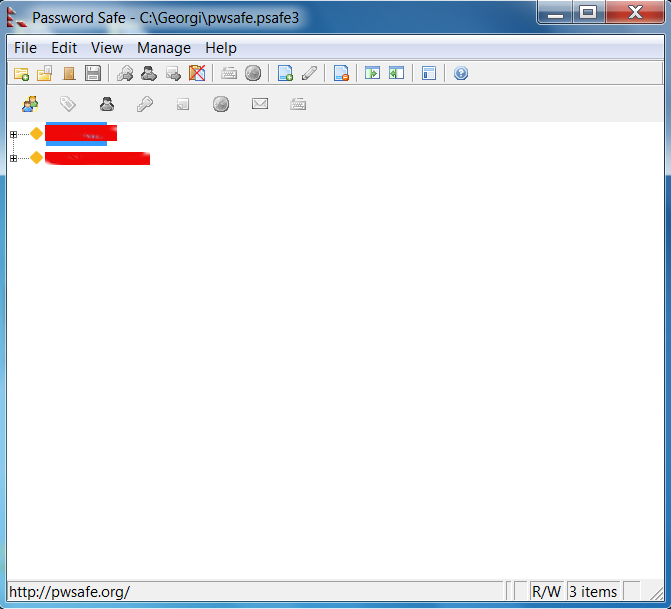
    pwsafe.screenshot-export-password-psafe3
     

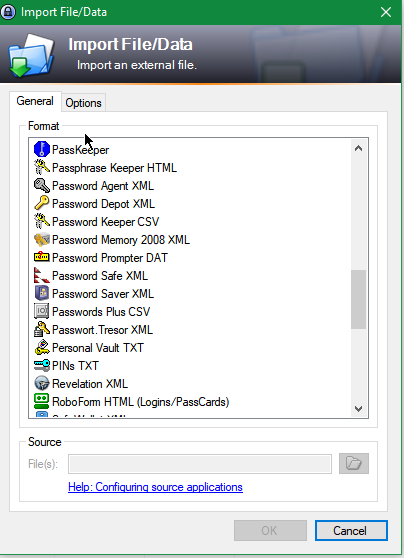
  2. Import the text file into KeePass
    (File->Import From-> Password Safe XML file)


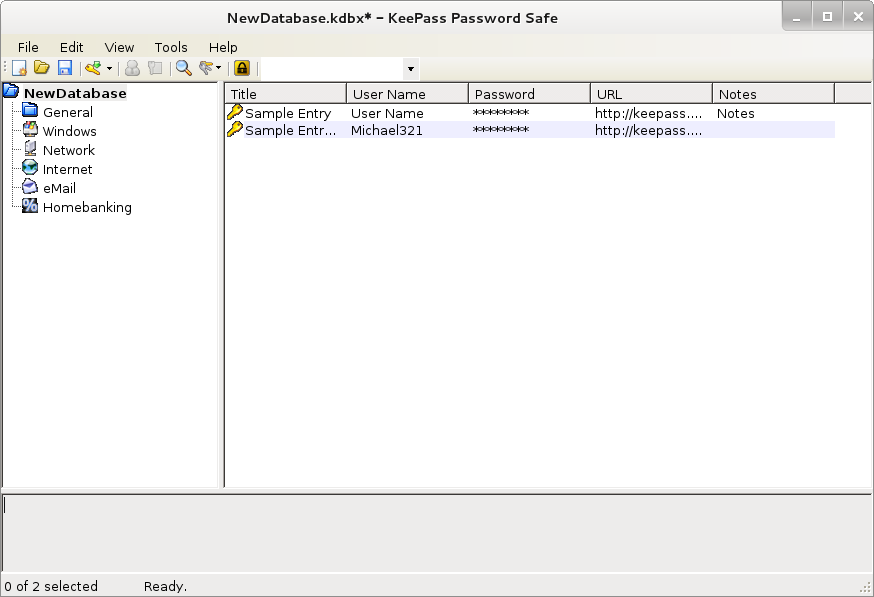
    import-file-data-keepass-screenshot

This process worked quite fine. All of the passwords were imported .
Despite the importing (expected small glitches – please recheck that all was imported fine, before joy), the process is quicker than copy/pasting every field for each entry.

For those of you who are more worried about security than I am, you know this is a very insecure method to transfer passwords. For others, you may wish to export the (unencrypted) text file to a Veracrypt – that is a Truecypt fork (as nowadays obsolete unmaintaned and probably insecury) – a Free Open-Source On-The-Fly Disk Encryption Software to prepare  Veracrypt  partition and / or use Eraser on the text file once you’re finished with it or use another of the free Veracrypt open-source (free software) alternatives such DiskCryptor or even the proprietary Windows BitLocker / CipherShed / Axcrypt or some other encryption alternative software for Windows XP / 2000 / 7 10 that is out there.

NB! Please  don’t do this on a public computer or a PC that you don't administrate.
You never know who might find your passwords or might be sniffing on your OS, as today there are so many devices that perhaps are hacked and listening and collecting password datas  🙂

That's it now I enjoy my KeePass but I'm thankful to PasswordSafe developers, who have easified my password management Virtual life for years 🙂
Any hints on how you migrated PasswordSafe to Keepass are mostly welcome. Also will be nice to hear of hard-core PasswordSafe hints or plugins that can power-up the password storage, maybe I can get convinced back to return back to PasswordSafe 🙂
 

How to start Syslog ( Syslog-ng ) on IBM AIX

Thursday, October 20th, 2022

how-to-enable-syslog-ng-on-ibm-aix-unix-know-AIX-logo.svg

Syslog-ng is a system logging application, which can be a replacement of the default syslog. With syslog-ng, the log messages can be sent in an ecrypted/secure channel to a remote server. If the central log server or the network connection becomes unavailable syslog-ng will store messages on the local hard disk.

The syslog-ng application automatically sends the stored messages to the server when the connection is reestablished, in the same order the messages were received. The disk buffer is persistent – no messages are lost even if syslog-ng is restarted. (Another possibility to send those messages to a secondary server.)

syslog-ng can filter log messages and select only the ones matching certain criteria, but it cannot interpret and analyze the meaning behind the messages. It can receive messages from files, remote hosts, and other sources, and these are sent to one or more destinations (files, remote hosts..),

It has a server – client model, here only syslog-ng client informations will be described (syslog-ng server has not been tested, only client, which were sending messages to a remote server (qradar).)

One missing feature of syslog-ng, that it cannot rotate logs by itself. For log rotation an external tool like logrotate needs to be used.


1. Install / Uninstall syslog-ng on AIX


1.1. Install syslog-ng on AIX
 

After downloading the syslog-ng installer package, we have 2 options
– run ./syslog-ng-<edition>-<version>-<OS>-<platform>.run script, or
– install as an rpm package: rpm -i syslog-ng-premium-edition-<version>-<OS>-<arch>.rpm

During install, the default syslogd will be replaced automatically by syslog-ng (no parallel operation is possible).


1.2. Uninstall syslog-ng on AIX
 

If the .run installer has been used: /opt/syslog-ng/bin/uninstall.sh (The uninstall script will automatically restore the syslog daemon used before installing syslog-ng.)
If the .rpm package has been used: rpm -e syslog-ng-premium-edition (with rpm, it does not restore the syslog daemon used before syslog-ng).


AIX is a custom and non-free OS if you had to deal with it you might might ponder how to stop / start syslog-ng.
The paths to binaries on AIX
The configuration is not universal, but represents the GEK server.

2. Set Automatic start of syslog-ng on AIX

Enable Start from /etc/tcpip:

start /opt/freeware/sbin/syslog-ng "$src_running"


3. Check syslog-ng configuration is correct
 

Configuration could be under separate locations but the most likely ones for  syslog-ng.conf and license.txt files are located in the
/opt/syslog-ng/etc/ directory or /etc/syslog-ng depending on how it was configured on install time.


After changing tuning the configuration, it can be checked for errors:

# /opt/freeware/sbin/syslog-ng –syntax-only

How to configure bond0 bonding and network bridging for KVM Virtual machines on Redhat / CentOS / Fedora Linux

Tuesday, February 16th, 2021

configure-bond0-bonding-channel-with-bridges-on-hypervisor-host-for-guest-KVM-virtual-machines-howto-sample-Hypervisor-Virtual-machines-pic
 1. Intro to Redhat RPM based distro /etc/sysconfig/network-scripts/* config vars shortly explained

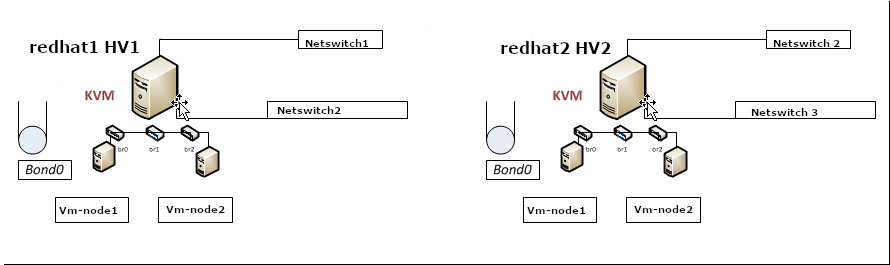
On RPM based Linux distributions configuring network has a very specific structure. As a sysadmin just recently I had a task to configure Networking on 2 Machines to be used as Hypervisors so the servers could communicate normally to other Networks via some different intelligent switches that are connected to each of the interfaces of the server. The idea is the 2 redhat 8.3 machines to be used as  Hypervisor (HV) and each of the 2 HVs to each be hosting 2 Virtual guest Machines with preinstalled another set of Redhat 8.3 Ootpa. I've recently blogged on how to automate a bit installing the KVM Virtual machines with using predefined kickstart.cfg file.

The next step after install was setting up the network. Redhat has a very specific network configuration well known under /etc/sysconfig/network-scripts/ifcfg-eno*# or if you have configured the Redhats to fix the changing LAN card naming ens, eno, em1 to legacy eth0, eth1, eth2 on CentOS Linux – e.g. to be named as /etc/sysconfig/network-scripts/{ifcfg-eth0,1,2,3}.

The first step to configure the network from that point is to come up with some network infrastrcture that will be ready on the HV nodes server-node1 server-node2 for the Virtual Machines to be used by server-vm1, server-vm2.

Thus for the sake of myself and some others I decide to give here the most important recognized variables that can be placed inside each of the ifcfg-eth0,ifcfg-eth1,ifcfg-eth2 …

A standard ifcfg-eth0 confing would look something this:
 

[root@redhat1 :~ ]# cat /etc/sysconfig/network-scripts/ifcfg-eth0
TYPE=Ethernet
BOOTPROTO=none
DEFROUTE=yes
IPV4_FAILURE_FATAL=no
IPV6INIT=yes
IPV6_AUTOCONF=yes
IPV6_DEFROUTE=yes
IPV4_FAILURE_FATAL=no
NAME=eth0
UUID=…
ONBOOT=yes
HWADDR=0e:a4:1a:b6:fc:86
IPADDR0=10.31.24.10
PREFIX0=23
GATEWAY0=10.31.24.1
DNS1=192.168.50.3
DNS2=10.215.105.3
DOMAIN=example.com
IPV6_PEERDNS=yes
IPV6_PEERROUTES=yes


Lets say few words to each of the variables to make it more clear to people who never configured Newtork on redhat without the help of some of the console ncurses graphical like tools such as nmtui or want to completely stop the Network-Manager to manage the network and thus cannot take the advantage of using nmcli (a command-line tool for controlling NetworkManager).

Here is a short description of each of above configuration parameters:

TYPE=device_type: The type of network interface device
BOOTPROTO=protocol: Where protocol is one of the following:

  • none: No boot-time protocol is used.
  • bootp: Use BOOTP (bootstrap protocol).
  • dhcp: Use DHCP (Dynamic Host Configuration Protocol).
  • static: if configuring static IP

EFROUTE|IPV6_DEFROUTE=answer

  • yes: This interface is set as the default route for IPv4|IPv6 traffic.
  • no: This interface is not set as the default route.

Usually most people still don't use IPV6 so better to disable that

IPV6INIT=answer: Where answer is one of the following:

  • yes: Enable IPv6 on this interface. If IPV6INIT=yes, the following parameters could also be set in this file:

IPV6ADDR=IPv6 address

IPV6_DEFAULTGW=The default route through the specified gateway

  • no: Disable IPv6 on this interface.

IPV4_FAILURE_FATAL|IPV6_FAILURE_FATAL=answer: Where answer is one of the following:

  • yes: This interface is disabled if IPv4 or IPv6 configuration fails.
  • no: This interface is not disabled if configuration fails.

ONBOOT=answer: Where answer is one of the following:

  • yes: This interface is activated at boot time.
  • no: This interface is not activated at boot time.

HWADDR=MAC-address: The hardware address of the Ethernet device
IPADDRN=address: The IPv4 address assigned to the interface
PREFIXN=N: Length of the IPv4 netmask value
GATEWAYN=address: The IPv4 gateway address assigned to the interface. Because an interface can be associated with several combinations of IP address, network mask prefix length, and gateway address, these are numbered starting from 0.
DNSN=address: The address of the Domain Name Servers (DNS)
DOMAIN=DNS_search_domain: The DNS search domain (this is the search Domain-name.com you usually find in /etc/resolv.conf)

Other interesting file that affects how routing is handled on a Redhat Linux is

/etc/sysconfig/network

[root@redhat1 :~ ]# cat /etc/sysconfig/network
# Created by anaconda
GATEWAY=10.215.105.

Having this gateway defined does add a default gateway

This file specifies global network settings. For example, you can specify the default gateway, if you want to apply some network settings such as routings, Alias IPs etc, that will be valid for all configured and active configuration red by systemctl start network scripts or the (the network-manager if such is used), just place it in that file.

Other files of intesresting to control how resolving is being handled on the server worthy to check are 

/etc/nsswitch.conf

and

/etc/hosts

If you want to set a preference of /etc/hosts being red before /etc/resolv.conf and DNS resolving for example you need to have inside it, below is default behavior of it.
 

root@redhat1 :~ ]#   grep -i hosts /etc/nsswitch.conf
#     hosts: files dns
#     hosts: files dns  # from user file
# Valid databases are: aliases, ethers, group, gshadow, hosts,
hosts:      files dns myhostname

As you can see the default order is to read first files (meaning /etc/hosts) and then the dns (/etc/resolv.conf)
hosts: files dns

Now with this short intro description on basic values accepted by Redhat's /etc/sysconfig/network-scripts/ifcfg* prepared configurations.


I will give a practical example of configuring a bond0 interface with 2 members which were prepared based on Redhat's Official documentation found in above URLs:

https://access.redhat.com/documentation/en-us/red_hat_enterprise_linux/8/html/configuring_and_managing_networking/configuring-network-bonding_configuring-and-managing-networking
 

# Bonding on RHEL 7 documentation
https://access.redhat.com/documentation/en-us/red_hat_enterprise_linux/7/html/networking_guide/sec-network_bonding_using_the_command_line_interface

https://access.redhat.com/documentation/en-us/red_hat_enterprise_linux/7/html/networking_guide/sec-verifying_network_configuration_bonding_for_redundancy

https://access.redhat.com/documentation/en-us/red_hat_enterprise_linux/6/html/deployment_guide/s2-networkscripts-interfaces_network-bridge

# Network Bridge with Bond documentation
https://access.redhat.com/documentation/en-us/red_hat_enterprise_linux/6/html/deployment_guide/sec-Configuring_a_VLAN_over_a_Bond

https://docs.fedoraproject.org/en-US/Fedora/24/html/Networking_Guide/sec-Network_Bridge_with_Bond.html


2. Configuring a single bond connection on eth0 / eth2 and setting 3 bridge interfaces bond -> br0, br1 -> eth1, br2 -> eth2

The task on my machines was to set up from 4 lan cards one bonded interface as active-backup type of bond with bonded lines on eth0, eth2 and 3 other 2 eth1, eth2 which will be used for private communication network that is connected via a special dedicated Switches and Separate VLAN 50, 51 over a tagged dedicated gigabit ports.

As said the 2 Servers had each 4 Broadcom Network CARD interfaces each 2 of which are paired (into a single card) and 2 of which are a solid Broadcom NetXtreme Dual Port 10GbE SFP+ and Dell Broadcom 5720 Dual Port 1Gigabit Network​.

2-ports-broadcom-netxtreme-dual-port-10GBe-spf-plus

On each of server-node1 and server-node2 we had 4 Ethernet Adapters properly detected on the Redhat

root@redhat1 :~ ]# lspci |grep -i net
01:00.0 Ethernet controller: Broadcom Inc. and subsidiaries NetXtreme BCM5720 2-port Gigabit Ethernet PCIe
01:00.1 Ethernet controller: Broadcom Inc. and subsidiaries NetXtreme BCM5720 2-port Gigabit Ethernet PCIe
19:00.0 Ethernet controller: Broadcom Inc. and subsidiaries BCM57412 NetXtreme-E 10Gb RDMA Ethernet Controller (rev 01)
19:00.1 Ethernet controller: Broadcom Inc. and subsidiaries BCM57412 NetXtreme-E 10Gb RDMA Ethernet Controller (rev 01)


I've already configured as prerogative net.ifnames=0 to /etc/grub2/boot.cfg and Network-Manager service disabled on the host (hence to not use Network Manager you'll see in below configuration NM_CONTROLLED="no" is telling the Redhat servers is not to be trying NetworkManager for more on that check my previous article Disable NetworkManager automatic Ethernet Interface Management on Redhat Linux , CentOS 6 / 7 / 8.

3. Types of Network Bonding

mode=0 (balance-rr)

This mode is based on Round-robin policy and it is the default mode. This mode offers fault tolerance and load balancing features. It transmits the packets in Round robin fashion that is from the first available slave through the last.

mode-1 (active-backup)

This mode is based on Active-backup policy. Only one slave is active in this band, and another one will act only when the other fails. The MAC address of this bond is available only on the network adapter part to avoid confusing the switch. This mode also provides fault tolerance.

mode=2 (balance-xor)

This mode sets an XOR (exclusive or) mode that is the source MAC address is XOR’d with destination MAC address for providing load balancing and fault tolerance. Each destination MAC address the same slave is selected.

mode=3 (broadcast)

This method is based on broadcast policy that is it transmitted everything on all slave interfaces. It provides fault tolerance. This can be used only for specific purposes.

mode=4 (802.3ad)

This mode is known as a Dynamic Link Aggregation mode that has it created aggregation groups having same speed. It requires a switch that supports IEEE 802.3ad dynamic link. The slave selection for outgoing traffic is done based on a transmit hashing method. This may be changed from the XOR method via the xmit_hash_policy option.

mode=5 (balance-tlb)

This mode is called Adaptive transmit load balancing. The outgoing traffic is distributed based on the current load on each slave and the incoming traffic is received by the current slave. If the incoming traffic fails, the failed receiving slave is replaced by the MAC address of another slave. This mode does not require any special switch support.

mode=6 (balance-alb)

This mode is called adaptive load balancing. This mode does not require any special switch support.

Lets create the necessery configuration for the bond and bridges

[root@redhat1 :~ ]# cat ifcfg-bond0
DEVICE=bond0
NAME=bond0
TYPE=Bond
BONDING_MASTER=yes
#IPADDR=10.50.21.16
#PREFIX=26
#GATEWAY=10.50.0.1
#DNS1=172.20.88.2
ONBOOT=yes
BOOTPROTO=none
BONDING_OPTS="mode=1 miimon=100 primary=eth0"
NM_CONTROLLED="no"
BRIDGE=br0


[root@redhat1 :~ ]# cat ifcfg-bond0.10
DEVICE=bond0.10
BOOTPROTO=none
ONPARENT=yes
#IPADDR=10.50.21.17
#NETMASK=255.255.255.0
VLAN=yes

[root@redhat1 :~ ]# cat ifcfg-br0
STP=yes
BRIDGING_OPTS=priority=32768
TYPE=Bridge
PROXY_METHOD=none
BROWSER_ONLY=no
BOOTPROTO=none
DEFROUTE=yes
IPV4_FAILURE_FATAL=no
#IPV6INIT=yes
#IPV6_AUTOCONF=yes
#IPV6_DEFROUTE=yes
#IPV6_FAILURE_FATAL=no
#IPV6_ADDR_GEN_MODE=stable-privacy
IPV6_AUTOCONF=no
IPV6_DEFROUTE=no
IPV6_FAILURE_FATAL=no
IPV6_ADDR_GEN_MODE=stable-privacy
NAME=br0
UUID=4451286d-e40c-4d8c-915f-7fc12a16d595
DEVICE=br0
ONBOOT=yes
IPADDR=10.50.50.16
PREFIX=26
GATEWAY=10.50.0.1
DNS1=172.20.0.2
NM_CONTROLLED=no

[root@redhat1 :~ ]# cat ifcfg-br1
STP=yes
BRIDGING_OPTS=priority=32768
TYPE=Bridge
PROXY_METHOD=none
BROWSER_ONLY=no
BOOTPROTO=none
DEFROUTE=no
IPV4_FAILURE_FATAL=no
#IPV6INIT=yes
#IPV6_AUTOCONF=yes
#IPV6_DEFROUTE=yes
#IPV6_FAILURE_FATAL=no
#IPV6_ADDR_GEN_MODE=stable-privacy
IPV6INIT=no
IPV6_AUTOCONF=no
IPV6_DEFROUTE=no
IPV6_FAILURE_FATAL=no
IPV6_ADDR_GEN_MODE=stable-privacy
NAME=br1
UUID=40360c3c-47f5-44ac-bbeb-77f203390d29
DEVICE=br1
ONBOOT=yes
##IPADDR=10.50.51.241
PREFIX=28
##GATEWAY=10.50.0.1
##DNS1=172.20.0.2
NM_CONTROLLED=no

[root@redhat1 :~ ]# cat ifcfg-br2
STP=yes
BRIDGING_OPTS=priority=32768
TYPE=Bridge
PROXY_METHOD=none
BROWSER_ONLY=no
BOOTPROTO=none
DEFROUTE=no
IPV4_FAILURE_FATAL=no
#IPV6INIT=yes
#IPV6_AUTOCONF=yes
#IPV6_DEFROUTE=yes
#IPV6_FAILURE_FATAL=no
#IPV6_ADDR_GEN_MODE=stable-privacy
IPV6INIT=no
IPV6_AUTOCONF=no
IPV6_DEFROUTE=no
IPV6_FAILURE_FATAL=no
IPV6_ADDR_GEN_MODE=stable-privacy
NAME=br2
UUID=fbd5c257-2f66-4f2b-9372-881b783276e0
DEVICE=br2
ONBOOT=yes
##IPADDR=10.50.51.243
PREFIX=28
##GATEWAY=10.50.0.1
##DNS1=172.20.10.1
NM_CONTROLLED=no
NM_CONTROLLED=no
BRIDGE=br0

[root@redhat1 :~ ]# cat ifcfg-eth0
TYPE=Ethernet
NAME=bond0-slaveeth0
BOOTPROTO=none
#UUID=61065574-2a9d-4f16-b16e-00f495e2ee2b
DEVICE=eth0
ONBOOT=yes
MASTER=bond0
SLAVE=yes
NM_CONTROLLED=no

[root@redhat1 :~ ]# cat ifcfg-eth1
TYPE=Ethernet
NAME=eth1
UUID=b4c359ae-7a13-436b-a904-beafb4edee94
DEVICE=eth1
ONBOOT=yes
BRIDGE=br1
NM_CONTROLLED=no

[root@redhat1 :~ ]#  cat ifcfg-eth2
TYPE=Ethernet
NAME=bond0-slaveeth2
BOOTPROTO=none
#UUID=821d711d-47b9-490a-afe7-190811578ef7
DEVICE=eth2
ONBOOT=yes
MASTER=bond0
SLAVE=yes
NM_CONTROLLED=no

[root@redhat1 :~ ]#  cat ifcfg-eth3
TYPE=Ethernet
PROXY_METHOD=none
BROWSER_ONLY=no
#BOOTPROTO=dhcp
BOOTPROTO=none
DEFROUTE=no
IPV4_FAILURE_FATAL=no
#IPV6INIT=yes
#IPV6_AUTOCONF=yes
#IPV6_DEFROUTE=yes
#IPV6_FAILURE_FATAL=no
#IPV6_ADDR_GEN_MODE=stable-privacy
IPV6INIT=no
IPV6_AUTOCONF=no
IPV6_DEFROUTE=no
IPV6_FAILURE_FATAL=no
IPV6_ADDR_GEN_MODE=stable-privacy
BRIDGE=br2
NAME=eth3
UUID=61065574-2a9d-4f16-b16e-00f495e2ee2b
DEVICE=eth3
ONBOOT=yes
NM_CONTROLLED=no

[root@redhat2 :~ ]# cat ifcfg-bond0
DEVICE=bond0
NAME=bond0
TYPE=Bond
BONDING_MASTER=yes
#IPADDR=10.50.21.16
#PREFIX=26
#GATEWAY=10.50.21.1
#DNS1=172.20.88.2
ONBOOT=yes
BOOTPROTO=none
BONDING_OPTS="mode=1 miimon=100 primary=eth0"
NM_CONTROLLED="no"
BRIDGE=br0

# cat ifcfg-bond0.10
DEVICE=bond0.10
BOOTPROTO=none
ONPARENT=yes
#IPADDR=10.50.21.17
#NETMASK=255.255.255.0
VLAN=yes
NM_CONTROLLED=no
BRIDGE=br0

[root@redhat2 :~ ]# cat ifcfg-br0
STP=yes
BRIDGING_OPTS=priority=32768
TYPE=Bridge
PROXY_METHOD=none
BROWSER_ONLY=no
BOOTPROTO=none
DEFROUTE=yes
IPV4_FAILURE_FATAL=no
#IPV6INIT=yes
#IPV6_AUTOCONF=yes
#IPV6_DEFROUTE=yes
#IPV6_FAILURE_FATAL=no
#IPV6_ADDR_GEN_MODE=stable-privacy
IPV6_AUTOCONF=no
IPV6_DEFROUTE=no
IPV6_FAILURE_FATAL=no
IPV6_ADDR_GEN_MODE=stable-privacy
NAME=br0
#UUID=f87e55a8-0fb4-4197-8ccc-0d8a671f30d0
UUID=4451286d-e40c-4d8c-915f-7fc12a16d595
DEVICE=br0
ONBOOT=yes
IPADDR=10.50.21.17
PREFIX=26
GATEWAY=10.50.21.1
DNS1=172.20.88.2
NM_CONTROLLED=no

[root@redhat2 :~ ]#  cat ifcfg-br1
STP=yes
BRIDGING_OPTS=priority=32768
TYPE=Bridge
PROXY_METHOD=none
BROWSER_ONLY=no
BOOTPROTO=none
DEFROUTE=no
IPV4_FAILURE_FATAL=no
#IPV6INIT=no
#IPV6_AUTOCONF=no
#IPV6_DEFROUTE=no
#IPV6_FAILURE_FATAL=no
#IPV6_ADDR_GEN_MODE=stable-privacy
IPV6INIT=no
IPV6_AUTOCONF=no
IPV6_DEFROUTE=no
IPV6_FAILURE_FATAL=no
IPV6_ADDR_GEN_MODE=stable-privacy
NAME=br1
UUID=40360c3c-47f5-44ac-bbeb-77f203390d29
DEVICE=br1
ONBOOT=yes
##IPADDR=10.50.21.242
PREFIX=28
##GATEWAY=10.50.21.1
##DNS1=172.20.88.2
NM_CONTROLLED=no

[root@redhat2 :~ ]# cat ifcfg-br2
STP=yes
BRIDGING_OPTS=priority=32768
TYPE=Bridge
PROXY_METHOD=none
BROWSER_ONLY=no
BOOTPROTO=none
DEFROUTE=no
IPV4_FAILURE_FATAL=no
#IPV6INIT=no
#IPV6_AUTOCONF=no
#IPV6_DEFROUTE=no
#IPV6_FAILURE_FATAL=no
#IPV6_ADDR_GEN_MODE=stable-privacy
IPV6INIT=no
IPV6_AUTOCONF=no
IPV6_DEFROUTE=no
IPV6_FAILURE_FATAL=no
IPV6_ADDR_GEN_MODE=stable-privacy
NAME=br2
UUID=fbd5c257-2f66-4f2b-9372-881b783276e0
DEVICE=br2
ONBOOT=yes
##IPADDR=10.50.21.244
PREFIX=28
##GATEWAY=10.50.21.1
##DNS1=172.20.88.2
NM_CONTROLLED=no

[root@redhat2 :~ ]# cat ifcfg-eth0
TYPE=Ethernet
NAME=bond0-slaveeth0
BOOTPROTO=none
#UUID=ee950c07-7eb2-463b-be6e-f97e7ad9d476
DEVICE=eth0
ONBOOT=yes
MASTER=bond0
SLAVE=yes
NM_CONTROLLED=no

[root@redhat2 :~ ]# cat ifcfg-eth1
TYPE=Ethernet
NAME=eth1
UUID=ffec8039-58f0-494a-b335-7a423207c7e6
DEVICE=eth1
ONBOOT=yes
BRIDGE=br1
NM_CONTROLLED=no

[root@redhat2 :~ ]# cat ifcfg-eth2
TYPE=Ethernet
NAME=bond0-slaveeth2
BOOTPROTO=none
#UUID=2c097475-4bef-47c3-b241-f5e7f02b3395
DEVICE=eth2
ONBOOT=yes
MASTER=bond0
SLAVE=yes
NM_CONTROLLED=no


Notice that the bond0 configuration does not have an IP assigned this is done on purpose as we're using the interface channel bonding together with attached bridge for the VM. Usual bonding on a normal physical hardware hosts where no virtualization use is planned is perhaps a better choice. If you however try to set up an IP address in that specific configuration shown here and you try to reboot the machine, you will end up with inacessible machine over the network like I did and you will need to resolve configuration via some kind of ILO / IDRAC interface.

4. Generating UUID for ethernet devices bridges and bonds

One thing to note is the command uuidgen you might need that to generate UID identificators to fit in the new network config files.

Example:
 

[root@redhat2 :~ ]#uuidgen br2
e7995e15-7f23-4ea2-80d6-411add78d703
[root@redhat2 :~ ]# uuidgen br1
05e0c339-5998-414b-b720-7adf91a90103
[root@redhat2 :~ ]# uuidgen br0
e6d7ff74-4c15-4d93-a150-ff01b7ced5fb


5. How to make KVM Virtual Machines see configured Network bridges (modify VM XML)

To make the Virtual machines installed see the bridges I had to

[root@redhat1 :~ ]#virsh edit VM_name1
[root@redhat1 :~ ]#virsh edit VM_name2

[root@redhat2 :~ ]#virsh edit VM_name1
[root@redhat2 :~ ]#virsh edit VM_name2

Find the interface network configuration and change it to something like:

    <interface type='bridge'>
      <mac address='22:53:00:56:5d:ac'/>
      <source bridge='br0'/>
      <model type='virtio'/>
      <address type='pci' domain='0x0000' bus='0x01' slot='0x00' function='0x0'/>
    </interface>
    <interface type='bridge'>
      <mac address='22:53:00:2a:5f:01'/>
      <source bridge='br1'/>
      <model type='virtio'/>
      <address type='pci' domain='0x0000' bus='0x07' slot='0x00' function='0x0'/>
    </interface>
    <interface type='bridge'>
      <mac address='22:34:00:4a:1b:6c'/>
      <source bridge='br2'/>
      <model type='virtio'/>
      <address type='pci' domain='0x0000' bus='0x08' slot='0x00' function='0x0'/>
    </interface>


6. Testing the bond  is up and works fine

# ip addr show bond0
The result is the following:


4: bond0: <BROADCAST,MULTICAST,MASTER,UP,LOWER_UP> mtu 1500 qdisc noqueue state UP group default qlen 1000
    link/ether 52:54:00:cb:25:82 brd ff:ff:ff:ff:ff:ff


The bond should be visible in the normal network interfaces with ip address show or /sbin/ifconfig


# cat /proc/net/bonding/bond0
Ethernet Channel Bonding Driver: v3.7.1 (April 27, 2011)

Bonding Mode: fault-tolerance (active-backup)
Primary Slave: None
Currently Active Slave: eth0
MII Status: up
MII Polling Interval (ms): 100
Up Delay (ms): 0
Down Delay (ms): 0

Slave Interface: eth2
MII Status: up
Speed: 10000 Mbps
Duplex: full
Link Failure Count: 0
Permanent HW addr: 00:0c:29:ab:2a:fa
Slave queue ID: 0


According to the output eth0 is the active slave.

The active slaves device files (eth0 in this case) is found in virtual file system /sys/

# find /sys -name *eth0
/sys/devices/pci0000:00/0000:00:15.0/0000:03:00.0/net/eth0
/sys/devices/virtual/net/bond0/lower_eth0
/sys/class/net/eth0


You can remove a bond member say eth0 by 


 cd to the pci* directory
Example: /sys/devices/pci000:00/000:00:15.0


# echo 1 > remove


At this point the eth0 device directory structure that was previously located under /sys/devices/pci000:00/000:00:15.0 is no longer there.  It was removed and the device no longer exists as seen by the OS.

You can verify this is the case with a simple ifconfig which will no longer list the eth0 device.
You can also repeat the cat /proc/net/bonding/bond0 command from Step 1 to see that eth0 is no longer listed as active or available.
You can also see the change in the messages file.  It might look something like this:

2021-02-12T14:13:23.363414-06:00 redhat1  device eth0: device has been deleted
2021-02-12T14:13:23.368745-06:00 redhat1 kernel: [81594.846099] bonding: bond0: releasing active interface eth0
2021-02-12T14:13:23.368763-06:00 redhat1 kernel: [81594.846105] bonding: bond0: Warning: the permanent HWaddr of eth0 – 00:0c:29:ab:2a:f0 – is still in use by bond0. Set the HWaddr of eth0 to a different address to avoid conflicts.
2021-02-12T14:13:23.368765-06:00 redhat1 kernel: [81594.846132] bonding: bond0: making interface eth1 the new active one.


Another way to test the bonding is correctly switching between LAN cards on case of ethernet hardware failure is to bring down one of the 2 or more bonded interfaces, lets say you want to switch from active-backup from eth1 to eth2, do:
 

# ip link set dev eth0 down


That concludes the test for fail over on active slave failure.

7. Bringing bond updown (rescan) bond with no need for server reboot

You know bonding is a tedious stuff that sometimes breaks up badly so only way to fix the broken bond seems to be a init 6 (reboot) cmd but no actually that is not so.

You can also get the deleted device back with a simple pci rescan command:

# echo 1 > /sys/bus/pci/rescan


The eth0 interface should now be back
You can see that it is back with an ifconfig command, and you can verify that the bond sees it with this command:

# cat /proc/net/bonding/bond0


That concludes the test of the bond code seeing the device when it comes back again.

The same steps can be repeated only this time using the eth1 device and file structure to fail the active slave in the bond back over to eth0.

8. Testing the bond with ifenslave command (ifenslave command examples)

Below is a set of useful information to test the bonding works as expected with ifenslave command  comes from "iputils-20071127" package

– To show information of all the inerfaces

                  # ifenslave -a
                  # ifenslave –all-interfaces 


– To change the active slave

                  # ifenslave -c bond0 eth1
                  # ifenslave –change-active bond0 eth1 


– To remove the slave interface from the bonding device

                  # ifenslave -d eth1
                  # ifenslave –detach bond0 eth1 


– To show master interface info

                  # ifenslave bond0 


– To set the bond device down and automatically release all the slaves

                  # ifenslave bond1 down 

– To get the usage info

                  # ifenslave -u
                  # ifenslave –usage 

– To set to verbose mode

                  # ifenslave -v
                  # ifenslave –verbose 

9. Testing the bridge works fine

Historically over the years all kind of bridges are being handled with the brctl part of bridge-utils .deb / .rpm installable package.

The classical way to check a bridge is working is to do

# brctl show
# brctl show br0; brctl show br1; brctl show br2

# brctl showmacs br0
 

etc.

Unfortunately with redhat 8 this command is no longer available so to get information about configured bridges you need to use instead:


# bridge link show
3:eth0: <BROADCAST,MULTICAST,UP,LOWER_UP> mtu 1500 master bridge0 state forwarding priority 32 cost 100
4:eth2: <BROADCAST,MULTICAST,UP,LOWER_UP> mtu 1500 master bridge0 state listening priority 32 cost 100


10. Troubleshooting network connectivity issues on bond bridges and LAN cards

Testing the bond connection and bridges can route proper traffic sometimes is a real hassle so here comes at help the good old tcpdump

If you end up with issues with some of the ethernet interfaces between HV1 and HV2 to be unable to talk to each other and you have some suspiciousness that some colleague from the network team has messed up a copper (UTP) cable or there is a connectivity fiber optics issues. To check the VLAN tagged traffic headers on the switch you can listen to each and every bond0 and br0, br1, br2 eth0, eth1, eth2, eth3 configured on the server like so:

# tcpdump -i bond0 -nn -e vlan


Some further investigation on where does a normal ICMP traffic flows once everything is setup is a normal thing to do, hence just try to route a normal ping via the different server interfaces:

# ping -I bond0 DSTADDR

# ping -i eth0 DSTADDR

# ping -i eth1 DSTADDR

# ping -i eth2 DSTADDR


After conducting the ping do the normal for network testing big ICMP packages (64k) ping to make sure there are no packet losses etc., e.g:

# ping -I eth3 -s 64536  DSTADDR


If for 10 – 20 seconds the ping does not return package losses then you should be good.

Howto Upgrade IBM Spectrum Protect Backup Client TSM 7.X to 8.1.8, Update Tivoli 8.1.8 to 8.1.11 on CentOS and Redhat Linux

Thursday, December 3rd, 2020


IBM-spectrum-protect-backup-logo-tivoli-tsm-logo

Having another day of a system administrator boredom, we had a task to upgrade some Tivoli TSM Backup clients running on a 20+ machines powered by CentOS and RHEL Linux to prepare the systems to be on the latest patched IBM Spectrum Backup client version available from IBM. For the task of patching I've used a central server where, I've initially downloaded the provided TSM client binaries archives. From this machine, we have copied TivSM*.tar to each and every system that needs to be patched and then patched. The task is not too complex as the running TSM in the machines are all at the same version and all running a recent patched version of Linux. Hence to make sure all works as expected we have tested TSM is upgraded from 7.X.X to 8.X.X on one machine and then test 8.1.8 to 8.1.11 upgrade on another one. Once having confirmed that Backups works as expected after upgrade. We have proceeded to do it massively on each of the rest 20+ hosts.
Below article's goal is to help some lazy sysadmin with the task to prepare an TSM Backup upgrade procedure to standartize TSM Upgrade, which as many of the IBM's softwares is very specific and its upgrade requires, a bit of manual work and extra cautious as there seems to be no easy way (or at least I don't know it), to do the upgrade by simply adding an RPM repository and doing, something like yum install tivsm*.


0. Check if there is at least 2G free of space

According to documentation the minimum space you need to a functional install without having it half installed or filling up your filesystem is 2 Gigabytes of Free Memory on a filesystem where the .tar and rpms will be living.

Thus check what is the situation with your filesystem where you wills store the .tar archice and extract .RPM files / install the RPM files.

# df -h

1. Download the correct tarball with 8.1 Client

On one central machine you would need to download the Tivoli you can do that via wget / curl / lynx whatever is at hand on the Linux server.

As of time of writting this article TSM's 8.1.11 location is at
URL:

http://public.dhe.ibm.com/storage/tivoli-storage-management/maintenance/client/v8r1/Linux/LinuxX86/BA/v8111/

I've made a local download mirror of Tivoli TSM 8.1.11 here.
In case you need to install IBM Spectrum Backup Client to a PCI secured environment to a DMZ-ed LAN network from a work PC you can Download it first from your local PC and via Citrix client upload program or WinSCP upload it to a central replication host from where you will later copy to each of the other server nodes that needs to be upgraded.

Lets Copy archive to all Server hosts where you want it later installed, using a small hack

Assuming you already have an Excel document or a Plain text document with all the IPs of the affected hosts where you will need to get TSM upgraded. Extract this data and from it create a plain text file /home/user/hosts.txt containing all the machine IPs lined up separated with carriage return separations (\n), so you can loop over each one and use scp to send the files.

– Replicate Tivoli tar to all machine hosts where you want to get IBM Spectrum installed or upgraded.
Do it with a loop like this:

# for i in $(cat hosts.txt); do scp 8.1.11.0-TIV-TSMBAC-LinuxX86.tar user@$i:/home/user/; done

 Copy to a Copy buffer temporary your server password assuming all your passwords to each machine are identical and paste your login user pass for each host to initiate transfer
 

2. SSH to each of the Machine hosts IPs

Once you login to the host you want to upgrade
Go to your user $HOME /home/user and create files where we'll temporary store Tivoli archive files and extract RPMs

[root@linux-server user]# mkdir -p ~/tsm/TSM_BCK/
[root@linux-server user]# mv 8.1.11.0-TIV-TSMBAC-LinuxX86.tar ~/tsm
[root@linux-server user]# cd tsm
[root@linux-server user]# tar -xvvf 8.1.11.0-TIV-TSMBAC-LinuxX86.tar
gskcrypt64-8.0.55.17.linux.x86_64.rpm
GSKit.pub.pgp
gskssl64-8.0.55.17.linux.x86_64.rpm
README_api.htm
README.htm
RPM-GPG-KEY-ibmpkg
TIVsm-API64.x86_64.rpm
TIVsm-APIcit.x86_64.rpm
TIVsm-BAcit.x86_64.rpm
TIVsm-BAhdw.x86_64.rpm
TIVsm-BA.x86_64.rpm
TIVsm-filepath-source.tar.gz
TIVsm-JBB.x86_64.rpm
TIVsm-WEBGUI.x86_64.rpm
update.txt

3. Create backup of old backup files

It is always a good idea to keep old backup files

[root@linux-server tsm]# cp -av /opt/tivoli/tsm/client/ba/bin/dsm.opt ~/tsm/TSM_BCK/dsm.opt_bak_$(date +'%Y_%M_%H')
[root@linux-server tsm]# cp -av /opt/tivoli/tsm/client/ba/bin/dsm.sys ~/tsm/TSM_BCK/dsm.sys_bak_$(date +'%Y_%M_%H')

[root@linux-server tsm]# [[ -f /etc/adsm/TSM.PWD ]] && cp -av /etc/adsm/TSM.PWD ~/TSM_BCK/ || echo 'file doesnt exist'

/etc/adsm/TSM.PWD this file is only there as legacy for TSM it contained encrypted passwords inver 7 for updates. In TSM v.8 encryption file is not there as new mechanism for sensitive data was introduced.
Be aware that from Tivoli 8.X it will return error
exist'

!! Note – if dsm.opt , dsm.sys files are on different locations – please use correct full path locations !!

4. Stop  dsmcad – TSM Service daemon

[root@linux-server tsm]# systemctl stop dsmcad

5. Locate and deinstall all old Clients

Depending on the version to upgrade if you're upgrading from TSM version 7 to 8, you will get output like.

[root@linux-server tsm]# rpm -qa | grep 'TIVsm-'
TIVsm-BA-7.1.6-2.x86_64
TIVsm-API64-7.1.6-2.x86_64

If you're one of this paranoid admins you can remove TIVsm packs  one by one.

[root@linux-server tsm]# rpm -e TIVsm-BA-7.1.6-2.x86_64
[root@linux-server tsm]# rpm -e TIVsm-API64-7.1.6-2.x86_64

Instead if upgrading from version 8.1.8 to 8.1.11 due to the Security CVE advisory recently published by IBM e.g. (IBM Runtime Vulnerability affects IBM Spectrum Backup archive Client) and  vulnerability in Apache Commons Log4J affecting IBM Spectrum Protect Backup Archive Client.

[root@linux-server tsm]# rpm -qa | grep 'TIVsm-'
TIVsm-API64-8.1.8-0.x86_64
TIVsm-BA-8.1.8-0.x86_64

Assuming you're not scared of a bit automation you can straight do it with below one liner too 🙂

# rpm -e $(rpm -qa | grep TIVsm)

[root@linux-server tsm]# rpm -qa | grep gsk
[root@linux-server tsm]# rpm -e gskcrypt64 gskssl64

6. Check uninstallation success:

[root@linux-server tsm]# rpm -qa | grep TIVsm
[root@linux-server tsm]# rpm -qa | grep gsk

Here you should an Empty output, if packages are not on the system, e.g. Empty output is good output ! 🙂

7. Install new client IBM Spectrum Client (Tivoli Storage Manager) and lib dependencies

[root@linux-server tsm]# rpm -ivh gskcrypt64-8.0.55.4.linux.x86_64.rpm
[root@linux-server tsm]# rpm -ivh gskssl64-8.0.55.4.linux.x86_64.rpm

 If you're lazy to type you can do as well

[root@linux-server tsm]# rpm -Uvh gsk*

Next step is to install main Tivoli SM components the the API files and BA (The Backup Archive Client)

[root@linux-server tsm]# rpm -ivh TIVsm-API64.x86_64.rpm
[root@linux-server tsm]# rpm -ivh TIVsm-BA.x86_64.rpm

If you have to do it on multiple servers and you do it manually following a guide like this, you might instead want to install them with one liner.

[root@linux-server tsm]# rpm -ivh TIVsm-API64.x86_64.rpm TIVsm-BA.x86_64.rpm

There are some Not mandatory "Common Inventory Technology" components (at some cases if you're using the API install it we did not need that), just for the sake if you need them on your servers due to backup architecture, install also below commented rpm files.

## rpm -ivh TIVsm-APIcit.x86_64.rpm

## rpm -ivh TIVsm-BAcit.x86_64.rpm

These packages not needed only for operation WebGUI TSM GUI management, (JBB) Journal Based Backup, BAhdw (the ONTAP library)


— TIVsm-WEBGUI.x86_64.rpm
— TIVsm-JBB.x86_64.rpm
— TIVsm-BAhdw.x86_64.rpm

8. Start and enable dsmcad service

[root@linux-server tsm]# systemctl stop dsmcad

You will get

##Warning: dsmcad.service changed on disk. Run 'systemctl daemon-reload' to reload units.

[root@linux-server tsm]# systemctl daemon-reload

[root@linux-server tsm]# systemctl start dsmcad


## enable dsmcad – it is disabled by default after install

[root@linux-server ~]# systemctl enable dsmcad

[root@linux-server tsm]# systemctl status dsmcad

9. Check dmscad service is really running

Once enabled IBM TSM will spawn a process in the bacground dmscad if it started properly you should have the process backgrounded.

[root@linux-server tsm]# ps -ef|grep -i dsm|grep -v grep
root      2881     1  0 18:05 ?        00:00:01 /usr/bin/dsmcad

If process is not there there might be some library or something not at place preventing the process to start …

10. Check DSMCAD /var/tsm logs for errors

After having dsmcad process enabled and running in background

[root@linux-server tsm]# grep -i Version /var/tsm/sched.log|tail -1
12/03/2020 18:06:29   Server Version 8, Release 1, Level 10.000


[root@linux-server tsm]# cat /var/tsm/dsmerror.log

To see the current TSM configuration files we can  grep out comments *

[root@linux-server tsm]# grep -v '*' /opt/tivoli/tsm/client/ba/bin/dsm.sys

Example Configuration of the agent:
—————————————————-
   *TSM SERVER NODE Location
   Servername           tsm_server
   COMMmethod           TCPip
   TCPPort              1400
   TCPServeraddress     tsmserver2.backuphost.com
   NodeName             NODE.SERVER-TO-BACKUP-HOSTNAME.COM
   Passwordaccess       generate
   SCHEDLOGNAME         /var/tsm/sched.log
   SCHEDLOGRETENTION    21 D
   SCHEDMODE            POLLING
   MANAGEDServices      schedule
   ERRORLOGNAME         /var/tsm/dsmerror.log
   ERRORLOGRETENTION    30 D
   INCLEXCL             /opt/tivoli/tsm/client/ba/bin/inclexcl.tsm

11. Remove tsm install directory tar ball and rpms to save space on system

The current version of Tivoli service manager is 586 Megabytes.

[root@linux-server tsm]# du -hsc 8.1.11.0-TIV-TSMBAC-LinuxX86.tar
586M    8.1.11.0-TIV-TSMBAC-LinuxX86.tar

Some systems are on purpose configured to have less space under their /home directory,
hence it is a good idea to clear up unnecessery files after completion.

Lets get rid of all the IBM Spectrum archive source files and the rest of RPMs used for installation.

[root@linux-server tsm]# rm -rf ~/tsm/{*.tar,*.rpm,*.gpg,*.htm,*.txt}

12. Check backups are really created on the configured remote Central backup server

To make sure after the upgrade the backups are continuously created and properly stored on the IBM Tivoly remote central backup server, either manually initiate a backup or wait for lets say a day and run dsmc client to show all created backups from previous day. To make sure you'll not get empty output you can on purpose modify some file by simply opening it and writting over without chaning anything e.g. modify your ~/.bashrc or ~/.bash_profile

## List all backups for '/' root directory from -fromdate='DD/MM/YY'

[root@linux-server tsm]# dsmc
Protect>
IBM Spectrum Protect
Command Line Backup-Archive Client Interface
  Client Version 8, Release 1, Level 11.0
  Client date/time: 12/03/2020 18:14:03
(c) Copyright by IBM Corporation and other(s) 1990, 2020. All Rights Reserved.

Node Name: NODE.SERVER-TO-BACKUP-HOSTNAME.COM
Session established with server TSM2_SERVER: AIX
  Server Version 8, Release 1, Level 10.000
  Server date/time: 12/03/2020 18:14:04  Last access: 12/03/2020 18:06:29
 
Protect> query backup -subdir=yes "/" -fromdate=12/3/2020
           Size        Backup Date                Mgmt Class           A/I File
           —-        ———–                ———-           — —-
         6,776  B  12/03/2020 01:26:53             DEFAULT              A  /etc/freshclam.conf
         6,685  B  12/03/2020 01:26:53             DEFAULT              A  /etc/freshclam.conf-2020-12-02
         5,602  B  12/03/2020 01:26:53             DEFAULT              A  /etc/hosts
         5,506  B  12/03/2020 01:26:53             DEFAULT              A  /etc/hosts-2020-12-02
           398  B  12/03/2020 01:26:53             DEFAULT              A  /opt/tivoli/tsm/client/ba/bin/tsmstats.ini
       114,328  B  12/03/2020 01:26:53             DEFAULT              A  /root/.bash_history
           403  B  12/03/2020 01:26:53             DEFAULT              A  /root/.lesshst

Sysadmin tip: How to force a new Linux user account password change after logging to improve security

Thursday, June 18th, 2020

chage-linux-force-password-expiry-check-user-password-expiry-setting

Have you logged in through SSH to remote servers with the brand new given UNIX account in your company just to be prompted for your current Password immediately after logging and forced to change your password?
The smart sysadmins or security officers use this trick for many years to make sure the default set password for new user is set to a smarter user to prevent default password leaks which might later impose a severe security risk for a company Demiliterized networks confidential data etc.

If you haven't seen it yet and you're in the beautiful world of UNIX / Linux as a developer qa tester or sysadmin sooner or later you will face it.
Here of course I'm talking about plain password local account authentication using user / pass credentials stored in /etc/passwd or /etc/shadow.

Lets Say hello to the main command chage that is used to do this sysadmin trick.
chage command is used to change user password expiry information and  set and alter password aging parameters on user accounts.


1. Force chage to make password expire on next user login for a new created user
 

# chage -d 0 {user-name} 


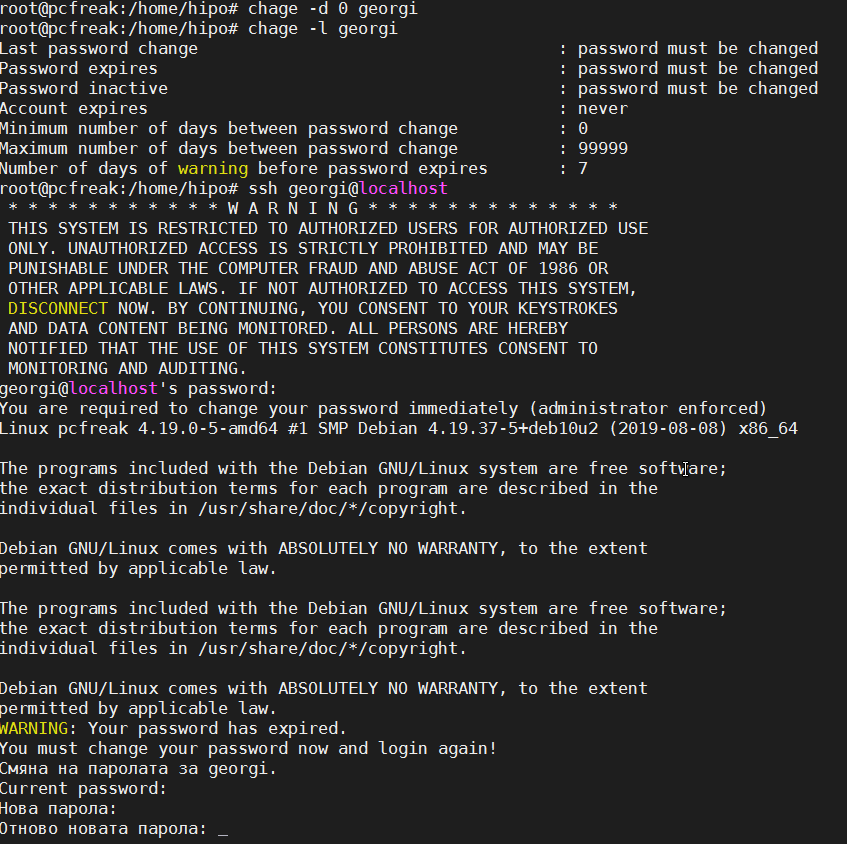
Below is a real life example
 

chage-force-user-account-password-expiry-linux


2. Get information on when account expires


[hipo@linux ~]$ chage -l hipo
Last password change                                    : Apr 03, 2020
Password expires                                        : Jul 08, 2020
Password inactive                                       : never
Account expires                                         : never
Minimum number of days between password change          : 0
Maximum number of days between password change          : 90
Number of days of warning before password expires       : 14


3. Use chage to set user account password expiration

The most straight forward way to set an expiration date for an active user acct is with:


# chage -E 2020-08-16 username


To make the account get locked automatically if the password has expired and the user did not logged in to it for 2 days after its expiration.

# chage -I 2 username


– Set Password expire with Minimum days 7 (-n mindays 7), (-x maxdays 28) and (-w warndays 5)

# passwd -n 7 -x 28 -w 5 username

To check the passwod expiration settings use list command:

# chage -l username
Last password change                                    : юни 18, 2020
Password expires                                        : юли 16, 2020
Password inactive                                       : never
Account expires                                         : never
Minimum number of days between password change          : 7
Maximum number of days between password change          : 28
Number of days of warning before password expires       : 5


chage is a command is essential sysadmin command that is mentioned in every Learn Linux book out there, however due to its often rare used many people and sysadmins either, don't know it or learn of it only once it is needed. 
A note to make here is some sysadmins prefer to use usermod to set a password expire instead of chage.

usermod -e 2020-10-14 username


For those who wonder how to set password expiry on FreeBSD and other BSD-es is done, there it is done via the pw system user management tool as chage is not present there.


A note to make here is chage usually does not provide information for Linux user accounts that are stored in LDAP. To get information of such you can use ldapsearch with a query to the LDAP domain store with something like.
 

ldapsearch -x -ZZ -LLL -b dc=domain.com,dc=com objectClass=*


It is worthy to mention also another useful command when managing users this is getent used to get entries from Name Service Switch libraries. 
getent is useful to get various information from basic /etc/ stored db files such as /etc/services /etc/shadow, /etc/group, /etc/aliases, /etc/hosts and even do some simple rpc queries.