Archive for the ‘System Administration’ Category

Enable PSK encryption on Zabbix Agent (client) sent encrypted monitored datas to Zabbix server

Friday, April 7th, 2023

zabbix-client-server-encryption-public-key-exchange

Those concerned of security and in use of their Zabbix monitored data who communicate Zabbix collected agent
data over internet or via some kind of untrusted network might definitely not enjoy the fact that zabbix-agent sents
its collected data to server in a plain text. Clear text data is allowing any network sniffer to possibly collect your
monitored server and hardware devices data and exposes all data sent over the network to same problems like in the past
the old uencrypted SMTP protocol.

To mitigate those great security hole for the paranoid sys admin it is rather easy to enable PSK (Pre Shared Key) based encryption.
To generate Pre Shared key you have to had to important values present

1. PSK Identity
2. PSK Secret

PSK secret should be minimum of 128 bit (16-byte PSK, entered as 32 hexadecimal digits), and supports up to
2048 bit (256-byte PSK, entered as 512 hexadecimal digits)

Usually something like 256 bit PSK secret on the machine should be strong enough and simply generated by running

# openssl rand -hex 32

1. Agent to zabbix server or proxy connection config

In /etc/zabbix/zabbix_agentd.conf for a Server Active (e.g. server to actively request the client to sent its collected data)
On machine running zabbix-agent should have a configuration similar to:

# cat /etc/zabbix/zabbix_agentd.conf

PidFile=/var/run/zabbix/zabbix_agentd.pid
LogFile=/var/log/zabbix/zabbix_agentd.log
LogFileSize=0

# IP of the machine
SourceIP=10.10.10.30
# turn it on if you need to execute to remote machine commands
EnableRemoteCommands=0

# IP of the server
servers=10.30.50.80
ListenPort=10080

# IP of the machine
ListenIP=10.30.30.31

# IP of the server
ServerActive=10.30.50.80

HostMetadataItem=system.uname
BufferSize=5400
MaxLinesPerSecond=5
Timeout=10
AllowRoot=0
StartAgents=5
LogRemoteCommands=0


# Machine hostname
Hostname=fqdn-of-zabbix-data-collect-server.com
Include=/etc/zabbix/zabbix_agentd.d/*.conf

# Encryption
TLSConnect=psk
TLSAccept=psk
TLSPSKIdentity=PSK to Zabbix Server5
TLSPSKFile=/etc/zabbix/zabbix_agentd.psk


! Important security note

!!! The TLSPSKIdentity value you decide will not be encrypted on transport, so don't use anything sensitive.

Once you include the TSL config

2 Generate / Create Zabbix Agent Key

Generate the key with pseudo-random bites inside /etc/zabbix/zabbix_agentd_key.psk

# cd /etc/zabbix
# openssl rand -hex 32 > zabbix_agentd_key.psk
# chown zabbix:zabbix zabbix_agentd_key.psk
# chmod 600 zabbix_agentd_key.psk

3. Configure PSK encryption in Zabbix Server Web User interface

Go to Zabbix Server User interface in browser and configure the PSK encryption options for the host.

Select the:

'Connections to host' = PSK

'Connections from host' = PSK

'PSK Identity' = [public-value-configured-in-Zabbix-agent-config]

'PSK' = [paste the long hex string generated from the OpenSSL command above]


In some seconds up to a minute or two the Zabbix Server and Agent will successfully communicate using PSK encryption.
Making the monitored data unreadable in plain text for malignant sniffers hanging in the middle equipment between the zabbix-agent and zabbix-server hosts.

4. PSK encryption behind a Proxy

Many companies, nowadays use zabbix proxy for improvement of network infrastrucutre. For example it is used to offload the zabbix-server when multiple zabbix-agents have to report various datas or to monitor servers and devices that are phyisically in separate networks or data centers (are passing through paranoic built firewalls) or monitor locations are having unreliable communications between each other.
 

To enable PSK for communications between your Zabbix Server and Zabbix Proxy.

1. Create a new secret, and add the PSK Identity and Secret to

Administration ⇾ Proxies ⇾ [Your proxy] ⇾ Encryption

2. Adjust the settings inside the zabbix proxies configuration file at /etc/zabbix/zabbix_proxy.conf


If setting up PSK encryption for agents behind a Zabbix proxy, ensure your have

Zabbix Server ⇽⇾ Proxy PSK enabled
first in Zabbix Server UI.

This is because, when you start the Proxy, or do some testing to send some key value to Zabbix server via the proxy with commands :

# zabbix_get -s 127.0.0.1 -k system.hostname
# zabbix_server -R config_cache_reload


config_cache_reload, the Proxy will download all its host settings from the server, and this also includes the servers copy of the secret.

The proxy needs to know the secret since it is now managing the communications on behalf of the server.

3. To add PSK encryption for any Agents behind a proxy, then you continue to set up the Agents as normal by creating a new secret, editing

Configuration ⇾ Hosts ⇾ [Your Host] ⇾ Encryption page

and also editing /etc/zabbix/zabbix_agentd.conf.

Remember that, since your Agents Host configuration in the Zabbix UI will be set as Monitored by Proxy, the PSK settings will be applicable for communications happening between the Zabbix Proxy and the Agent that it is monitoring, not between the Zabbix Server and the Agent behind the proxy.

You can also add PSK Encryption between your Zabbix Proxy and its own local Agent if you want.
You would set its PSK settings in the Proxy Agents host configuration at

Configuration ⇾ Hosts ⇾ [Your proxy] ⇾ Encryption

and modify the settings in the agents on configuration file at /etc/zabbix/zabbix_agentd.conf.
Keep in mind, this is only applicable to communications between the Zabbix Proxy, and its own Agent process.

When setting up PSK encryption for the Zabbix Server, Proxy and Agents, you may see an error in the Proxy logs,

cannot send proxy data to server at "zabbix.your-domain.tld": connection of type "TLS with PSK" is not allowed for proxy "your-proxy".

If you hit this, check that your

Zabbix Server ⇽⇾ Proxy PSK settings

are correct first.

Don't get confused between the Proxies own optional agent process, and its main Proxy process which is required.

Configure aide file integrity check server monitoring in Zabbix to track for file changes on servers

Tuesday, March 28th, 2023

zabbix-aide-log-monitoring-logo

Earlier I've written a small article on how to setup AIDE monitoring for Server File integrity check on Linux, which put the basics on how this handy software to improve your server overall Security software can be installed and setup without much hassle.

Once AIDE is setup and a preset custom configuration is prepared for AIDE it is pretty useful to configure AIDE to monitor its critical file changes for better server security by monitoring the AIDE log output for new record occurs with Zabbix. Usually if no files monitored by AIDE are modified on the machine, the log size will not grow, but if some file is modified once Advanced Linux Intrusion Detecting (aide) binary runs via the scheduled Cron job, the /var/log/app_aide.log file will grow zabbix-agentd will continuously check the file for size increases and will react.

Before setting up the Zabbix required Template, you will have to set few small scripts that will be reading a preconfigured list of binaries or application files etc. that aide will monitor lets say via /etc/aide-custom.conf
 

1. Configure aide to monitor files for changes


Before running aide, it is a good idea to prepare a file with custom defined directories and files that you plan to monitor for integrity checking e.g. future changes with aide, for example to capture bad intruders who breaks into server which runs aide and modifies critical files such as /etc/passwd /etc/shadow /etc/group or / /usr/local/etc/* or /var/* / /usr/* critical files that shouldn't be allowed to change without the admin to soon find out.

# cat /etc/aide-custom.conf

# Example configuration file for AIDE.
@@define DBDIR /var/lib/aide
@@define LOGDIR /var/log/aide
# The location of the database to be read.
database=file:@@{DBDIR}/app_custom.db.gz
database_out=file:@@{DBDIR}/app_aide.db.new.gz
gzip_dbout=yes
verbose=5

report_url=file:@@{LOGDIR}/app_custom.log
#report_url=syslog:LOG_LOCAL2
#report_url=stderr
#NOT IMPLEMENTED report_url=mailto:root@foo.com
#NOT IMPLEMENTED report_url=syslog:LOG_AUTH

# These are the default rules.
#
#p:      permissions
#i:      inode:
#n:      number of links
#u:      user
#g:      group
#s:      size
#b:      block count
#m:      mtime
#a:      atime
#c:      ctime
#S:      check for growing size
#acl:           Access Control Lists
#selinux        SELinux security context
#xattrs:        Extended file attributes
#md5:    md5 checksum
#sha1:   sha1 checksum
#sha256:        sha256 checksum
#sha512:        sha512 checksum
#rmd160: rmd160 checksum
#tiger:  tiger checksum

#haval:  haval checksum (MHASH only)
#gost:   gost checksum (MHASH only)
#crc32:  crc32 checksum (MHASH only)
#whirlpool:     whirlpool checksum (MHASH only)

FIPSR = p+i+n+u+g+s+m+c+acl+selinux+xattrs+sha256

#R:             p+i+n+u+g+s+m+c+acl+selinux+xattrs+md5
#L:             p+i+n+u+g+acl+selinux+xattrs
#E:             Empty group
#>:             Growing logfile p+u+g+i+n+S+acl+selinux+xattrs

# You can create custom rules like this.
# With MHASH…
# ALLXTRAHASHES = sha1+rmd160+sha256+sha512+whirlpool+tiger+haval+gost+crc32
ALLXTRAHASHES = sha1+rmd160+sha256+sha512+tiger
# Everything but access time (Ie. all changes)
EVERYTHING = R+ALLXTRAHASHES

# Sane, with multiple hashes
# NORMAL = R+rmd160+sha256+whirlpool
NORMAL = FIPSR+sha512

# For directories, don't bother doing hashes
DIR = p+i+n+u+g+acl+selinux+xattrs

# Access control only
PERMS = p+i+u+g+acl+selinux

# Logfile are special, in that they often change
LOG = >

# Just do sha256 and sha512 hashes
LSPP = FIPSR+sha512

# Some files get updated automatically, so the inode/ctime/mtime change
# but we want to know when the data inside them changes
DATAONLY =  p+n+u+g+s+acl+selinux+xattrs+sha256

##############TOUPDATE
#To delegate to app team create a file like /app/aide.conf
#and uncomment the following line
#@@include /app/aide.conf
#Then remove all the following lines
/etc/zabbix/scripts/check.sh FIPSR
/etc/zabbix/zabbix_agentd.conf FIPSR
/etc/sudoers FIPSR
/etc/hosts FIPSR
/etc/keepalived/keepalived.conf FIPSR
# monitor haproxy.cfg
/etc/haproxy/haproxy.cfg FIPSR
# monitor keepalived
/home/keepalived/.ssh/id_rsa FIPSR
/home/keepalived/.ssh/id_rsa.pub FIPSR
/home/keepalived/.ssh/authorized_keys FIPSR

/usr/local/bin/script_to_run.sh FIPSR
/usr/local/bin/another_script_to_monitor_for_changes FIPSR

#  cat /usr/local/bin/aide-config-check.sh
#!/bin/bash
/sbin/aide -c /etc/aide-custom.conf -D

# cat /usr/local/bin/aide-init.sh
#!/bin/bash
/sbin/aide -c /etc/custom-aide.conf -B database_out=file:/var/lib/aide/custom-aide.db.gz -i


# cat /usr/local/bin/aide-check.sh

#!/bin/bash
/sbin/aide -c /etc/custom-aide.conf -Breport_url=stdout -B database=file:/var/lib/aide/custom-aide.db.gz -C|/bin/tee -a /var/log/aide/custom-aide-check.log|/bin/logger -t custom-aide-check-report
/usr/local/bin/aide-init.sh


# cat /usr/local/bin/aide_app_cron_daily.txt

#!/bin/bash
#If first time, we need to init the DB
if [ ! -f /var/lib/aide/app_aide.db.gz ]
   then
    logger -p local2.info -t app-aide-check-report  "Generating NEW AIDE DATABASE for APPLICATION"
    nice -n 18 /sbin/aide –init -c /etc/aide_custom.conf
    mv /var/lib/aide/app_aide.db.new.gz /var/lib/aide/app_aide.db.gz
fi

nice -n 18 /sbin/aide –update -c /etc/aide_app.conf
#since the option for syslog seems not fully implemented we need to push logs via logger
/bin/logger -f /var/log/aide/app_aide.log -p local2.info -t app-aide-check-report
#Acknoledge the new database as the primary (every results are sended to syslog anyway)
mv /var/lib/aide/app_aide.db.new.gz /var/lib/aide/app_aide.db.gz

What above cron job does is pretty simple, as you can read it yourself. If the configuration predefined aide database store file /var/lib/aide/app_aide.db.gz, does not
exists aide will create its fresh empty database and generate a report for all predefined files with respective checksums to be stored as a comparison baseline for file changes. 

Next there is a line to write aide file changes via rsyslog through the logger and local2.info handler


2. Setup Zabbix Template with Items, Triggers and set Action

2.1 Create new Template and name it YourAppName APP-LB File integrity Check

aide-itengrity-check-zabbix_ Configuration of templates

Then setup the required Items, that will be using zabbix's Skip embedded function to scan file in a predefined period of file, this is done by the zabbix-agent that is
supposed to run on the server.

2.2 Configure Item like

aide-zabbix-triggers-screenshot
 

*Name: check aide log file

Type: zabbix (active)

log[/var/log/aide/app_aide.log,^File.*,,,skip]

Type of information: Log

Update Interval: 30s

Applications: File Integrity Check

Configure Trigger like

Enabled: Tick On

images/aide-zabbix-screenshots/check-aide-log-item


2.3 Create Triggers with the respective regular expressions, that would check the aide generated log file for file modifications


aide-zabbix-screenshot-minor-config

Configure Trigger like
 

Enabled: Tick On


*Name: Someone modified {{ITEM.VALUE}.regsub("(.*)", \1)}

*Expression: {PROD APP-LB File Integrity Check:log[/var/log/aide/app_aide.log,^File.*,,,skip].strlen()}>=1

Allow manual close: yes tick

*Description: Someone modified {{ITEM.VALUE}.regsub("(.*)", \1)} on {HOST.NAME}


2.4 Configure Action


aide-zabbix-file-monitoring-action-screensho

Now assuming the Zabbix server has  a properly set media for communication and you set Alerting rules zabbix-server can be easily set tosend mails to a Support email to get Notifications Alerts, everytime a monitored file by aide gets changed.

That's all folks ! Enjoy being notified on every file change on your servers  !
 

How to log every Linux executed command by every running system program to separte log via rsyslog for better server Security and audit trails

Wednesday, March 15th, 2023

snoopy-log-all-commands-on-linux-server-tux-logo

To keep a good eye on installed Debian Linux server security if you have to be PCI compliant (e.g. follow a high security) standards or you work in a company, where system security is crucial and any kind of security breach is untorrelated and in case of unexpected security holes exploited on running system processess listening on network peripherals (that malicious crackers) does to be able to easily identify what really happened e.g. do a Security RCA (Root Cause Analysis) for how this hack happened in order to mitigate it for future if possible capture the crackers and close the security hole the better, some kind of paranoid running program logging is required.

For such higher security systems, Linux / BSD / UNIX sysadmins can benefit from;

Snoopy command logger – a small library that logs all program executions on your Linux/BSD system.

Embedding snoopy into a running uptodate system is relatively easy, you either have to download the respective distribution package (in this particular article that would be Debian GNU / Linux) or for Linux distributions, that doesn't have the package integrated into the existing package repositories or externally available package repos, the code can be easily git cloned and installed from github snoopy program page following the README.md


However consider that snoopy run and logging the executed commands, make sure that if you use it you have rsyslogd configured to log to external logging server to make sure (someone did not manipulate the running system to avoid their actions being logged by snoopy, this is pointed by snoopy security disclaimer on the FAQ of official github snoopy project page, the page reads as so:

Security disclaimer
WARNING: Snoopy is not a reliable auditing solution.
Rogue users can easily manipulate environment to avoid their actions being logged by Snoopy. Consult this FAQ entry for more information.                


Most likely this warning is pointed out by the tool authors, in order to set the logging Tool creators free for any liability in case if someone uses the snoopy tool for some unauthorized logging
and sniffing of systems etc.

Before we proceed with the tool, install first for some clarity it is a good idea to know on what kind of Debian Linux you're about to install Snoopy command logger.

root@linux:~ # cat /etc/os-release
PRETTY_NAME="Debian GNU/Linux 11 (bullseye)"
NAME="Debian GNU/Linux"
VERSION_ID="11"
VERSION="11 (bullseye)"
VERSION_CODENAME=bullseye
ID=debian
HOME_URL="https://www.debian.org/"
SUPPORT_URL="https://www.debian.org/support"
BUG_REPORT_URL="https://bugs.debian.org/"


1. Prepare separate log file for snoopy that will keep log of every system command run by running processes visible by (ps -ef)

Next check the permissions user / group and read / write / executable flags with which the default generated rsyslog will be writting and set snoopy to whatever you would like it to write with

root@linux:~ # cat /etc/rsyslog.conf | grep "^\$File\|\$Umask"~
$FileOwner root
$FileGroup adm
$FileCreateMode 0640


Create Rsyslog configuration for snoopy.log

root@linux:~ # cat << EOF | sudo tee /etc/rsyslog.d/01-snoopy.conf
# Send snoopy messages to a dedicated logfile
if (\$programname startswith "snoopy") then {
  action(type="omfile" fileOwner="root" fileGroup="root" fileCreateMode="0600" file="/var/log/snoopy.log")
  stop
}

EOF


To make sure that snoopy library will be preloaded after installation on next boot:

root@linux:~ # cat << EOF | sudo debconf-set-selections
snoopy snoopy/install-ld-preload boolean true
EOF


root@linux:~ # systemctl restart rsyslog


root@linux:~ # systemctl status rsyslog
● rsyslog.service – System Logging Service
     Loaded: loaded (/lib/systemd/system/rsyslog.service; enabled; vendor preset: enabled)
     Active: active (running) since Tue 2023-03-14 12:59:05 EET; 59min ago
TriggeredBy: ● syslog.socket
       Docs: man:rsyslogd(8)
             man:rsyslog.conf(5)
             https://www.rsyslog.com/doc/
   Main PID: 713745 (rsyslogd)
      Tasks: 6 (limit: 4654)
     Memory: 1.1M
        CPU: 548ms
     CGroup: /system.slice/rsyslog.service
             └─713745 /usr/sbin/rsyslogd -n -iNONE

мар 14 12:59:05 haproxy2 systemd[1]: Started System Logging Service.
мар 14 12:59:05 haproxy2 rsyslogd[713745]: warning: ~ action is deprecated, consider using the 'stop' statement instead [v8.210>
мар 14 12:59:05 haproxy2 rsyslogd[713745]: [198B blob data]
мар 14 12:59:05 haproxy2 rsyslogd[713745]: imuxsock: Acquired UNIX socket '/run/systemd/journal/syslog' (fd 3) from systemd.  [>
мар 14 12:59:05 haproxy2 rsyslogd[713745]: [origin software="rsyslogd" swVersion="8.2102.0" x-pid="713745" x-info="https://www.>
мар 14 13:19:05 haproxy2 rsyslogd[713745]: — MARK —
мар 14 13:39:05 haproxy2 rsyslogd[713745]: — MARK —


2. Install snoopy deb package and configure it

root@linux:~ # apt install snoopy
Четене на списъците с пакети… Готово
Изграждане на дървото със зависимости… Готово
Четене на информацията за състоянието… Готово
Следните пакети са били инсталирани автоматично и вече не са необходими:
  bsdmainutils cpp-8 geoip-database libasan5 libbind9-161 libcroco3 libdns1104 libdns1110 libevent-core-2.1-6
  libevent-pthreads-2.1-6 libgdk-pixbuf-xlib-2.0-0 libgdk-pixbuf2.0-0 libgeoip1 libicu63 libisc1100 libisc1105 libisccc161
  libisccfg163 libisl19 liblwres161 libmpdec2 libmpx2 libperl5.28 libpython2-stdlib libpython2.7-minimal libpython2.7-stdlib
  libpython3.7-minimal libpython3.7-stdlib libreadline7 netcat-traditional node-ansi-align node-arrify node-bluebird
  node-boxen node-builtin-modules node-call-limit node-camelcase node-cli-boxes node-cliui node-co node-concat-stream
  node-config-chain node-cross-spawn node-cyclist node-decamelize node-decompress-response node-deep-extend node-detect-indent
  node-detect-newline node-duplexer3 node-duplexify node-editor node-end-of-stream node-errno node-execa node-find-up
  node-flush-write-stream node-from2 node-fs-vacuum node-get-caller-file node-get-stream node-got node-has-symbol-support-x
  node-has-to-string-tag-x node-import-lazy node-invert-kv node-is-buffer node-is-builtin-module node-is-npm node-is-object
  node-is-plain-obj node-is-retry-allowed node-is-stream node-isurl node-json-buffer node-kind-of node-latest-version
  node-lazy-property node-lcid node-libnpx node-locate-path node-lowercase-keys node-mem node-merge-stream node-mimic-fn
  node-mimic-response node-minimist node-mississippi node-node-uuid node-npm-run-path node-os-locale node-p-cancelable
  node-p-finally node-p-limit node-p-locate node-p-timeout node-package-json node-parallel-transform node-path-exists
  node-path-is-inside node-prepend-http node-proto-list node-prr node-pump node-pumpify node-qw node-rc
  node-registry-auth-token node-registry-url node-require-directory node-require-main-filename node-semver-diff node-sha
  node-shebang-command node-shebang-regex node-slide node-sorted-object node-stream-each node-stream-iterate node-stream-shift
  node-strip-eof node-strip-json-comments node-term-size node-through2 node-timed-out node-typedarray node-uid-number
  node-unpipe node-url-parse-lax node-url-to-options node-which-module node-widest-line node-wrap-ansi node-xdg-basedir
  node-xtend node-y18n node-yargs node-yargs-parser perl-modules-5.28 python-pkg-resources python2 python2-minimal python2.7
  python2.7-minimal python3.7-minimal

Използвайте „apt autoremove“ за да ги премахнете.
Следните НОВИ пакети ще бъдат инсталирани:
  snoopy
0 актуализирани, 1 нови инсталирани, 0 за премахване и 1 без промяна.
Необходимо е да се изтеглят 46,0 kB архиви.
След тази операция ще бъде използвано 124 kB допълнително дисково пространство.
Изт:1 http://deb.debian.org/debian bullseye/main amd64 snoopy amd64 2.4.12-1 [46,0 kB]
Изтеглени 46,0 kB за 0с (93,2 kB/сек)
Предварително настройване на пакети …


Selecting previously unselected package snoopy.
(Reading database … 56067 files and directories currently installed.)
Preparing to unpack …/snoopy_2.4.12-1_amd64.deb ...
Unpacking snoopy (2.4.12-1) …
Setting up snoopy (2.4.12-1) …
Processing triggers for libc-bin (2.31-13+deb11u5) …

root@linux:/etc# ls -al /var/log/snoopy.log
-rw——- 1 root root 14472 14 мар 13:40 /var/log/snoopy.log

Any specific configuration for snoopy can be tuned through /etc/snoopy.ini

Now you will find all the commands executed by all monitored running processes in /var/log/snoopy.

root@linux:/etc# tail -30 /var/log/snoopy.log
Mar 14 12:59:32 haproxy2 snoopy[713804]: [login:root ssh:(192.168.0.1 62796 192.168.0.210 22) sid:713792 tty:/dev/pts/2 (0/root) uid:root(0)/root(0) cwd:/]: ldconfig
Mar 14 12:59:32 haproxy2 snoopy[713806]: [login:zabbix ssh:((undefined)) sid:682168 tty:(none) ((none)/(none)) uid:zabbix(108)/zabbix(108) cwd:/]: who
Mar 14 12:59:32 haproxy2 snoopy[713807]: [login:zabbix ssh:((undefined)) sid:682168 tty:(none) ((none)/(none)) uid:zabbix(108)/zabbix(108) cwd:/]: wc -l
Mar 14 13:00:07 haproxy2 snoopy[713815]: [login:root ssh:((undefined)) sid:713815 tty:(none) ((none)/(none)) uid:root(0)/root(0) cwd:/usr/lib/sysstat]: /usr/lib/sysstat/sadc -F -L -S DISK 1 1 /var/log/sysstat
Mar 14 13:00:32 haproxy2 snoopy[713823]: [login:zabbix ssh:((undefined)) sid:682168 tty:(none) ((none)/(none)) uid:zabbix(108)/zabbix(108) cwd:/]: who
Mar 14 13:00:32 haproxy2 snoopy[713824]: [login:zabbix ssh:((undefined)) sid:682168 tty:(none) ((none)/(none)) uid:zabbix(108)/zabbix(108) cwd:/]: wc -l
Mar 14 13:01:32 haproxy2 snoopy[713834]: [login:zabbix ssh:((undefined)) sid:682168 tty:(none) ((none)/(none)) uid:zabbix(108)/zabbix(108) cwd:/]: who
Mar 14 13:01:32 haproxy2 snoopy[713835]: [login:zabbix ssh:((undefined)) sid:682168 tty:(none) ((none)/(none)) uid:zabbix(108)/zabbix(108) cwd:/]: wc -l
Mar 14 13:02:32 haproxy2 snoopy[713843]: [login:zabbix ssh:((undefined)) sid:682168 tty:(none) ((none)/(none)) uid:zabbix(108)/zabbix(108) cwd:/]: who
Mar 14 13:02:32 haproxy2 snoopy[713844]: [login:zabbix ssh:((undefined)) sid:682168 tty:(none) ((none)/(none)) uid:zabbix(108)/zabbix(108) cwd:/]: wc -l
Mar 14 13:03:32 haproxy2 snoopy[713855]: [login:zabbix ssh:((undefined)) sid:682168 tty:(none) ((none)/(none)) uid:zabbix(108)/zabbix(108) cwd:/]: who
Mar 14 13:03:32 haproxy2 snoopy[713856]: [login:zabbix ssh:((undefined)) sid:682168 tty:(none) ((none)/(none)) uid:zabbix(108)/zabbix(108) cwd:/]: wc -l
Mar 14 13:04:32 haproxy2 snoopy[713868]: [login:zabbix ssh:((undefined)) sid:682168 tty:(none) ((none)/(none)) uid:zabbix(108)/zabbix(108) cwd:/]: who


3. Set up logrotation (archiving) for snoopy logs

root@linux:/etc# vim /etc/logrotate.d/snoopy    


/var/log/snoopy.log {
        daily
        rotate 30
        compress
        delaycompress
        notifempty
        create 640 root adm

}
 

If you want to test logrotation without actually rotating the file:               

root@linux:/etc# logrotate –debug –force /etc/logrotate.d/snoopy   
  log needs rotating
rotating log /var/log/snoopy.log, log->rotateCount is 30
dateext suffix '-20230314'
glob pattern '-[0-9][0-9][0-9][0-9][0-9][0-9][0-9][0-9]'
previous log /var/log/snoopy.log.1 does not exist
renaming /var/log/snoopy.log.30.gz to /var/log/snoopy.log.31.gz (rotatecount 30, logstart 1, i 30),


renaming /var/log/snoopy.log.1.gz to /var/log/snoopy.log.2.gz (rotatecount 30, logstart 1, i 1),
renaming /var/log/snoopy.log.0.gz to /var/log/snoopy.log.1.gz (rotatecount 30, logstart 1, i 0),
log /var/log/snoopy.log.31.gz doesn't exist — won't try to dispose of it
renaming /var/log/snoopy.log to /var/log/snoopy.log.1
creating new /var/log/snoopy.log mode = 0640 uid = 0 gid = 4


4. Monitoring only selected applications  executed commands with snoopy                                                                             

By default snoopy after installed will set itself to monitor all kind of running processes on the system is done by preloading the ldconfig's (libcld.so.preload

root@haproxy2:/etc# cat /etc/ld.so.preload
/lib/x86_64-linux-gnu/libsnoopy.so

If you want to monitor a concrete application and not log everything from the running processes in process list, comment this out this line run ldconfig command

Then to any concrete application you would like to monitor with snoopy add to its init script either /etc/init.d/app_init_script or to systemctl's start script before the application binary program run:

export LD_PRELOAD=/lib/snoopy.so


  As per the README states


 Snoopy is placed in /etc/ld.so.preload to trap all occurrences of exec, if 
 you wish to monitor only certain applications you can do so through the    
 LD_PRELOAD environment variable.
Simply set it to /lib/snoopy.so before  loading the application.

For example

 # export LD_PRELOAD=/lib/snoopy.so                                           
 # lynx http://example.com/                           


Switching from PasswordSafe to Keepass database, migrating .psafe3 to .kdbx format howto

Thursday, February 23rd, 2023

passwordsafe-to-keepass-migration-logo

I have been using PasswordSafe for many years within my job location as system administrator on the Windows computers I do use as dumb hosts to administrate remotely via ssh servers, develop code in bash / perl or just store different SysAdmin management tools and interfaces passwords. The reason behind was simply that I come out from a Linux background as I've used for daily Sysadmin job for many years GNU / Linux and there I always prefer GNOME (gnome GTK interface) in favour of KDE's (QT Library), and whence I came to work for the "Evil" Windows oriented world of corporations  for the sake of Outlook use and Office 365 as well as Citrix accessibility i've become forced by the circumstances to use Windows. 
Hence for a PasswordManager for Windows back in the years, I preferred the simplicity of interface of PasswordSafe instead of Keepass which always reminded me of the nasty KDE.
PasswordSafe is really cool and a handy program and it works well, but recetnly when I had to store many many passwords and easily navigate through each of it I realized, by observing colleagues, that KeePass as of time of writting this article is much more Powerful and easy to use, as I can see all records of a searched passwords on a Single screen, instead of scrolling like crazy with PasswordSafe through the passowrds.

I didn’t really feel like cutting and pasting every field for all my passwords (plus I started experiencing some PasswordSafe copy / paste passwords issues – maybe not related to PasswordSafe itself so this was the turning point I decided to migrate to Keepass.

For that, started looking at the import export functions for each program. 

After a quick search, I found few articles online explaining on how the migration of PasswordSafe to KeePass can be easily handled as the versions of Keepass and Password safe are moving all the time, of course usually some of the guides to be found online are never competely upto date, so I had to slightly modify one of the articles and come up with this one 🙂 .
 

  •  My PasswordSafe program that keeps my account password records and notes is version is
    V 3.59 built on May 28 2022 and is running on my Windows 10 OS 64 bit release
  • The installed KeePass version to where I have migrated the Pwsafe password database Successfully is 2.48 64 Bit
     
  1. Use the Password Safe function to export to XML file Format
    (File -> Export To -> XML Format )


    pwsafe.screenshot-export-password-psafe3
     

  2. Import the text file into KeePass
    (File->Import From-> Password Safe XML file)


    import-file-data-keepass-screenshot

This process worked quite fine. All of the passwords were imported .
Despite the importing (expected small glitches – please recheck that all was imported fine, before joy), the process is quicker than copy/pasting every field for each entry.

For those of you who are more worried about security than I am, you know this is a very insecure method to transfer passwords. For others, you may wish to export the (unencrypted) text file to a Veracrypt – that is a Truecypt fork (as nowadays obsolete unmaintaned and probably insecury) – a Free Open-Source On-The-Fly Disk Encryption Software to prepare  Veracrypt  partition and / or use Eraser on the text file once you’re finished with it or use another of the free Veracrypt open-source (free software) alternatives such DiskCryptor or even the proprietary Windows BitLocker / CipherShed / Axcrypt or some other encryption alternative software for Windows XP / 2000 / 7 10 that is out there.

NB! Please  don’t do this on a public computer or a PC that you don't administrate.
You never know who might find your passwords or might be sniffing on your OS, as today there are so many devices that perhaps are hacked and listening and collecting password datas  🙂

That's it now I enjoy my KeePass but I'm thankful to PasswordSafe developers, who have easified my password management Virtual life for years 🙂
Any hints on how you migrated PasswordSafe to Keepass are mostly welcome. Also will be nice to hear of hard-core PasswordSafe hints or plugins that can power-up the password storage, maybe I can get convinced back to return back to PasswordSafe 🙂
 

Linux extending life time for a damaged hard drive server tricks on a live server. Force fcsk on next reboot.Read-only file system error solutions

Friday, February 17th, 2023

linux-extending-life-time-for-a-damaged-hard-drive-server-tricks-can-not-read-superblock-linux-force-fsck-on-next-reboot

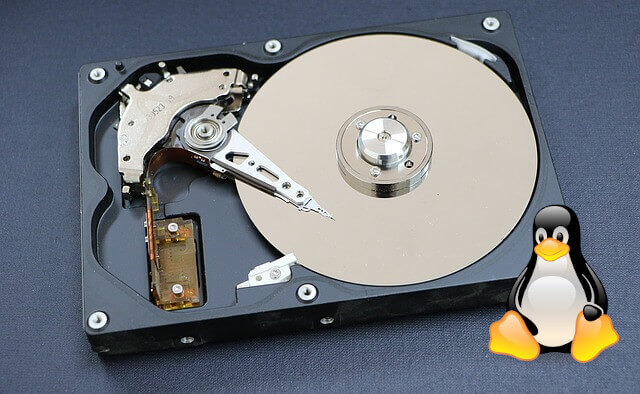
In our daily work as system administrators we have some very old Legacy systems running Clustered High Availability proxies using CRM (Cluster Resource Manager) and some legacy systems still using Heartbeat to manage the cluster instead of the newer and modern Corosync variant.

The HA cluster is only 2 nodes Linux machine and running the obscure already long time unsupported version of Redhat 5.11 (Ootpa) who was officially became stable distant year 1998 (yeath the years were good) and whose EOL (End of Life) has been reached long time ago and the OS is no longer supported, however for about 14 years the machines has been running perfectly fine until one of the Cluster nodes managed by ocf::heartbeat:IPAddr2 , that is  /etc/ha.d/resource.d/IPAddr2 shell script. Yeah for the newbies Heartbeat Application Cluster in Linux does work like that it uses a number of extendable pair of shell scripts written for different kind of Network / Web / Mail / SQL or whatever services HA management.

The first node configured however, started failing due to some errors like:
 

EXT3-fs error (device dm-1): ext3_journal_start_sb: Detected aborted journal
sd 0:2:0:0: rejecting I/O to offline device
Aborting journal on device sda1.
sd 0:2:0:0: rejecting I/O to offline device
printk: 159 messages suppressed.
Buffer I/O error on device sda1, logical block 526
lost page write due to I/O error on sda1
sd 0:2:0:0: rejecting I/O to offline device
ext3_abort called.
EXT3-fs error (device sda1): ext3_journal_start_sb: Detected aborted journal
Remounting filesystem read-only
sd 0:2:0:0: rejecting I/O to offline device
megaraid_sas: FW was restarted successfully, initiating next stage…
megaraid_sas: HBA recovery state machine, state 2 starting…
megasas: Waiting for FW to come to ready state
megasas: FW in FAULT state!!
FW state [-268435456] hasn't changed in 180 secs
megaraid_sas: out: controller is not in ready state
megasas: waiting_for_outstanding: after issue OCR. 
megasas: waiting_for_outstanding: before issue OCR. FW state = f0000000
megaraid_sas: pending commands remain even after reset handling. megasas[0]: Dumping Frame Phys Address of all pending cmds in FW
megasas[0]: Total OS Pending cmds : 0 megasas[0]: 64 bit SGLs were sent to FW
megasas[0]: Pending OS cmds in FW :

The result out of that was a frequently the filesystem of the machine got re-mounted as Read Only and of course that is
quite bad if you have a running processess of haproxy that should be able to be living their and take up some Web traffic
for high availability and you run all the traffic only on the 2nd pair of machine.

This of course was a clear sign for a failing disks or some hit bad blocks regions or as the messages indicates, some
problem with system hardware or Raid SAS Array.

The physical raid on the system, just like rest of the hardware is very old stuff as well.

[root@haproxy_lb_node1 ~]# lspci |grep -i RAI
01:00.0 RAID bus controller: LSI Logic / Symbios Logic MegaRAID SAS 2108 [Liberator] (rev 05)

The produced errors not only made the machine to auto-mount its root / filesystem in Read-Only mode but besides has most
likely made the machine to automatically reboot every few days or few times every day in a raw.

The second Load Balancer node2 did operated perfectly, and we thought that we might just keep the broken machine in that half running
and inconsistent state for few weeks until we have built the new machines with Pre-Installed new haproxy cluster with modern
RedHat Linux 8.6 distribution, but since we have to follow SLAs (Service Line Agreements) with Customers and the end services behind the
High Availability (HA) Haproxy cluster were at danger … 

We as sysadmins had the task to make our best to try to stabilize the unstable node with disk errors for the system to servive
and be able to normally serve traffic (if node2 that is in a separate Data center fails due to a hardware or electricity issues etc.)
.

Here is few steps we took, that has hopefully improved the situation.

1. Make backups of most important files of high importance

Always before doing anything with a broken system, prepare backup of the most important files, if that is a cluster that should be a backup of the cluster configurations (if you don't have already ones) backup of /etc/hosts / backup of any important services configs /etc/haproxy/haproxy.cfg /etc/postfix/postfix.cfg (like it was my case), preferrably backup of whole /etc/  any important files from /root/ or /home/users* directories backup of at leasts latest logs from /var/log etc.
 

2. Clear up all unnecessery services scripts from the server

Any additional Softwares / Services and integrity checking tools (daemons) / scripts and cron jobs, were immediately stopped and wheter unused removed.

E.g. we had moved through /etc/cron* to check what's there,

# ls -ld /etc/cron.*
drwx—— 2 root root 4096 Feb  7 18:13 /etc/cron.d
drwxr-xr-x 2 root root 4096 Feb  7 17:59 /etc/cron.daily
-rw-r–r– 1 root root    0 Jul 20  2010 /etc/cron.deny
drwxr-xr-x 2 root root 4096 Jan  9  2013 /etc/cron.hourly
drwxr-xr-x 2 root root 4096 Jan  9  2013 /etc/cron.monthly
drwxr-xr-x 2 root root 4096 Aug 26  2015 /etc/cron.weekly


And like well professional butchers removed everything unnecessery that could trigger any extra unnecessery disk read / writes to HDD.

E.g. just create

# mkdir -p /root/etc_old/{/etc/cron.d,\
/etc/cron.daily,/etc/cron.hourly,/etc/cron.monthly\
,/etc/cron.weekly}


And moved all unnecessery cron job scripts like:

1. nmon (old school network / memory / hard disk console tool for monitoring and tuning server parameters)
2. clamscan / freshclam crons
3. mlocate (the script that is taking care for periodic run of updatedb command to keep the locate command to easily search
for files inside the DB to put less read operations on disk in case if you need to find file (e.g. prevent yourself to everytime
run cmd like: find / . -iname '*whatever_you_look_for*'
4. cups cron jobs
5. logwatch cron
6. rkhunter stuff
7. logrotate (yes we stopped even logrotation trigger job as we found the server was crashing sometimes at the same time when
the lograte job to rotate logs inside /var/log/* was running perhaps leading to a hit of the I/O read error (bad blocks).


Also inspected the Administrator user root cron job for any unwated scripts and stopped two report bash scripts that were part of the PCI tightened Security procedures.
Therein found script responsible to periodically report the list of installed packages and if they have not changed, as well a script to periodically report via email the list of
/etc/{passwd,/etc/shadow} created users, used to historically keep an eye on the list of users and easily see if someone
has created new users on the machine. Those were enabled via /var/spool/cron/root cron jobs, in other cases, on other machines if it happens for you
it is a good idea to check out all the existing user cron jobs and stop anything that might be putting Read / Write extra heat pressure on machine attached the Hard drives.

# ls -al /var/spool/cron/
total 20
drwx——  2 root root 4096 Nov 13  2015 .
drwxr-xr-x 12 root root 4096 May 11  2011 ..
-rw——-  1 root root  133 Nov 13  2015 root


3. Clear up old log files and any files unnecessery

Under /var/log and /home /var/tmp /var/spool/tmp immediately try to clear up the old log files.
From my past experience this has many times made the FS file inodes that are storing on a unbroken part (good blocks) of the hard drive and
ready to be reused by newly written rsyslog / syslogd services spitted files.

!!! Note that during the removal of some files you might hit a files stored on a bad blocks that might lead to a unexpected system reboot.

But that's okay, don't worry most likely after a hard reset by a technician in the Datacenter the machine will boot again and you can enjoy
removing remaining still files to send them to the heaven for old files.


4. Trigger an automatic system file system check with fsck on next boot

The standard way to force a Linux to aumatically recheck its Root filesystem is to simply create the /forcefsck to root partition or any other secondary disk partition you would like to check.

# touch /forcefsck

# reboot


However at some occasions you might be unable to do it because, the / (root fs) has been remounted in ReadOnly mode, yackes …

Luckily old Linux distibutions like this RHEL 5.1, has a way to force a filesystem check after reboot fsck and identify any
unknown bad-blocks and hopefully succceed in isolating them, so you don't hit into the same auto-reboots if the hard drive or Software / Hardware RAID
is not in terrible state
, you can use an option built in in /sbin/shutdown command the '-F'

   -F     Force fsck on reboot.


Hence to make the machine reboot and trigger immediately fsck:

# shutdown -rF now


Just In case you wonder why to reboot before check the Filesystem. Well simply because you need to have them unmounted before you check.

In that specific case this produced so far a good result and the machine booted just fine and we crossed the fingers and prayed that the machine would work flawlessly in the coming few weeks, before we finalize the configuration of the substitute machines, where this old infrastructure will be migrated to a new built cluster with new Haproxy and Corosync / Pacemaker Cluster on a brand new RHEL.

NB! On newer machines this won't work however as shutdown command has been stripped off this option because no SystemV (SystemInit) or Upstart and not on SystemD newer services architecture.
 

5. Hints on checking the hard drives with fsck

If you happen to be able to have physical access to the remote Hardare machine via a TTY[1-9] Console, that's even better and is the standard way to do it but with this specific case we had no easy way to get access to the Physical server console.

It is even better to go there and via either via connected Monitor (Display) or KVM Switch (Those who hear KVM switch first time this is a great device in server rooms to connect multiple monitors to same Monitor Display), it is better to use a some of the multitude of options to choose from for USB Distro Linux recovery OS versions or a CDROM / DVD on older machines like this with the Redhat's recovery mode rolled on.
After mounting the partition simply check each of the disks
e.g. :

# fsck -y /dev/sdb
# fsck -y /dev/sdc

Or if you want to not waste time and look for each hard drive but directly check all the ones that are attached and known by Linux distro via /etc/fstab definition run:

# fsck -AR

If necessery and you have a mixture of filesystems for example EXT3 , EXT4 , REISERFS you can tell it to omit some filesystem, for example ext3, like that:

# fsck -AR -t noext3 -y


To skip fsck on mounted partitions with fsck:

# fsck -M /dev/sdb


One remark to make here on fsck is usually fsck to complete its job on various filesystem it uses other external component binaries usually stored in /sbin/fsck*

ls -al /sbin/fsck*
-rwxr-xr-x 1 root root  55576 20 яну 2022 /sbin/fsck*
-rwxr-xr-x 1 root root  43272 20 яну 2022 /sbin/fsck.cramfs*
lrwxrwxrwx 1 root root      9  4 юли 2020 /sbin/fsck.exfat -> exfatfsck*
lrwxrwxrwx 1 root root      6  7 юни 2021 /sbin/fsck.ext2 -> e2fsck*
lrwxrwxrwx 1 root root      6  7 юни 2021 /sbin/fsck.ext3 -> e2fsck*
lrwxrwxrwx 1 root root      6  7 юни 2021 /sbin/fsck.ext4 -> e2fsck*
-rwxr-xr-x 1 root root  84208  8 фев 2021 /sbin/fsck.fat*
-rwxr-xr-x 2 root root 393040 30 ное 2009 /sbin/fsck.jfs*
-rwxr-xr-x 1 root root 125184 20 яну 2022 /sbin/fsck.minix*
lrwxrwxrwx 1 root root      8  8 фев 2021 /sbin/fsck.msdos -> fsck.fat*
-rwxr-xr-x 1 root root    333 16 дек 2021 /sbin/fsck.nfs*
lrwxrwxrwx 1 root root      8  8 фев 2021 /sbin/fsck.vfat -> fsck.fat*


6. Using tune2fs to  adjust tunable filesystem parameters on ext2/ext3/ext4 filesystems (few examples)

a) To check whether really the filesystem was checked on boot time or check a random filesystem on the server for its last check up date with fsck:

#  tune2fs -l /dev/sda1 | grep checked
Last checked:             Wed Apr 17 11:04:44 2019

On some distributions like old Debian and Ubuntu, it is even possible to enable fsck to log its operations during check on reboot via changing the verbosity from NO to YES:

# sed -i "s/#VERBOSE=no/VERBOSE=yes/" /etc/default/rcS


If you're having the issues on old Debian Linuxes  and not on RHEL  it is possible to;

b) Enable all fsck repairs automatic on boot

by running via:
 

# sed -i "s/FSCKFIX=no/FSCKFIX=yes/" /etc/default/rcS


c) Forcing fcsk check on for server attached Hard Drive Partitions with tune2fs

# tune2fs -c 1 /dev/sdXY

Note that:
tune2fs can force a fsck on each reboot for EXT4, EXT3 and EXT2 filesystems only.

tune2fs can trigger a forced fsck on every reboot using the -c (max-mount-counts) option.
This option sets the number of mounts after which the filesystem will be checked, so setting it to 1 will run fsck each time the computer boots.
Setting it to -1 or 0 resets this (the number of times the filesystem is mounted will be disregarded by e2fsck and the kernel).


 For example you could:

d) Set fsck to run a filesystem check every 30 boots, by using -c 30 
 

# tune2fs -c 30 /dev/sdXY


e) Checking whether a Hard Drive has been really checked on the boot


#  tune2fs -l /dev/sda1 | grep checked
Last checked:             Wed Apr 17 11:04:44 2019


e) Check when was the last time the file system /dev/sdX was checked:
 

# tune2fs -l /dev/sdX | grep Last\ c
Last checked:             Thu Jan 12 20:28:34 2017


f) Check how many times our /dev/sdX filesystem was mounted

# tune2fs -l /dev/sdX | grep Mount
Mount count:              157

g) Check how many mounts are allowed to pass before filesystem check is forced
 

# tune2fs -l /dev/sdX | grep Max
Maximum mount count:      -1


7. Repairing disk / partitions via GRUB fsck.mode and fsck.repair kernel module options

It is also possible to force a fsck.repair on boot via GRUB, but that usually is not an option someone would like as the machine might fail too boot if it hards to repair hardly, however in difficult situations with failing disks temporary enabling it is good idea.

This can be done by including for grub initial config

GRUB_CMDLINE_LINUX_DEFAULT="quiet splash fsck.mode=force fsck.repair=yes"

fsck.mode=force – will force a fsck each time a system boot and keeping that value enabled for a long time inside GRUB is stupid for servers as

sometimes booting could be severely prolonged because of the checks especially with servers with many or slow old hard drives.

fsck.repair=yes – will make the fsck try to repair if it finds bad blocks when checking (be absolutely sure you know, what you're doing if passing this options)

The options can be also set via editing the GRUB boot screen, if you have physical access to the server and don't want to reload the grub loader and possibly make the machine unbootable on next boot.
 

8. Few more details on how /etc/fstab disk fsck check parameters values for Systemd Linux machines works

The "proper" way on systemd (if we can talk about proper way on Linux) to runs fsck for each filesystem that has a fsck is to pass number greater than 0 set in
/etc/fstab (last column in /etc/fstab), so make sure you edit your /etc/fstab if that's not the case.

The root partition should be set to 1 (first to be checked), while other partitions you want to be checked should be set to 2.

Example /etc/fstab:
 

# /etc/fstab: static file system information.

/dev/sda1  /      ext4  errors=remount-ro  0  1
/dev/sda5  /home  ext4  defaults           0  2

The values you can put here as a second number meaning is as follows:
0 – disabled, that is do not check filesystem
1 – partition with this PASS value has a higher priority and is checked first. This value is usually set to the root / partition
2 – partitions with this PASS value will be checked last

a) Check the produced log out of fsck

Unfortunately on the older versions of Linux distros with SystemV fsck log output might be not generated except on the physical console so if you have a kind of duplicator device physical tty on the display port of the server, you might capture some bad block reports or fixed errors messages, but if you don't you might just cross the fingers and hope that anything found FS irregularities was recovered.

On systemd Linux machines the fsck log should be produced either in /run/initramfs/fsck.log or some other location depending on the Linux distro and you should be able to see something from fsck inside /var/log/* logs:

# grep -rli fsck /var/log/*


Close it up

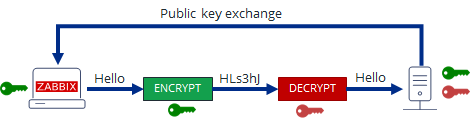
Having a system with failing disk is a really one of the worst sysadmin nightmares to get. The good news is that most of the cases we're prepared with some working backup or some work around stuff like the few steps explained to mitigate the amount of Read / Writes to hard disks on the failing machine HDDs. If the failing disk is a primary Linux filesystem all becomes even worse as every next reboot, you have no guarantee, whether the kernel / initrd or some of the other system components required to run the Core Linux system won't break up the normal boot. Thus one side changes on the hard drives is a risky business on ther other side, if you're in a situation where you have a mirror system or the failing system is just a Linux server installed without a Cluster pair, then this is not a big deal as you can guarantee at least one of the nodes still up, unning and serving. Still doing too much of operations with HDD is always a danger so the steps described, though in most cases leading to improvement on how the system behaves, the system should be considered totally unreliable and closely monitored not only by some monitoring stuff like Zabbix / Prometheus whatever but regularly check the systems state via normal SSH logins. It is important if you have some important datas or logs on the system that are not synchronized to a system node to copy them before doing any of the described operations. After all minimal is backuped, proceed to clear up everything that might be cleared up and still the machine to continue providing most of its functionalities, trigger fsck automatic HDD check on next reboot, reboot, check what is going on and monitor the machine from there on.

Hopefully the few described steps, has helped some sysadmin. There is plenty of things which I've described that might go wrong, even following the described steps, might not help if the machines Storage Drives / SAS / SSD has too much of a damage. But as said in most cases following this few steps would improve the machine state.

Wish you the best of luck!


iSH, the best free SSH / Telnet client for iOS iPhone, iPad equivallent of MobaXterm and fully functional Alpine Linux emulator

Wednesday, February 8th, 2023

ish-linux-terminal-emulator-for-iphone-ipad-ios-logo-screenshoticon

Since few months I've switched my old BLU r1 HD Phone (a great old low budget phone for its price) to a friend's iPhone 10 ( X ) who gifted it for me. Coming from Android world, everyone who has experience with it is a pain in the ass as some of the Apps, which are into Google's play store does not have the same equivalent into Apple's install Package manager tool AppStore. Some of the crucial tools which I was interested as a freshly new migrated user from Android to iPhone was to have a decent SSH / Telnet client and Terminal, with which I can easily connect to my Linux servers both home and work. 

As Android Phone user, to connect and manage my SSH sessions I used most often some of the most popular Connectbot / SSHDroid / JuiceSSH.
On Android I've usually installed all of these tools but most frequently used Connectbot, which quickly become my favourite SSH client for Android over time.

The reasons why I really loved Connectbot and used it on Android OS in short:

  • It is Completely free
  • Ad-free
  • Open-source (too bad not Free software but still step better)
  • Copy and paste text between Applications
  • Customizable interface (i.e. font size, keyboard layout, SSH auth agent, etc.)


connectbot-android-ssh-remote-connect-client-screenshot

I've seen some people used and preferred Termius but never myself really liked this client, as it was including some Advertisements or for don't remember why reason.
Switching to iOS mobile operating system, of course was quite a shock especially the moment I found out the standard loved SSH Remote Client programs are used are not available or have only a paid version. Thus it took me quite a while of a research and googling until I found some decent stuff.

termius-ssh-telnet-client-ios-screenshot

Tried for a time with Termius as well but again, its Ads and lack of some functionality pissed me off, so I've moved on to Shelly.

shelly-iphone-ssh-telnet-client-ios-screenshot

Shelly is really not a bad tool but has limitation over the SSH sessions you can add and other limitations, which can only be unlocked with an "Upgrade", to its paid version, thus I decided after few weeks of attempts to make it my remote server management mobile tool for iPhone, I've dropped it off as well.

Then I found the Blink Shell App – Blink Shell is a professional, desktop grade terminal for iOS. As overall the tool is really great and is easy to use but again to have it used in its full power you need the paid version and until you pay for it every now and then you got interruption of your shell for some really annoying ads.
Thus even though I used it for a times this few tools with whom basicly you can do basic remote ssh / telnet session operations eventually,  started looking for a better SSH Client Free alternative for iPhone Users.

Then came a friend at home for a dinner my dear friend Milen (Static) and he show me iOS.
The moment I saw this tool I totally loved it, for its simplicity and its resemblance to a classical TTY Physical old Linux console I used back in the days and its ability to resemble easily any improved functionaltiy through simple screen (multiple session management) command tool or tmux.

Wait, what's iSH ? And why it is the Best SSH / Telnet client to manage your servers remotely on iOS Mobiles (iPhone and IPads) ? 

iSH is a project to get a Linux shell environment running locally on your iOS device, using a usermode x86 emulator.


In other wors iSH is Linux emulator with busybox and a package ports for many of the standard Linux tools you get by simple apt-get / yum or if I have to compare you get via the MobaXterm's advanced apt-cyg (Cygwin packages) tool capabilities.

Once iSH is installed it comes with pre-installed apk command line package management tool, with which you can install stuff like openssh-client / screen / tmux / mc (midnight commander) etc. apk, is an apt like command like tool which uses as a basis for installing its packages Alpine Linux repositories.
Alpine Linux is perhaps little known as it is not one of these main stream disributions, such as Fedora or Ubuntu, but for those more concerned about security  Alpine Linux is well known as it is a security-oriented, lightweight Linux distribution based on musl libc and busybox. What makes the Linux even more attractive and perhaps the reason why the iSH developers decided to use it as a basis for their iSH emulator is it being actively developed and its tightened security makes it a good compliment to the quite closed and security focused mobile platform iOS.

iSH is available straight from AppStore , so to use it install it and run it (it is really a great news that iOS does not require iphone to be jailbreak – ed, and it is an ordinary installable software straight from AppStore):
iSH, already comes with some of the standard programs you would expect in a Linux environment such as Vi, wget, zip / unzip, and tar.
However to fit it better for my use over ssh and improve its capabilities, as well as support and use multiple Virtual windows ssh, just like you do on a Linux xterm
run from ish shell: 

# apk add openssh-client
# apk add screen
# apk add vim
# apk add mc


ish-screenshot-terminal3-linux-emulator-iphone-alpine

ish-screenshot-terminal2-linux-emulator-iphone-alpine

ish-screenshot-terminal1-linux-emulator-iphone-alpine-linux

I also like to have a Midnight Commander and VIM Text editor installed out of the box to be able to move around in Ncurses interface through my iPhone.

ish-iphone-keyboard-key-shortcuts

Note that, just like most GNU / Linux distributions, iOS shell will run a normal bash shell.
From there on to use iSH as my default SSH client and enable my just installed GNU screen some Windowing beauty for readability whence I use the screen with multiple ssh logins to different servers as well make the screen Virtual consoles to have ability for scroll back and scroll up of console text to work, I do set up the following .screenrc inside my /home/iPhoneuser

The .screenrc to setup on the iSH to easify your work with screen is as follows:
 

# An alternative hardstatus to display a bar at the bottom listing the
# windownames and highlighting the current windowname in blue. (This is only
# enabled if there is no hardstatus setting for your terminal)
hardstatus on
hardstatus alwayslastline
hardstatus string "%{.bW}%-w%{.rW}%n %t%{-}%+w %=%{..G} %H %{..Y} %m/%d %C%a "
# Enable scrolling fix the annoying screen scrolling problem
termcapinfo xterm* ti@:te@
# Scroll up
bindkey -d "^[[5S" eval copy "stuff 5\025"
bindkey -m "^[[5S" stuff 5\025

# Scroll down
bindkey -d "^[[5T" eval copy "stuff 5\004"
bindkey -m "^[[5T" stuff 5\004

# Scroll up more
bindkey -d "^[[25S" eval copy "stuff \025"
bindkey -m "^[[25S" stuff \025

# Scroll down more
bindkey -d "^[[25T" eval copy "stuff \004"
bindkey -m "^[[25T" stuff \004

You can download the same .screenrc file from here straight with wget from the console:

# wget https://www.pc-freak.net/files/.screenrc


Run GNU screen manager


 # screen

You will end up with a screen session, to open a new session for Virtual Terminal use virtual keyboard from ISH and Press

CTRL + A + C

To open other Virtual Windows inside screen just press CTRL + A + C as many times as you need it, each session will appear ina small window on the down corner as you can see in screenshot

ish-terminal-with-screen-multiple-virtual-terminals-screenshot-iphone-ios

To move across the Screen unnamed 3 Virtual Windows 0 ash 1 ash and 2 ash use the Virtual keyboard

for next WIndow use key combination:
 

CTRL + A + N (where + is just to indicate you have to press them once after another and not actually press the + 🙂 )


For Previous Window use:

CTRL + A + P

Or use CTRL + A and type 

:number 3 (where number is the number of window)

The available iSH commands without adding any further packages which are part of the busybox install are as follows:

Available /bin/ directory commands:

arch  ash  base64  bbconfig  busybox  cat  chgrp  chmod  chown  conspy  cp  date  dd  df  dmesg  dnsdomainname  dumpkmap  echo  ed  egrep  false  fatattr  fdflush  fgrep  fsync  getopt  grep  gunzip  gzip  hostname  ionice  iostat  ipcalc  kbd_mode  kill  link  linux32  linux64  ln  login  ls  lzop  makemime  mkdir  mknod  mktemp  more  mount  mountpoint  mpstat  mv  netstat  nice  pidof  ping  ping6  pipe_progress  printenv  ps  pwd  reformime  rev  rm  rmdir  run-parts  sed  setpriv  setserial  sh  sleep  stty  su  sync  tar  touch  true  umount  uname  usleep  watch  zcat  


Available /usr/bin/ commands:    

awk  basename  beep  blkdiscard  bunzip2  bzcat  bzip2  cal  chvt  cksum  clear  cmp  comm  cpio  crontab  cryptpw  cut  dc  deallocvt  diff  dirname  dos2unix  du  dumpleases  eject  env  expand  expr  factor  fallocate  find  flock  fold  free  fuser  getconf  getent  groups  hd  head  hexdump  hostid  iconv  id  install  ipcrm  ipcs  killall  ldd  less  logger  lsof  lsusb  lzcat  lzma  lzopcat  md5sum  mesg  microcom  mkfifo  mkpasswd  nc  nl  nmeter  nohup  nproc  nsenter  nslookup  od  passwd  paste  patch  pgrep  pkill  pmap  printf  pscan  pstree  pwdx  readlink  realpath  renice  reset  resize  scanelf  seq  setkeycodes  setsid  sha1sum  sha256sum  sha3sum  sha512sum  showkey  shred  shuf  smemcap  sort  split  ssl_client  strings  sum  tac  tail  tee  test  time  timeout  top  tr  traceroute  traceroute6  truncate  tty  ttysize  udhcpc6  unexpand  uniq  unix2dos  unlink  unlzma  unlzop  unshare  unxz  unzip  uptime  uudecode  uuencode  vi  vlock  volname  wc  wget  which  whoami  whois  xargs  xxd  xzcat  yes  


If you're a maniac developer you can even use iSH, to do some programs development with vim with Python / Perl or PHP as these are available from the Alpine repositories and installable via a simple apk add packagename for security experts nmap and some security tools are also available but unfortunately not everything is still working as this project is in active development and iOS has some security limitations if OS is not ROOTED 🙂

Hence some of the packages you can install via apk manager will be failing actually.
There is a list of What works and what doesn't still on iSH on the project github wiki check it out here.

There is much more funny stuff you can do with it, and actually my quick research on how people use iSH on their phones lead me to some Videos talking about iOS and Ethical hacking etc, but I'll stop here as I dont have the time to dig deeper to it. 
If you know or have some good use of iSH or some other goody you are using as a hack please share in comments.

Enjoy ! 🙂

How to dump and restore Zabbix database to do monitoring database snapshot, PostGreSQL continuous archiving Point in time recovery setup

Monday, November 21st, 2022

postgresql-db-backup-and-continuous-archiving-on-linux-keep-zabbix-backup-regularly

If you have set up a Zabbix server that is using as a database storage postgresql at home or company, then you will need to make sure you don’t loose any data by producing regular postgresql backups. This small article will show how to do the db backup in conventional way with pg_dump / pg_restore as well as how to set the continuous archiving point in time recovery end point recovery so called PITR..
 

1. Connect to the database and some postgres very basics

-bash-4.2$ psql DBNAME USERNAME
 
-bash-4.2$ psql zabbix zabbix
 

After you access a PostgreSQL database, you can run SQL queries and more. Here are some common psql commands:
 
•    To view help for psql commands, type \?.
•    To view help for SQL commands, type \h.
•    To view information about the current database connection, type \conninfo.
•    To list the database's tables and their respective owners, type \dt.
•    To list all of the tables, views, and sequences in the database, type \z.
•    To exit the psql program, type \q.

       Fundamental backup approaches with postgres

As with everything that contains valuable data, PostgreSQL databases should be backed up regularly. While the procedure is essentially simple, it is important to have a clear understanding of the underlying techniques and assumptions.
 
There are three fundamentally different approaches to backing up PostgreSQL data:
 
•    SQL dump
•    File system level backup
•    Continuous archiving

 
Each has its own strengths and weaknesses; each is discussed in turn in the following sections.
 

2.    Creating SQL Dump of postgresql target database

2.1 Manual SQL dump (custom dump format)

 
Use pg_dump's custom dump format. If PostgreSQL was built on a system with the zlib compression library installed, the custom dump format will compress data as it writes it to the output file.
This will produce dump file sizes similar to using gzip, but it has the added advantage that tables can be restored selectively.
The following command dumps a database using the custom dump format:
 

# sudo su – postgres
-bash-4.2% cd  /var/lib/pgsql/9.5/backups/
 
-bash-4.2$  pg_dump -Fc zabbix > /var/lib/pgsql/9.5/backups/zabbixdbdump`date "+%d%m%y%H%M%S"`.gz

2.2 Schedule backups with cron job

To automate the job schedule a cron job to do the work, somethjing like below:
 

# Minute   Hour   Day of Month       Month          Day of Week        Command
# (0-59)  (0-23)     (1-31)    (1-12 or Jan-Dec)  (0-6 or Sun-Sat)

 
@daily  pg_dump -Fc zabbix > /var/lib/pgsql/9.5/backups/Zabbix_db_dump`date "+\%d\%m\%y\%H\%M\%S"`.gz

3. Restore a database from the dump file

3.1. Restoring a database using pg_restore (usually used)

A custom-format dump is not a script for psql, but instead must be restored with pg_restore, for example:
 

# pg_restore -d zabbix /var/lib/pgsql/9.5/backups/Zabbix_db_dump281118151005.gz

3.2. Second Option restoing with psql after creating a restore database

 
# su postgres

-bash-4.2$ psql template1
 
CREATE DATABASE zabbix OWNER zabbix ENCODING 'UTF8';
\q

-bash-4.2$ psql zabbix < /var/lib/pgsql/9.5/backups/zabbixdbdump291117151002.gz
exit

 
NOTE: if you get a permission denied error when trying to restore, check the Unix permissions on the backup file and all the parent directories.

4.    Continuous Archiving and Point-in-Time Recovery (PITR) backups

At all times, PostgreSQL maintains a write ahead log (WAL) in the pg_xlog/ subdirectory of the cluster's data directory. The log records every change made to the database's data files. This log exists primarily for crash-safety purposes: if the system crashes, the database can be restored to consistency by "replaying" the log entries made since the last checkpoint. However, the existence of the log makes it possible to use a third strategy for backing up databases: we can combine a file-system-level backup with backup of the WAL files. If recovery is needed, we restore the file system backup and then replay from the backed-up WAL files to bring the system to a current state. This approach is more complex to administer than either of the previous approaches, but it has some significant benefits:

           Setting Up the WAL Archiving

In an abstract sense, a running PostgreSQL system produces an indefinitely long sequence of WAL records. The system physically divides this sequence into WAL segment files, which are normally 16MB a piece (although the segment size can be altered when building PostgreSQL). The segment files are given numeric names that reflect their position in the abstract WAL sequence. When not using WAL archiving, the system normally creates just a few segment files and then "recycles" them by renaming no-longer-needed segment files to higher segment numbers. It's assumed that segment files whose contents precede the checkpoint-before-last are no longer of interest and can be recycled.
 
When archiving WAL data, we need to capture the contents of each segment file once it is filled, and save that data somewhere before the segment file is recycled for reuse.
Depending on the application and the available hardware, there could be many different ways of "saving the data somewhere": we could copy the segment files to an NFS-mounted directory on another machine, write them onto a tape drive (ensuring that you have a way of identifying the original name of each file), or batch them together and burn them onto CDs, or something else entirely. To provide the database administrator with flexibility, PostgreSQL tries not to make any assumptions about how the archiving will be done. Instead, PostgreSQL lets the administrator specify a shell command to be executed to copy a completed segment file to wherever it needs to go. The command could be as simple as a cp, or it could invoke a complex shell script — it's all up to you.
 
To enable WAL archiving, set the wal_level configuration parameter to archive or higher, archive_mode to on, and specify the shell command to use in the archive_command configuration parameter.

In practice these settings will always be placed in the postgresql.conf e.g. (/etc/postgresql/12/main/postgresql.conf) file.

In archive_command, %p is replaced by the path name of the file to archive, while %f is replaced by only the file name. (The path name is relative to the current working directory, i.e., the cluster's data directory.)

Use %% if you need to embed an actual % character in the command.

The simplest useful command to enable PITR would, be something like:
 

# – Archiving config setction
 
archive_mode = on                    # enables archiving; off, on, or always
# (change requires restart)
 
archive_command = '/bin/xz -2 -z < %p > /var/lib/pgsql/9.5/archivedir/%f'               # command to use to archive a logfile segment
 
archive_timeout = 1h            # force a logfile segment switch after this
                                                   # number of seconds; 0 disables

Howto convert KVM QCOW2 format Virtual Machine to Vmdk to migrate to VMware ESXi

Thursday, November 17th, 2022

qcow2-to-vmdkvk-convert-to-complete-linux-kvm-to-vmware-esxi-migration

Why you would want to convert qcow2 to vmdk?

When managing the heterogeneous virtual environment or changing the virtualization solutions that become so common nowadays, you might need to migrate qcow2 from a Linux based KVM virtualization solution to VMWare's proprietary  vmdk – the file format in which a VMWare does keep stored it's VMs, especially if you have a small business or work in a small start-up company where you cannot afford to buy something professional as VMware vCenter Converter Standalone or Microsoft virtual machine converter (MVMC)- usually used to to migrate VMware hosts to Hyper-V hosts, but also capable to migrate .qcow2 to .vmdk. The reason is that your old datacenter based on Linux OS custom KVM virtual machines might be moved to VMWare ESX to guarantee better and more systemized management (which though is very questionable, since most of my experiences with VMWare was that though the software was a great one, the people who manage it was not very much specialists in managing it).

Another common reason is that running a separate Linux virtual machine, costs you more than a well organized VMWare farm because you need more qualified Linux specialists to manage the KVMs thus KVM to VMWare management as in most big corporations nowadays’s main target is to cut the costs.
Even with successful migrations like that, though you might often expect a drop in the quality of the service when your VM ends in the VMWare farm.

Nomatter what’s the reason to migrate qcow2 to VMDK So lets proceed with how the .QCOW2 to .VMDK can be easily done.


1. Get information about the VM you would like to migrate to VMDK

In QEMU-KVM environment, the popular image format is qcow2, which outperforms the first generation of qcow format and raw format. You can find the files of virtual disks by checking the information of virtual machine by virsh command:

[root@hypervisor-machine ~]# virsh dominfo virtual-machine-name

INFO
ID: {e59ae416-9314-4e4b-af07-21c31d91b3fb}
EnvID: 1704649750
Name: CentOS7minimal
Description:
Type: VM
State: stopped
OS: centos7
Template: no
Uptime: 00:00:00 (since 2019-04-25 13:04:11)
Home: /vz/vmprivate/e39ae416-9314-4e4b-af05-21c31d91b3fb/
Owner: root@.
GuestTools: state=not_installed
GuestTools autoupdate: on
Autostart: off
Autostop: shutdown
Autocompact: off
Boot order: hdd0 cdrom0
EFI boot: off
Allow select boot device: off
External boot device:
On guest crash: restart
Remote display: mode=manual port=6903 address=0.0.0.0
Remote display state: stopped
Hardware:
  cpu sockets=1 cpus=2 cores=2 VT-x accl=high mode=64 ioprio=4 iolimit='0'
  memory 2048Mb
  video 32Mb 3d acceleration=off vertical sync=yes
  memory_guarantee auto
  hdd0 (+) scsi:0 image='/vz/vmprivate/e59ae415-9314-4e4b-af05-21c31d91b3fb/harddisk.hdd' type='expanded' 5120Mb subtype=virtio-scsi
  cdrom0 (+) scsi:1 image='/home/CentOS-7-x86_64-Minimal-1611.iso' state=disconnected subtype=virtio-scsi
  usb (+)
  net0 (+) dev='vme42bef5f3' network='Bridged' mac=001C42BEF5F3 card=virtio ips='10.50.50.27/255.255.255.192 ' gw='10.50.50.1'
SmartMount: (-)
Disabled Windows logo: on
Nested virtualization: off
Offline management: (-)
Hostname: kvmhost.fqdn.com


2. Convert the harddrive to VMDK

[root@hypervisor-machine e59ae415-9314-4e4b-af05-21c31d91b3fb]# ls -lsah

1.3G -rw-r—– 1 root root 1.3G Apr 25 14:43 harddisk.hdd

a. Converstion with qemu:

You can use qemu-img tool that is installable via cmds:

yum install quemu-img / apt install qemu-img / zipper install qemu-img (depending on the distribution RedHat / Debian / SuSE Linux)

-f: format of the source image

-O: format of the target image

[root@hypervisor-machine ~]# qemu-img convert -f qcow2 -O vmdk \-o adapter_type=lsilogic,subformat=streamOptimized,compat6 harddisk.hdd harddisklsilogic.vmdk


[root@ hypervisor-machine e59ae415-9314-4e4b-af05-21c31d91b3fb]# ls -lsah

1.3G -rw-r—– 1 root root 1.3G Apr 25 14:43 harddisk.hdd

536M -rw-r–r– 1 root root 536M Apr 26 14:52 harddisklsilogic.vmdk

3. Upload the new harddrive to the ESXi Hypervisor and adapt it to ESX

This vmdk might not be able to used on ESXi, but you can use it on VMware Workstation. To let it work on ESXi, you need to use vmkfstools to convert it again.


a. Adapt the filesystem to ESXi

[root@hypervisor-machine ~]# vmkfstools -i harddisklsilogic.vmdk  -d thin harddisk.vmdk


4. Create a VM and add the converted harddrive to the machine. 

Futher

Recreate the initramfs

But of course this won’t work directly as it often happens with Linux 🙂 !!. 
We need to make adjustments to the virtual machine as well with few manual interventions:

1. Start the machine from the VMWare interface

2. Grub CentOS Linux rescue will appear from the prompt

3. Run command

dracut –regenerate-all –force


to Recreate the initramfs.
 

Note that You might also have to edit your network configuration since your network device usually get’s a different name.
 

Finally reboot the host:

[root@hypervisor-machine ~]# reboot


And voila you’re ready to play the VM inside the ESX after some testing, you might switch off the KVM Hypervisor hosted VM and reroute the network to point to the ESX Cluster.


How to check if network ethernet cards are active on Linux server / detect the physical connected state of a network cable / connector?

Tuesday, November 1st, 2022

linux-check-connectivity-interface-software-implementation-of-multi-queue-support-in-Linux-using-commodity-Ethernet-NICs

Lets say you are administrating some Linux server and need to upgrade a switch and temporary move out traffic for ethernet interfaces connected via a Gigabit network to a Gigabit Cisco / Junper EX Series / HPE Aruba or Arista Platform network switch to a newer version of a switch or software.

Usually if you don't have control over the Network switch (if you're employeed in a large corporation), that migration will be handled by a colleague from the Network team in a prescheduled time slot and usually in a coordinated meeting, once the cabling is being physically moved by someone a person in the Computer Room (in DC) in the respective data center.

Then once the correct commands are executed on the network switch to remap the new cable to point to the right location on the Linux server, where the old switch was and the setup has to be double verified by the network team mate.

Once this is done either by a colleague or if you're in a smaller company and you work as one man army sysadmin and you have done it yourself.
Next step is to verify that the Ethernet LAN cards on the Linux server lets say 6 or 8 LAN cards are still connected and active to the preset Active LAN / VLANs.

On Linux this is pretty simple and there is many ways to do it with external tools like ethtool, if you're lucky and your server doesn't have to have a paranoid security rules to follow or have to be a minimilastic machine with a 100% PCI High security standards compliancy.

To check connectivity for all your ethernet interfaces you can simply run a one liner shell script like so:

[root@linux-server ~]# for i in $(ip a s|grep -i :|grep -v link|awk '{ print $2 }'|sed -e 's#:##g'|grep -v lo); do ethtool $i; done
Settings for eth0:
        Link detected: yes
Settings for eth1:
        Link detected: yes
Settings for eth2:
        Link detected: yes

So far so good but what if your RHEL / CentOS / Debian server doesn't have ethtool installed and you're not allowed to install it then how can you check whether network cable connector is indicating a network activity to the connected Ethernet LAN cards?

[root@linux-server ~]# for f in $(ls -1 /sys/class/net/); do echo "Eth inface: $f"; cat /sys/class/net/$f/operstate; done
Eth inface: eth0
up
Eth inface: eth1
up
Eth inface: eth2
up
Eth inface: lo
unknown

If your operstate returns something different like state unknown, e.g.:

root@linux-server ~]# cd /sys/class/net/
[root@linux-server net]# grep "" eth2/operstate
unknown
[root@linux-server net]#

[root@linux-server net]# grep "" eth{0,1,2,3}/operstate  
eth0/operstate:unknown
eth1/operstate:unknown
eth2/operstate:unknown
eth3/operstate:unknown

Then you need to check the carrier file

[root@linux-server net]# grep "" eth{0,1,2,3}/carrier
eth0/carrier:1
eth1/carrier:1
eth2/carrier:1
eth3/carrier:1

It could return either 0 or 1

The number 1 in the above output means that the network cable is physically connected to your network card’s slot meaning your network switch migration is success.

Method 2: Next, we will test a second network interface eth1:

[root@linux-server net]# cat /sys/class/net/eth1/carrier
[root@linux-server net]# cat: /sys/class/net/eth1/carrier: Invalid argument

This command’s output most likely means the the eth1 network interface is in powered down state.

So what have learned?

We have learned how to monitor the state of the network cable connected to a Linux ethernet device via external switch that is migrated without the use of any external tools like ethtool.

Migration of audit messages from snoopy to auditd

Tuesday, April 20th, 2010

his article may be out of date and may be deleted in the future.

This article explains the migration from the previous service "Snoopy" to "Auditd". Only commands that are executed as a user with root rights should be recorded here.


Uninstall/disable snoopy
 

Configuration of auditd

Files needed
Auditd start/stop script

/etc/init.d/auditd

Rules for monitoring by auditd

/etc/audit/audit.rules

Auditd plugin for syslog service

/etc/audisp/plugins.d/syslog.conf

Edit the /etc/audit/audit.rules file
Auditd can be specifically configured to capture and exclude messages. The following list is helpful for excluding certain event entries ("msgtype"):

* 1000 – 1099 are for commanding the audit system
* 1100 – 1199 user space trusted application messages
* 1200 – 1299 messages internal to the audit daemon
* 1300 – 1399 audit event messages
* 1400 – 1499 kernel SE Linux use
* 1500 – 1599 AppArmor events
* 1600 – 1699 kernel crypto events
* 1700 – 1799 kernel abnormal records
* 1800 – 1999 future kernel use (maybe integrity labels and related events)
* 2001 – 2099 unused (kernel)
* 2100 – 2199 user space anomaly records
* 2200 – 2299 user space actions taken in response to anomalies
* 2300 – 2399 user space generated LSPP events
* 2400 – 2499 user space crypto events
* 2500 – 2999 future user space (maybe integrity labels and related events)

Adding the rules

In order for auditd to record the desired events, rules must be defined.

List of rules set up
Below is a list and explanation of the rules set up:

-a exclude,always -F msgtype>=2400 -F msgtype<=2499
-a exclude,always -F msgtype=PATH
-a exclude,always -F msgtype=CWD
-a exclude,always -F msgtype=EOE
-a exit,always -F arch=b64 -F auid!=0 -F auid!=4294967295 -S execve
-a exit,always -F arch=b32 -F auid!=0 -F auid!=4294967295 -S execve

The first rule excludes crypto events in user space – these include, for example, messages about a user logging in.
The second through fourth rules remove the information not necessary for monitoring before it is logged.
The fifth and sixth rules capture the commands entered by users moving within an interactive shell. Services etc. executed by the system are therefore not recorded.
It should be noted here that a separate rule must be created for systems that contain both 32- and 64-bit commands and libraries.

Rule syntax

In general, it makes sense to keep the number of existing rules low in order to reduce the load. Therefore, if possible, several rule fields (-F option) should be combined in one rule. Since Auditd obviously has a problem with multiple event entries that are defined in plain text, these have been created in individual rules. The syntax description of the individual rules is given in the next listing:

-a contains the instructions
The action value "exclude" and the list value "always" are specified for rules that should not lead to any log entry
The action values ​​"exit" and "always" have been specified for rules that should lead to a log entry
"exit" stands for a log entry after the command has been executed
-F defines a rules field
Depending on the application, the rules defined here filter by event entry ("msgtype"), architecture ("arch") and login UID ("auid").
-S stands for the syscall. In the rules that should lead to a log entry, the value "execve" is monitored – i.e. when commands are executed.

Redirect to syslog

Within the file /etc/audisp/plugins.d/syslog.conf the value

active = no
on

active = yes
set.

restart auditd with the command

/etc/init.d/auditd restart
the settings are accepted.

Additional information

The following man pages can be consulted for more information:

auditctl
audit.rules
auditd
auditd.conf