Posts Tagged ‘cron’

Install and enable Sysstats IO / DIsk / CPU / Network monitoring console suite on Redhat 8.3, Few sar useful command examples

Tuesday, September 28th, 2021

linux-sysstat-monitoring-logo


Why to monitoring CPU, Memory, Hard Disk, Network usage etc. with sysstats tools?
 

Using system monitoring tools such as Zabbix, Nagios Monit is a good approach, however sometimes due to zabbix server interruptions you might not be able to track certain aspects of system performance on time. Thus it is always a good idea to 
Gain more insights on system peroformance from command line. Of course there is cmd tools such as iostat and top, free, vnstat that provides plenty of useful info on system performance issues or bottlenecks. However from my experience to have a better historical data that is systimized and all the time accessible from console it is a great thing to have sysstat package at place. Since many years mostly on every server I administer, I've been using sysstats to monitor what is going on servers over a short time frames and I'm quite happy with it. In current company we're using Redhats and CentOS-es and I had to install sysstats on Redhat 8.3. I've earlier done it multiple times on Debian / Ubuntu Linux and while I've faced on some .deb distributions complications of making sysstat collect statistics I've come with an article on Howto fix sysstat Cannot open /var/log/sysstat/sa no such file or directory” on Debian / Ubuntu Linux
 

Sysstat contains the following tools related to collecting I/O and CPU statistics:
iostat
Displays an overview of CPU utilization, along with I/O statistics for one or more disk drives.
mpstat
Displays more in-depth CPU statistics.
Sysstat also contains tools that collect system resource utilization data and create daily reports based on that data. These tools are:
sadc
Known as the system activity data collector, sadc collects system resource utilization information and writes it to a file.
sar
Producing reports from the files created by sadc, sar reports can be generated interactively or written to a file for more intensive analysis.

My experience with CentOS 7 and Fedora to install sysstat it was pretty straight forward, I just had to install it via yum install sysstat wait for some time and use sar (System Activity Reporter) tool to report collected system activity info stats over time.
Unfortunately it seems on RedHat 8.3 as well as on CentOS 8.XX instaling sysstats does not work out of the box.

To complete a successful installation of it on RHEL 8.3, I had to:

[root@server ~]# yum install -y sysstat


To make sysstat enabled on the system and make it run, I've enabled it in sysstat

[root@server ~]# systemctl enable sysstat


Running immediately sar command, I've faced the shitty error:


Cannot open /var/log/sysstat/sa18:
No such file or directory. Please check if data collecting is enabled”


Once installed I've waited for about 5 minutes hoping, that somehow automatically sysstat would manage it but it didn't.

To solve it, I've had to create additionally file /etc/cron.d/sysstat (weirdly RPM's post install instructions does not tell it to automatically create it)

[root@server ~]# vim /etc/cron.d/sysstat

# run system activity accounting tool every 10 minutes
0 * * * * root /usr/lib64/sa/sa1 60 59 &
# generate a daily summary of process accounting at 23:53
53 23 * * * root /usr/lib64/sa/sa2 -A &


  • /usr/local/lib/sa1 is a shell script that we can use for scheduling cron which will create daily binary log file.
  • /usr/local/lib/sa2 is a shell script will change binary log file to human-readable form.


[root@server ~]# chmod 600 /etc/cron.d/sysstat

[root@server ~]# systemctl restart sysstat


In a while if sysstat is working correctly you should get produced its data history logs inside /var/log/sa

[root@server ~]# ls -al /var/log/sa 


Note that the standard sysstat history files on Debian and other modern .deb based distros such as Debian 10 (in  y.2021) is stored under /var/log/sysstat

Here is few useful uses of sysstat cmds


1. Check with sysstat machine history SWAP and RAM Memory use


To lets say check last 10 minutes SWAP memory use:

[hipo@server yum.repos.d] $ sar -W  |last -n 10
 

Linux 4.18.0-240.el8.x86_64 (server)       09/28/2021      _x86_64_        (8 CPU)

12:00:00 AM  pswpin/s pswpout/s
12:00:01 AM      0.00      0.00
12:01:01 AM      0.00      0.00
12:02:01 AM      0.00      0.00
12:03:01 AM      0.00      0.00
12:04:01 AM      0.00      0.00
12:05:01 AM      0.00      0.00
12:06:01 AM      0.00      0.00

[root@ccnrlb01 ~]# sar -r | tail -n 10
14:00:01        93008   1788832     95.06         0   1357700    725740      9.02    795168    683484        32
14:10:01        78756   1803084     95.81         0   1358780    725740      9.02    827660    652248        16
14:20:01        92844   1788996     95.07         0   1344332    725740      9.02    813912    651620        28
14:30:01        92408   1789432     95.09         0   1344612    725740      9.02    816392    649544        24
14:40:01        91740   1790100     95.12         0   1344876    725740      9.02    816948    649436        36
14:50:01        91688   1790152     95.13         0   1345144    725740      9.02    817136    649448        36
15:00:02        91544   1790296     95.14         0   1345448    725740      9.02    817472    649448        36
15:10:01        91108   1790732     95.16         0   1345724    725740      9.02    817732    649340        36
15:20:01        90844   1790996     95.17         0   1346000    725740      9.02    818016    649332        28
Average:        93473   1788367     95.03         0   1369583    725074      9.02    800965    671266        29


2. Check system load? Are my processes waiting too long to run on the CPU?

[root@server ~ ]# sar -q |head -n 10
Linux 4.18.0-240.el8.x86_64 (server)       09/28/2021      _x86_64_        (8 CPU)

12:00:00 AM   runq-sz  plist-sz   ldavg-1   ldavg-5  ldavg-15   blocked
12:00:01 AM         0       272      0.00      0.02      0.00         0
12:01:01 AM         1       271      0.00      0.02      0.00         0
12:02:01 AM         0       268      0.00      0.01      0.00         0
12:03:01 AM         0       268      0.00      0.00      0.00         0
12:04:01 AM         1       271      0.00      0.00      0.00         0
12:05:01 AM         1       271      0.00      0.00      0.00         0
12:06:01 AM         1       265      0.00      0.00      0.00         0


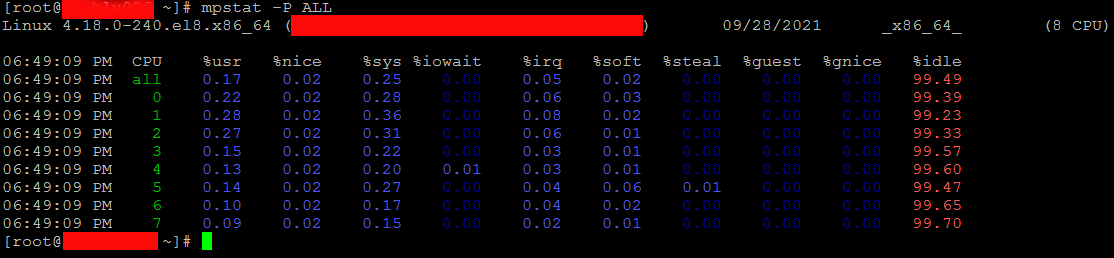
3. Show various CPU statistics per CPU use
 

On a multiprocessor, multi core server sometimes for scripting it is useful to fetch processor per use historic data, 
this can be attained with:


[hipo@server ~ ] $ mpstat -P ALL
Linux 4.18.0-240.el8.x86_64 (server)       09/28/2021      _x86_64_        (8 CPU)

06:08:38 PM  CPU    %usr   %nice    %sys %iowait    %irq   %soft  %steal  %guest  %gnice   %idle
06:08:38 PM  all    0.17    0.02    0.25    0.00    0.05    0.02    0.00    0.00    0.00   99.49
06:08:38 PM    0    0.22    0.02    0.28    0.00    0.06    0.03    0.00    0.00    0.00   99.39
06:08:38 PM    1    0.28    0.02    0.36    0.00    0.08    0.02    0.00    0.00    0.00   99.23
06:08:38 PM    2    0.27    0.02    0.31    0.00    0.06    0.01    0.00    0.00    0.00   99.33
06:08:38 PM    3    0.15    0.02    0.22    0.00    0.03    0.01    0.00    0.00    0.00   99.57
06:08:38 PM    4    0.13    0.02    0.20    0.01    0.03    0.01    0.00    0.00    0.00   99.60
06:08:38 PM    5    0.14    0.02    0.27    0.00    0.04    0.06    0.01    0.00    0.00   99.47
06:08:38 PM    6    0.10    0.02    0.17    0.00    0.04    0.02    0.00    0.00    0.00   99.65
06:08:38 PM    7    0.09    0.02    0.15    0.00    0.02    0.01    0.00    0.00    0.00   99.70


sar-sysstat-cpu-statistics-screenshot

Monitor processes and threads currently being managed by the Linux kernel.

[hipo@server ~ ] $ pidstat

pidstat-various-random-process-statistics

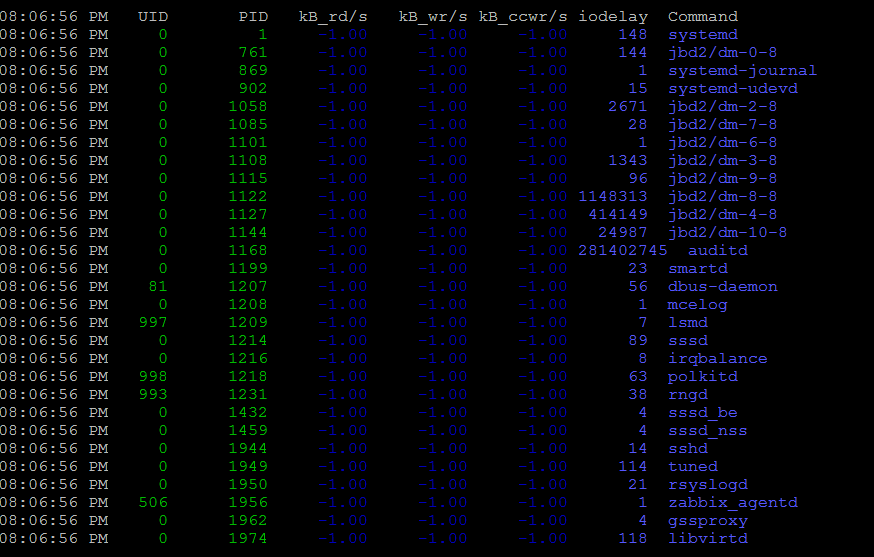
[hipo@server ~ ] $ pidstat -d 2


pidstat-show-processes-with-most-io-activities-linux-screenshot

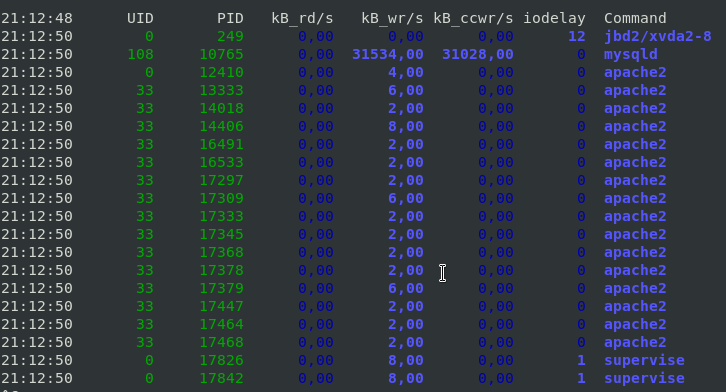
This report tells us that there is few processes with heave I/O use Filesystem system journalling daemon jbd2, apache, mysqld and supervise, in 3rd column you see their respective PID IDs.

To show threads used inside a process (like if you press SHIFT + H) inside Linux top command:

[hipo@server ~ ] $ pidstat -t -p 10765 1 3

Linux 4.19.0-14-amd64 (server)     28.09.2021     _x86_64_    (10 CPU)

21:41:22      UID      TGID       TID    %usr %system  %guest   %wait    %CPU   CPU  Command
21:41:23      108     10765         –    1,98    0,99    0,00    0,00    2,97     1  mysqld
21:41:23      108         –     10765    0,00    0,00    0,00    0,00    0,00     1  |__mysqld
21:41:23      108         –     10768    0,00    0,00    0,00    0,00    0,00     0  |__mysqld
21:41:23      108         –     10771    0,00    0,00    0,00    0,00    0,00     5  |__mysqld
21:41:23      108         –     10784    0,00    0,00    0,00    0,00    0,00     7  |__mysqld
21:41:23      108         –     10785    0,00    0,00    0,00    0,00    0,00     6  |__mysqld
21:41:23      108         –     10786    0,00    0,00    0,00    0,00    0,00     2  |__mysqld

10765 – is the Process ID whose threads you would like to list

With pidstat, you can further monitor processes for memory leaks with:

[hipo@server ~ ] $ pidstat -r 2


4. Report paging statistics for some old period


[root@server ~ ]# sar -B -f /var/log/sa/sa27 |head -n 10
Linux 4.18.0-240.el8.x86_64 (server)       09/27/2021      _x86_64_        (8 CPU)

15:42:26     LINUX RESTART      (8 CPU)

15:55:30     LINUX RESTART      (8 CPU)

04:00:01 PM  pgpgin/s pgpgout/s   fault/s  majflt/s  pgfree/s pgscank/s pgscand/s pgsteal/s    %vmeff
04:01:01 PM      0.00     14.47    629.17      0.00    502.53      0.00      0.00      0.00      0.00
04:02:01 PM      0.00     13.07    553.75      0.00    419.98      0.00      0.00      0.00      0.00
04:03:01 PM      0.00     11.67    548.13      0.00    411.80      0.00      0.00      0.00      0.00


5.  Monitor Received RX and Transmitted TX network traffic perl Network interface real time
 

To print out Received and Send traffic per network interface 4 times in a raw

sar-sysstats-network-traffic-statistics-screenshot
 

[hipo@server ~ ] $ sar -n DEV 1 4


To continusly monitor all network interfaces I/O traffic

[hipo@server ~ ] $ sar -n DEV 1


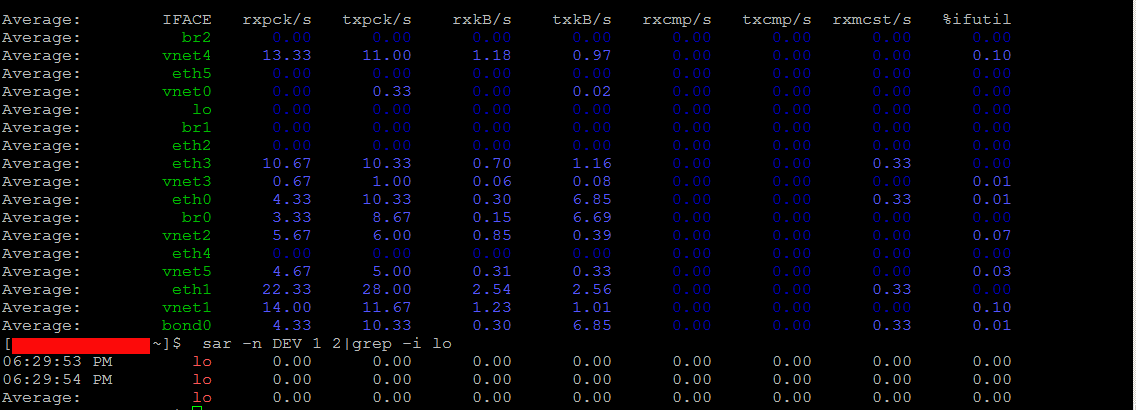
To only monitor a certain network interface lets say loopback interface (127.0.0.1) received / transmitted bytes

[hipo@server yum.repos.d] $  sar -n DEV 1 2|grep -i lo
06:29:53 PM        lo      0.00      0.00      0.00      0.00      0.00      0.00      0.00      0.00
06:29:54 PM        lo      0.00      0.00      0.00      0.00      0.00      0.00      0.00      0.00
Average:           lo      0.00      0.00      0.00      0.00      0.00      0.00      0.00      0.00


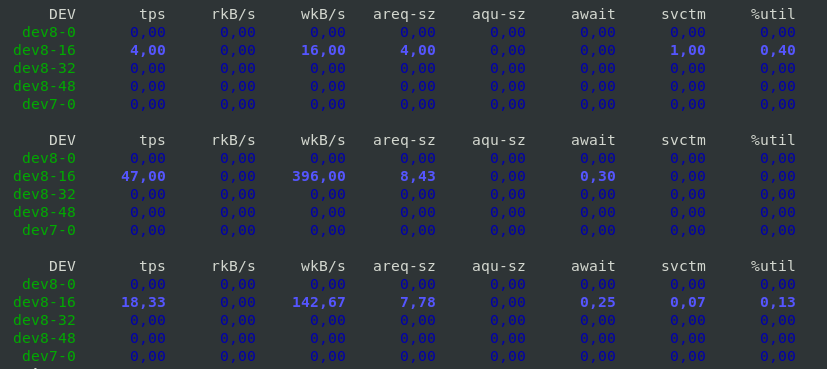
6. Monitor block devices use
 

To check block devices use 3 times in a raw
 

[hipo@server yum.repos.d] $ sar -d 1 3


sar-sysstats-blockdevice-statistics-screenshot
 

7. Output server monitoring data in CSV database structured format


For preparing a nice graphs with Excel from CSV strucuted file format, you can dump the collected data as so:

 [root@server yum.repos.d]# sadf -d /var/log/sa/sa27 — -n DEV | grep -v lo|head -n 10
server-name-fqdn;-1;2021-09-27 13:42:26 UTC;LINUX-RESTART    (8 CPU)
# hostname;interval;timestamp;IFACE;rxpck/s;txpck/s;rxkB/s;txkB/s;rxcmp/s;txcmp/s;rxmcst/s;%ifutil
server-name-fqdn;-1;2021-09-27 13:55:30 UTC;LINUX-RESTART    (8 CPU)
# hostname;interval;timestamp;IFACE;rxpck/s;txpck/s;rxkB/s;txkB/s;rxcmp/s;txcmp/s;rxmcst/s;%ifutil
server-name-fqdn;60;2021-09-27 14:01:01 UTC;eth1;19.42;16.12;1.94;1.68;0.00;0.00;0.00;0.00
server-name-fqdn;60;2021-09-27 14:01:01 UTC;eth0;7.18;9.65;0.55;0.78;0.00;0.00;0.00;0.00
server-name-fqdn;60;2021-09-27 14:01:01 UTC;eth2;5.65;5.13;0.42;0.39;0.00;0.00;0.00;0.00
server-name-fqdn;60;2021-09-27 14:02:01 UTC;eth1;18.90;15.55;1.89;1.60;0.00;0.00;0.00;0.00
server-name-fqdn;60;2021-09-27 14:02:01 UTC;eth0;7.15;9.63;0.55;0.74;0.00;0.00;0.00;0.00
server-name-fqdn;60;2021-09-27 14:02:01 UTC;eth2;5.67;5.15;0.42;0.39;0.00;0.00;0.00;0.00

To graph the output data you can use Excel / LibreOffice's Excel equivalent Calc or if you need to dump a CSV sar output and generate it on the fly from a script  use gnuplot 


What we've learned?


How to install and enable on cron sysstats on Redhat and CentOS 8 Linux ? 
How to continuously monitor CPU / Disk and Network, block devices, paging use and processes and threads used by the kernel per process ?  
As well as how to export previously collected data to CSV to import to database or for later use inrder to generate graphic presentation of data.
Cheers ! 🙂


Stop haproxy log requests to /var/log/messages / Disable haproxy double logging

Friday, June 25th, 2021

haproxy-logo

On a CentOS Linux release 7.9.2009 (Core) I've running haproxies on two KVM virtual machines that are configured in a High Avaialability cluster with Corosync and Pacemaker, the machines are inherited from another admin (I did not install the servers hardware) and OS but have been received the system for support.
The old sysadmins seems to not care much about the system so they've left the haprxoy with Double logging one time under separate configured log in /var/log/haproxy/haproxyprod.log and each Haproxy TCP mode flown request has been double logged to /var/log/messages as well. As you can guess this shouldn't be so because we're wasting Hard drive space so to fix that I had to stop haproxy doble logging to /var/log/messages.

The logging is done under a separate local pointer local6 the /etc/haproxy/haproxyprod.cfg goes as follows:
 

[root@haproxy01 ~]# cat /etc/haproxy/haproxyprod.cfg

global
    # log <address> [len ] [max level [min level]]
    log 127.0.0.1 local6 debug


The logging is handled by rsyslog via the local6, so obviously to keep out the logging from /var/log/messages
The logging to the separate log file configuration in rsyslog is as follows:

local6.*                                                /var/log/haproxy/haproxyprod.log

It turned to be really easy to prevent haproxy get its requests log to /var/log/messages all I had to change is under /etc/rsyslogd.conf

local6.none config has to be placed for /var/log/messages the full line configuration in /etc/rsyslog.conf that stopped double logging is:

# Don't log private authentication messages!
*.info;mail.none;authpriv.none;cron.none;local5.none;local6.none                /var/log/messages


Get daily E-Mail Reports statistics on postfix Linux mail server

Tuesday, July 14th, 2020

https://www.pc-freak.net/images/Postfix-email-server-logo.svg-1

I've had today a task at work to monitor a postfix mail send and received emails (MAIL FROM / RPCT TO) and get out a simple statistics on what kind of emails are coming and going out from the Postfix SMTP on a server?

Below is shortly explained how I did it plus you will learn how you can use something more advanced to get server mail count, delivery status, errors etc. daily.
 

1. Using a simple script to process /var/log/messages

For that I made a small script to do the trick, the script simply checks mail delivery logged information from /var/log/maillog process a bit sort and logs in a separate log daily.

#!/bin/sh
# Process /var/log/maillog extract from= and to= mails sort
# And log mails to $LOGF
# Author Georgi Georgiev 14.07.2020

DATE_FORM=$(date +'%m_%d_%y_%H_%M_%S_%h_%m');
LOG='/home/gge/mail_from_to-mails';
LOGF="$LOG.$DATE_FORM.log";
CUR_DATE=$(date +'%m_%d_%y_%T');
echo "Processing /var/log/maillog";
echo "Processing /var/log/maillog" > $LOGF;
echo >>$LOGF
echo "!!! $CUR_DATE # Sent MAIL FROM: addresses: !!!" >> $LOGF;
grep -E 'from=' /var/log/maillog|sed -e 's#=# #g'|awk '{ print $8 }'|sed -e 's#<# #g' -e 's#># #g' -e 's#\,##'|sort -rn|uniq >> $LOGF;

echo "!!! $CUR_DATE # Receive RCPT TO: addresses !!!" >>$LOGF;
grep -E 'to=' /var/log/maillog|sed -e 's#=# #g'|awk '{ print $8 }'|sed -e 's#<# #g' -e 's#># #g' -e 's#\,##'|sort -rn|uniq >> $LOGF;


You can get a copy of the mail_from_to_collect_mails_postfix.sh script here.

I've set the script to run via a crond scheduled job once early in the mornthing and I'll leave it like that for 5 days or so to get a good idea on what are the mailboxes that are receiving incoming mail.

The cron I've set to use is as follows:

# crontab -u root -l 
05 03 * * *     sh /home/gge/mail_from_to.sh >/dev/null 2>&1


This will be necessery later for a Email Server planned migration to relay its mail via another MTA host.


2. Getting More Robust Postifx Mail Statistics from logs


My little script is of course far from best solution to get postfix mail statistics from logs.

If you want something more professional and you need to have a daily report on what mails sent to mail server and mails sent from the MTA to give you information about the Email delivery queue status, number of successful and failed emails from a mail sender / recipient and a whole bunch of useful info you can use something more advanced such as pflogsumm perl script to get daily / weekly monthly mail delivery statistics.

What can pflogsumm do for you ?


Pflogsumm is a log analyzer/summarizer for the Postfix MTA. It is
designed to provide an overview of Postfix activity, with just enough
detail to give the administrator a “heads up” for potential trouble
spots and fixing any SMTP and email related issues.

Pflogsumm generates summaries and, in some cases, detailed reports of
mail server traffic volumes rejected and bounced email and server
warnings, errors, and panics.

At the time of writting this article it is living on jimsun.linxnet.com just in case if pflogsumm.pl's official download location disappears at some time in future here is pflogsumm-1.1.3.tar.gz mirror stored on www.pc-freak.net

– Install pflogsumm

Use of pflogsumm is pretty straight forward, you download unarchive the script to some location such as /usr/local/bin/pflogsumm.pl  add the script executable flag and you run it to create a Postfix Mail Log statistics report for you

wget http://jimsun.linxnet.com/downloads/pflogsumm-1.1.3.tar.gz -O /usr/local/src/pflogsumm-1.1.3.tar.gz


# mkdir -p /usr/local/src/
# cd /usr/local/src/
# tar -zxvf pflogsumm-1.1.3.tar.gz
# cd pflogsumm-1.1.3/

# mv /usr/local/pflogsumm-1.1.3/pflogsumm.pl /usr/local/bin/pflogsumm
# chmod a+x /usr/local/bin/pflogsumm


That's all, assuming you have perl installed on the system with some standard modules, we're now good to go: 

To give it a test report to the command line:

# /usr/local/bin/pflogsumm -d today /var/log/maillog

pflogsumm-log-summary-screenshot-linux-received-forwarded-bounced-rejected

To generate mail server use report and launch to some email of choice do:

# /usr/local/bin/pflogsumm -d today /var/log/maillog | mail -s Mailstats your-mail@your-domain.com


To make pflogsumm report everyday various interesting stuff such as (message deferrals, message bounce, details, smtp delivery failures, fatal errors, recipients by message size etc. add some cronjob like below to the server:

# /usr/sbin/pflogsumm -d yesterday /var/log/maillog | mail -s Mailstats | mail -s Mailstats your-mail@your-domain.com

If you need a GUI graphical mail monitoring in a Web Browser, you will need to install a webserver with a perl / cgi support,  RRDTools and MailGraph.

linux-monitoring-mail-server-with-mailgraph.cgi

How to get rid of “PHP Warning: PHP Startup: Unable to load dynamic library ‘/usr/lib/php5/20090626/suhosin.so'” on Debian GNU / Linux

Tuesday, October 25th, 2011

PHP-warning-how-to-fix-warnings-and-errors-php-logo

After a recent new Debian Squeeze Apache+PHP server install and moving a website from another server host running on CentOS 5.7 Linux server, some of the PHP scripts running via crontab started displaying the following annoying PHP Warnings :

debian:~# php /home/website/www/cron/update.php

PHP Warning: PHP Startup: Unable to load dynamic library '/usr/lib/php5/20090626/suhosin.so' – /usr/lib/php5/20090626/suhosin.so: cannot open shared object file: No such file or directory in Unknown on line 0

Obviously the error revealed that PHP cli is not happy that, I've previously removes the suhosin php5-suhosin module from the system.
I wouldn't have removed php5-suhosin if sometimes it doesn't produced some odd experiences with the Apache webserver.
To fix the PHP Warning, I used first grep to see, where exactly the suhosin module gets included in debian's php.ini config files. debian:~# cd /etc/php5
debian:/etc/php5# grep -rli suhosin *
apache2/conf.d/suhosin.ini
cgi/conf.d/suhosin.ini
cli/conf.d/suhosin.ini
conf.d/suhosin.ini

Yeah that's right Debian has three php.ini php config files. One for the php cli/usr/bin/php, another for the Apache webserver loaded php library/usr/lib/apache2/modules/libphp5.so and one for Apache's cgi module/usr/lib/apache2/modules/mod_fcgid.so .

I was too lazy to edit all the above found declarations trying to include the suhosin module in PHP, hence I remembered that probably all this obsolete suhosin module declaration are still present because probably the php5-suhosin package is still not purged from the system.

A quick check with dpkg , further strenthened my assumption as the php5-suhosin module was still hanging around as an (rc – remove candidate);

debian:~# dpkg -l |grep -i suhosin
rc php5-suhosin 0.9.32.1-1 advanced protection module for php5

Hence to remove the obsolete package config and directories completely out of the system and hence solve the PHP Warning I used dpkg –purge, like so:

debian:~# dpkg --purge php5-suhosin
(Reading database ... 76048 files and directories currently installed.)
Removing php5-suhosin ...
Purging configuration files for php5-suhosin ...
Processing triggers for libapache2-mod-php5 ...
Reloading web server config: apache2.

Further on to make sure the PHP Warning is solved I did the cron php script another go and it produced no longer errors:

debian:~# php /home/website/www/cron/update.php
debian:~#

Auto restart Apache on High server load (bash shell script) – Fixing Apache server temporal overload issues

Saturday, March 24th, 2012

auto-restart-apache-on-high-load-bash-shell-script-fixing-apache-temporal-overload-issues

I've written a tiny script to check and restart, Apache if the server encounters, extremely high load avarage like for instance more than (>25). Below is an example of a server reaching a very high load avarage:;

server~:# uptime
13:46:59 up 2 days, 18:54, 1 user, load average: 58.09, 59.08, 60.05
load average: 0.09, 0.08, 0.08

Sometimes high load avarage is not a problem, as the server might have a very powerful hardware. A high load numbers is not always an indicator for a serious problems. Some 16 CPU dual core (2.18 Ghz) machine with 16GB of ram could probably work normally with a high load avarage like in the example. Anyhow as most servers are not so powerful having such a high load avarage, makes the machine hardly do its job routine.

In my specific, case one of our Debian Linux servers is periodically reaching to a very high load level numbers. When this happens the Apache webserver is often incapable to serve its incoming requests and starts lagging for clients. The only work-around is to stop the Apache server for a couple of seconds (10 or 20 seconds) and then start it again once the load avarage has dropped to less than "3".

If this temporary fix is not applied on time, the server load gets increased exponentially until all the server services (ssh, ftp … whatever) stop responding normally to requests and the server completely hangs …

Often this server overloads, are occuring at night time so I'm not logged in on the server and one such unexpected overload makes the server unreachable for hours.
To get around the sudden high periodic load avarage server increase, I've written a tiny bash script to monitor, the server load avarage and initiate an Apache server stop and start with a few seconds delay in between.

#!/bin/sh
# script to check server for extremely high load and restart Apache if the condition is matched
check=`cat /proc/loadavg | sed 's/\./ /' | awk '{print $1}'`
# define max load avarage when script is triggered
max_load='25'
# log file
high_load_log='/var/log/apache_high_load_restart.log';
# location of inidex.php to overwrite with temporary message
index_php_loc='/home/site/www/index.php';
# location to Apache init script
apache_init='/etc/init.d/apache2';
#
site_maintenance_msg="Site Maintenance in progress - We will be back online in a minute";
if [ $check -gt "$max_load" ]; then>
#25 is load average on 5 minutes
cp -rpf $index_php_loc $index_php_loc.bak_ap
echo "$site_maintenance_msg" > $index_php_loc
sleep 15;
if [ $check -gt "$max_load" ]; then
$apache_init stop
sleep 5;
$apache_init restart
echo "$(date) : Apache Restart due to excessive load | $check |" >> $high_load_log;
cp -rpf $index_php_loc.bak_ap $index_php_loc
fi
fi

The idea of the script is partially based on a forum thread – Auto Restart Apache on High Loadhttp://www.webhostingtalk.com/showthread.php?t=971304Here is a link to my restart_apache_on_high_load.sh script

The script is written in a way that it makes two "if" condition check ups, to assure 100% there is a constant high load avarage and not just a temporal 5 seconds load avarage jump. Once the first if is matched, the script first tries to reduce the server load by overwritting a the index.php, index.html script of the website with a one stating the server is ongoing a maintenance operations.
Temporary stopping the index page, often reduces the load in 10 seconds of time, so the second if case is not necessery at all. Sometimes, however this first "if" condition cannot decrease enough the load and the server load continues to stay too high, then the script second if comes to play and makes apache to be completely stopped via Apache init script do 2 secs delay and launch the apache server again.

The script also logs about, the load avarage encountered, while the server was overloaded and Apache webserver was restarted, so later I can check what time the server overload occured.
To make the script periodically run, I've scheduled the script to launch every 5 minutes as a cron job with the following cron:

# restart Apache if load is higher than 25
*/5 * * * * /usr/sbin/restart_apache_on_high_load.sh >/dev/null 2>&1

I have also another system which is running FreeBSD 7_2, which is having the same overload server problems as with the Linux host.
Copying the auto restart apache on high load script on FreeBSD didn't work out of the box. So I rewrote a little chunk of the script to make it running on the FreeBSD host. Hence, if you would like to auto restart Apache or any other service on FreeBSD server get /usr/sbin/restart_apache_on_high_load_freebsd.sh my script and set it on cron on your BSD.

This script is just a temporary work around, however as its obvious that the frequency of the high overload will be rising with time and we will need to buy new server hardware to solve permanently the issues, anyways, until this happens the script does a great job 🙂

I'm aware there is also alternative way to auto restart Apache webserver on high server loads through using monit utility for monitoring services on a Unix system. However as I didn't wanted to bother to run extra services in the background I decided to rather use the up presented script.

Interesting info to know is Apache module mod_overload exists – which can be used for checking load average. Using this module once load avarage is over a certain number apache can stop in its preforked processes current serving request, I've never tested it myself so I don't know how usable it is. As of time of writting it is in early stage version 0.2.2
If someone, have tried it and is happy with it on a busy hosting servers, please share with me if it is stable enough?

Create Routine mirror copy of milw0rm & packetstorm exploits database

Wednesday, January 13th, 2010

Few weeks ago, I’ve built a small script and put it to
execute in cron in order to have an up2date local copy of
milw0rm. Ofcourse that’s pretty handy for several reasons.
For example milw0rm may go down and the exploit database tobe lost forever. This once happened with hack.co.za which ceasedto exist several years ago, even though it has one of thegreatest exploits database for it’s time.
Luckily I did a copy of hack.co.za, knowing that it’s gone
day might come here is the mirror archive of hack.co.za database
Anyways back to the main topic which was creating routine mirror
copy of milw0rm exploits database.
Here is the small script that needs to be setup on cron in order tohave periodic copy of milw0rm exploits database.
#!/usr/local/bin/bash# Download milw0rm exploitsdownload_to='/home/hipo/exploits';milw0rm_archive_url='http://milw0rm.com/sploits/milw0rm.tar.bz2';milw0rm_archive_name='milw0rm.tar.bz2';if [ ! -d '/home/hipo/exploits' ]; thenmkdir -p $download_to;ficd $download_to;wget -q $milw0rm_archive_url;tar -jxvvf $milw0rm_archive_name;rm -f $milw0rm_archive_name;exit 0 The script is available as wellfor download via milw0rm_exploits_download.sh
To make the script operational I’ve set it up to execute via cron with
the following cron record:
00 1 * * * /path_to_script/milw0rm_exploits_download.sh >/dev/null 2>&1 Here is another shell code I used to download all packetstormsecurity exploits frompacketstormsecurity’s website:
#!/usr/local/bin/bash# Download packetstormsecurity exploits# uses jot in order to run in freebsdpacketstorm_download_dir='/home/hipo/exploits';if [ ! -d "$packetstorm_download" ]; thenmkdir -p "$packetstorm_download";for i in $(jot 12); do wget http://www.packetstormsecurity.org/0"$i"11-exploits/0"$i"11-exploits.tgz; done
The script can be obtained also via following link (packetstormsecurity_expl_db_download.sh)

Another interesting tutorial that relates to the topic of building local
mirrors (local exploit database) is an article I found on darkc0de.com’s
website calledHow to build a local exploit database
The article explains thoroughly
howto prepare packetstormsecurity exploits database mirrorand
how to mirror milw0rm through python scripts.
Herein I include links to the 2 mirror scripts:
PacketStorm Security Mirror Script
milw0rm archive mirror script
Basicly the milw0rm archive script is identical to the small shellscript
I’ve written and posted above in the article. However I believe there is
one advantage of the shellscript it doesn’t require you
to have python installed 🙂

Enable Rsyslog and Syslog cron events logging in /var/log/cron.log on Debian Lenny

Friday, April 9th, 2010

By default Debian doesn’t log it’s cron events in a separate log file.
All the cron events got logged along with all the other syslog events configured by default in either syslog or rsyslog.
So you end up with a /var/log/syslog which includes many versatile messages. That’s really unpleasent if you want to keep track of your cron events separately.
I always change this behaviour while configuring new servers or Desktop systems running Debian.
Therefore I decided to share here what I do to enable separate cron logging. The logged cron events would go to var/log/cron.log.
As a starter please make sure you have the file /var/log/cron.log existing on your filesystem tree, if you have it not then please create it:
debian:~# touch /var/log/cron.log

To configure your crond to log to /var/log/cron.log on a system running syslogd all you have to do is edit /etc/syslog.conf and either include the line:

cron.* /var/log/cron.log
or simply uncomment the same line already laying commented in the syslog.conf.
If you’re using the enhanced version of syslogd for Linux (Rsyslog) the code syntax that is necessery to be included is absolutely identical.
Again you have to include:

cron.* /var/log/cron.log

in /etc/rsyslog.conf or uncomment the line shown above in /etc/rsyslog.conf.

Now last step to do is to reload syslogd or rsyslogd.

With syslogd running on your system execute:

debian:~# killall -HUP syslogd

With rsyslogd as a default system logger:

debian:~# killall -HUP rsyslogd

Now you should have your crond logging to the separate /var/log/cron.log, wish you happy cron.log reading 🙂

Linux: List last 10 (newest) and 10 oldest modified files in a directory with ls

Tuesday, April 8th, 2014

An useful thing on GNU / Linux sometimes is to list last or oldest modified files in directory.

Lets say you want to list last 10 modified files with ls from today / yesterday. Here is how:
 

ls -1t | head -10
my.cnf
wordperss_enabled_plugins.txt
newcerts/
mysql-hipo_pcfreakbiz.dump
NewArchive-Jan-10-15.zip
hipo_pcfreakbiz-mysqldb-any-out-1389361234.tgz
Tisho_Snimki/
wordpress/
wp-cron.php?doing_wp_cron=1.1
wp-cron.php


To list 10 oldest modified files on Linux:


ls -1t | tail -10
    my.cnf
    pcfreak_sql-15_10_05_2012
    mysql-tuning-primer*
    tuning-primer.sh*
    system-administration-services.html
    blog_backup_15_07_2012.tar.gz
    www-files/
    dump.sql
    courier-imap*
    djbdns-1.05.tar.gz


Cheers 😉

Linux: how to show all users crontab – List all cronjobs

Thursday, May 22nd, 2014

linux-unix-list-all-crontab-users-and-scripts
I'm doing another server services decomissioning and part of decomissioning plan is: Removing application and all related scripts from related machines (FTP, RSYNC, …). In project documentation I found a list with Cron enabled shell scripts:

#Cron tab excerpt:
1,11,21,31,41,51 * * * */webservices/tools/scripts/rsync_portal_sync.sh

that has to be deleted, however there was nowhere mentioned under what kind of credentials (with what kind of user) are the cron scripts running? Hence I had to look up all users that has cronjobs and find inside each user's cronjobs whether respective script is set to run. Herein I will explain shortly how I did that.

Cronjobs by default has few locations from where cronjobs are setupped depending on their run time schedule. First place I checked for the scripts is

/etc/crontabs # cat /etc/crontabs SHELL=/bin/sh
PATH=/usr/bin:/usr/sbin:/sbin:/bin:/usr/lib/news/bin
MAILTO=root
#
# check scripts in cron.hourly, cron.daily, cron.weekly, and cron.monthly
#
-*/15 * * * * root test -x /usr/lib/cron/run-crons && /usr/lib/cron/run-crons >/dev/null 2>&1
59 * * * * root rm -f /var/spool/cron/lastrun/cron.hourly
14 4 * * * root rm -f /var/spool/cron/lastrun/cron.daily
29 4 * * 6 root rm -f /var/spool/cron/lastrun/cron.weekly
44 4 1 * * root rm -f /var/spool/cron/lastrun/cron.monthly

I was not really user via what user is shell script run, therefore I looked first if someone doesn't set the script to run via crontab's standard locations for Daily, Hourly,Weekly and Monthly cronjobs:
 

a) Daily set cron jobs are in:

/etc/cron.daily/

b) Hourly set cron jobs:

/etc/cron.hourly

c) Weekly cron jobs are in:

/etc/cron.weekly/

d) Monthly cron jobs:

/etc/cron.monthly

There is also a location read by crontab for all Software (package distribution) specific cronjobs – all run under root user privileges.:

e) Software specific script cron jobs are in:

/etc/cron.d/  
As the system has about 327 users in /etc/passwd, checking each user's cronjob manually with:

# crontab -u UserName -l

was too much time consuming thus it is a good practice to list

/var/spool/cron/*

directory and to see which users has cron jobs defined


# ls -al /var/spool/cron/*
-rw——- 1 root root 11 2007-07-09 17:08 /var/spool/cron/deny

/var/spool/cron/lastrun:
total 0
drwxr-xr-x 2 root root 80 2014-05-22 11:15 .
drwx—— 4 root root 120 2008-02-25 15:45 ..
-rw-r–r– 1 root root 0 2014-05-22 04:15 cron.daily

/var/spool/cron/tabs:
total 8
drwx—— 2 root root 72 2014-04-03 03:43 .
drwx—— 4 root root 120 2008-02-25 15:45 ..
-rw——- 1 root root 4901 2014-04-03 03:43 root


/var/spool/cron – is crond (/usr/bin/cron/)'s spool directory.

# ls -al /var/spool/cron/tabs/ total 8
drwx------ 2 root root 72 2014-04-03 03:43 .
drwx------ 4 root root 120 2008-02-25 15:45 ..
-rw------- 1 root root 4901 2014-04-03 03:43 root

Above output shows only root superuser has defined crons.

Alternative way to check all user crontabs is via quick Linux one liner shell script show all user cron jobs

for i in $(cat /etc/passwd | sed -e "s#:# #g" | awk '{ print $1 }'); do
echo "user $i --- crontab ---";
crontab -u $i -l 2>&1 >/dev/null;
echo '----------';
done|less

Note that above short script has to run with root user. Enjoy 🙂

How to set a crontab to execute commands on a seconds time interval on GNU / Linux and FreeBSD

Sunday, October 30th, 2011

crontab-execute-cron-jobs-every-second-on-linux-cron-logo
Have you ever been in need to execute some commands scheduled via a crontab, every let’s say 5 seconds?, naturally this is not possible with crontab, however adding a small shell script to loop and execute a command or commands every 5 seconds and setting it up to execute once in a minute through crontab makes this possible.
Here is an example shell script that does execute commands every 5 seconds:

#!/bin/bash
command1_to_exec='/bin/ls';
command2_to_exec='/bin/pwd';
for i in $(echo 1 2 3 4 5 6 7 8 9 10 11); do
sleep 5;
$command1_to_exec; $command2_to_exec;
done

This script will issue a sleep every 5 seconds and execute the two commands defined as $command1_to_exec and $command2_to_exec

Copy paste the script to a file or fetch exec_every_5_secs_cmds.sh from here

The script can easily be modified to execute on any seconds interval delay, the record to put on cron to use with this script should look something like:

# echo '* * * * * /path/to/exec_every_5_secs_cmds.sh' | crontab -

Where of course /path/to/exec_every_5_secs_cmds.sh needs to be modified to a proper script name and path location.

Another way to do the on a number of seconds program / command schedule without using cron at all is setting up an endless loop to run/refresh via /etc/inittab with a number of predefined commands inside. An example endless loop script to run via inittab would look something like:

while [ 1 ]; do
/bin/ls
sleep 5;
done

To run the above sample never ending script using inittab, one needs to add to the end of inittab, some line like:

mine:234:respawn:/path/to/script_name.sh

A quick way to add the line from consone would be with echo:

echo 'mine:234:respawn:/path/to/script' >> /etc/inittab

Of course the proper paths, should be put in:

Then to load up the newly added inittab line, inittab needs to be reloaded with cmd:

# init q

I've also red, some other methods suggested to run programs on a periodic seconds basis using just cron, what I found in stackoverflow.com's  as a thread proposed as a solution is:

* * * * * /foo/bar/your_script
* * * * * sleep 15; /foo/bar/your_script
* * * * * sleep 30; /foo/bar/your_script
* * * * * sleep 45; /foo/bar/your_script

One guy, even suggested a shorted way with cron:

0/15 * * * * * /path/to/my/script