![]()
In this article, I'm going to show you how to setup a very simple monitoring if a local running SMTP (Postfix / Qmail / Exim) is responding correctly on basic commands. The check would helpfully keep you in track to know whether your configured Linux server local MTA (Mail Transport Agent) is responding on requests on TCP / IP protocol Port 25, as well as a check for process existence of master (that is the main postfix) proccess, as well as the usual postfix spawned sub-processes qmgr (the postfix queue manager), tsl mgr (TLS session cache and PRNG manager), pickup (Postfix local mail pickup) – or email receiving process.
Normally a properly configured postfix installation on a Linux whatever you like distribution would look something like below:
# ps -ef|grep -Ei 'master|postfix'|grep -v grep
root 1959 1 0 Jun21 ? 00:00:00 /usr/libexec/postfix/master -w
postfix 1961 1959 0 Jun21 ? 00:00:00 qmgr -l -t unix -u
postfix 4542 1959 0 Jun21 ? 00:00:00 tlsmgr -l -t unix -u
postfix 2910288 1959 0 11:28 ? 00:00:00 pickup -l -t unix -u
At times, during mail server restarts the amount of processes that are sub spawned by postfix, may very and if you a do a postfix restart
# systemctl restart postfix
The amout of spawned processes running as postfix username might decrease, and only qmgr might be available for second thus in the consequential shown Template the zabbix processes check to make sure the Postfix is properly operational on the Linux machine is made to check for the absolute minumum of
1. master (postfix process) that runs with uid root
2. and one (postfix) username binded proccess
If the amount of processes on the host is less than this minimum number and the netcat is unable to simulate a "half-mail" sent, the configured Postfix alarm Action (media and Email) will take place, and you will get immediately notified, that the monitored Mail server has issue!
The idea is to use a small one liner connection with netcat and half simulate a normal SMTP transaction just like you would normally do:
root@pcfrxen:/root # telnet localhost 25
Trying 127.0.0.1…
Connected to localhost.
Escape character is '^]'.
220 This is Mail2 Pc-Freak.NET ESMTP
HELO localhost
250 This is Mail2 Pc-Freak.NET
MAIL FROM:<hipopo@pc-freak.net>
250 ok
RCPT TO:<hip0d@remote-smtp-server.com>
and then disconnect the connection.
1. Create new zabbix userparameter_smtp_check.conf file
The simple userparameter one liner script to do the task looks like this:
# vi /etc/zabbix/zabbix_agent.d/userparameter_smtp_check.conf
UserParameter=smtp.check,(if [[ $(echo -e “HELO localhost\n MAIL FROM: root@$HOSTNAME\n RCPT TO: report-email@your-desired-mail-server.com\n QUIT\n” | /usr/bin/nc localhost 25 -w 5 2>&1 | grep -Ei ‘220\s.*\sESMTP\sPostfix|250\s\.*|250\s\.*\sOk|250\s\.*\sOk|221\.*\s\w’|wc -l) == ‘5’ ]]; then echo "SMTP OK 1"; else echo "SMTP NOK 0"; fi)
Set the proper permissions so either file is owned by zabbix:zabbix or it is been able to be read from all system users.
# chmod a+r /etc/zabbix/zabbix_agent.d/userparameter_smtp_check.conf
2. Create a new Template for the Mail server monitoring
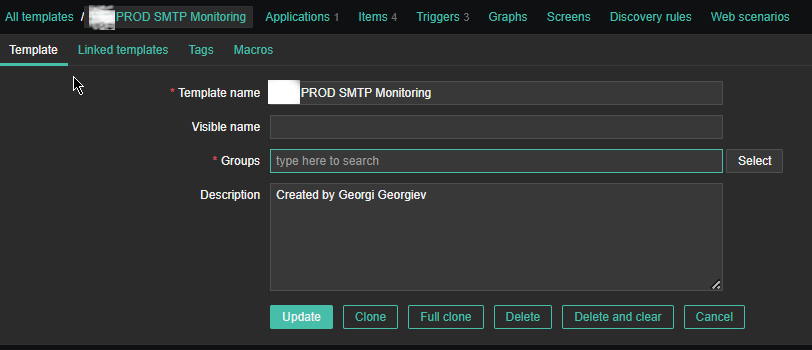
Just like any other template name it with what fits you as you see, I've call it PROD SMTP Monitoring, as the template is prepared to specifically monitor In Production Linux machines, and a separate template is used to monitor the Quality Assurance (QAs) as well as PreProd (Pre Productions).
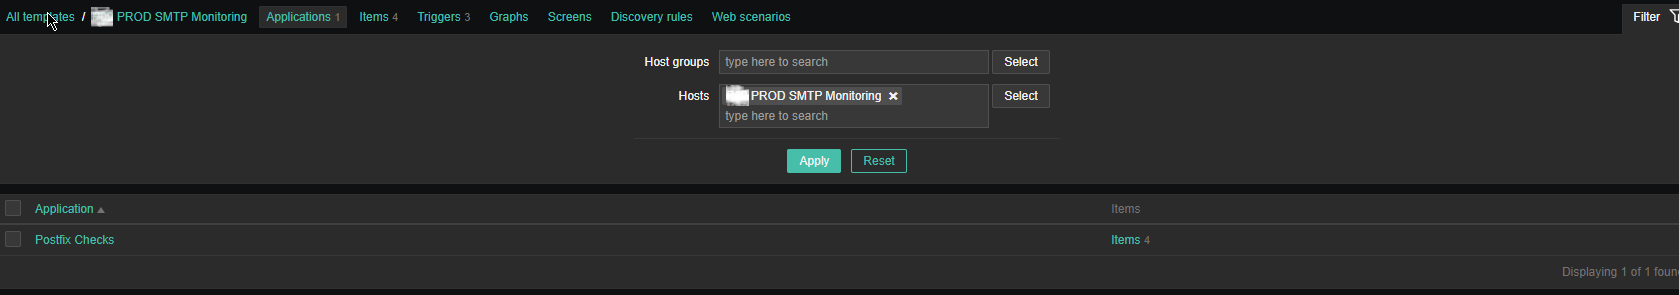
3. Create the followng Items and Depedent Item to process zabbix-agent received data from the Userparam script
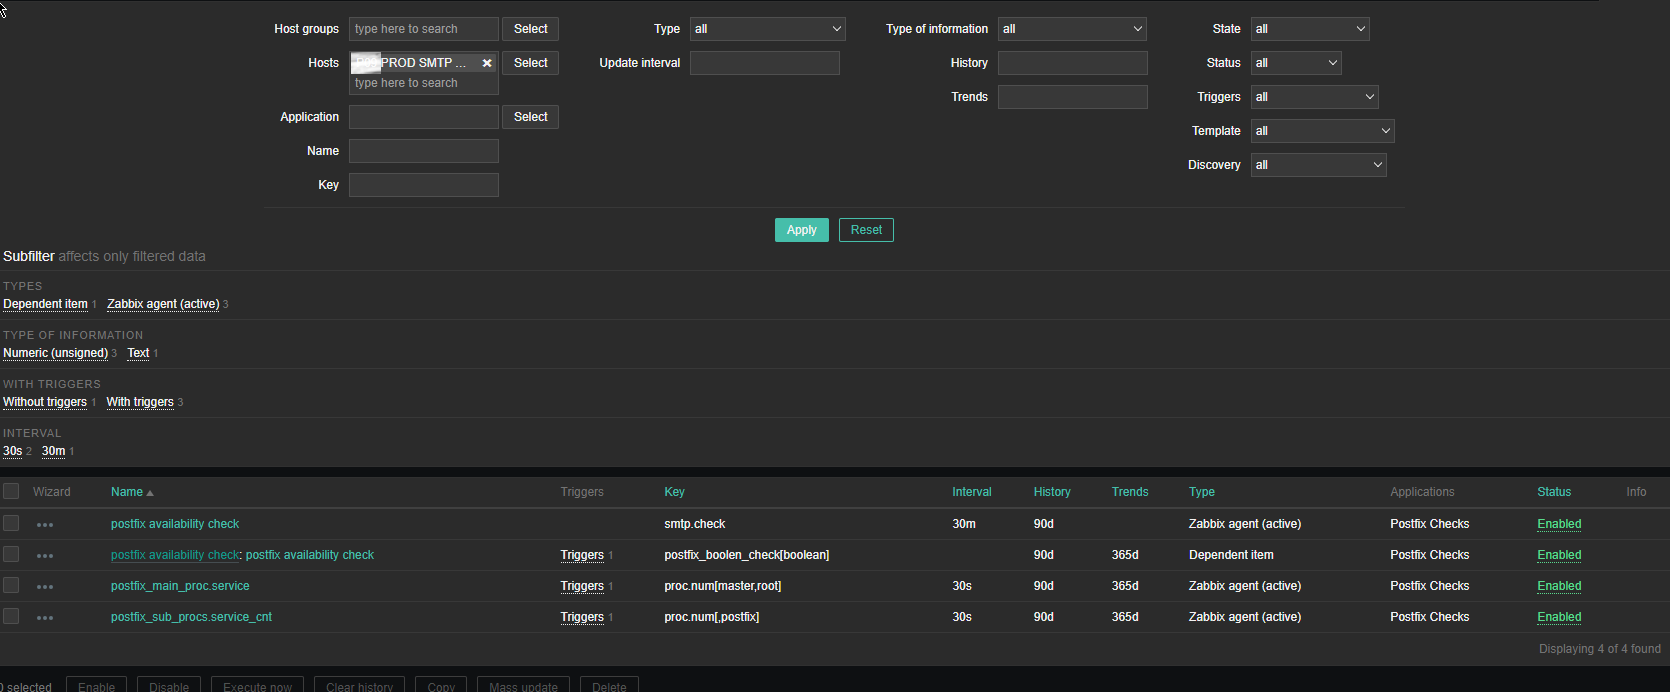
Above is the list of basic Items and Dependent Item you will need to configure inside the SMTP Check zabbix Template.
The Items should have the following content and configurations:
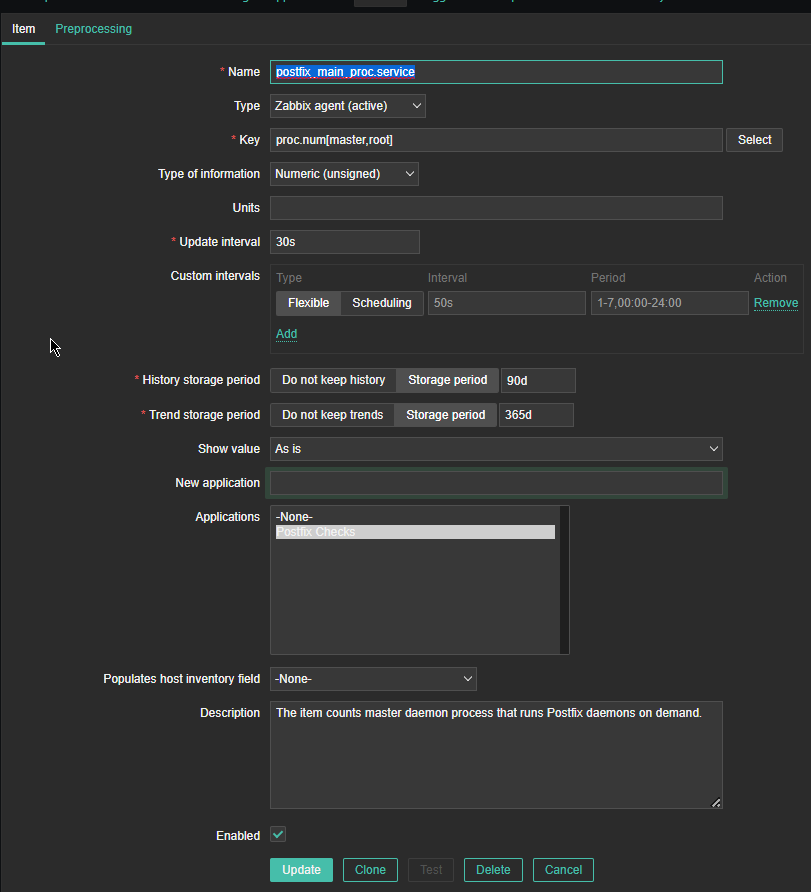
*Name: postfix_main_proc.service
Type: Zabbix agent(active)
*Key: proc.num[master,root]
Type of Information: Numeric (unassigned)
*Update interval: 30s
Custom Intervals: Flexible
*History storage period: 90d
*Trend storage period: 365d
Show Value: as is
Applications: Postfix Checks
Populated host inventory field: -None-
Description: The item counts master daemon process that runs Postfix daemons on demand
Where the arguments pased to proc.num[] function are:
master is the process that is being looked up for and root is the username with which the the postfix master daemon is running. If you need to adapt it for qmail or exim that shouldn't be a big deal you only have to in advance check the exact processes that are normally running on the machine
and configure a similar process check for it.
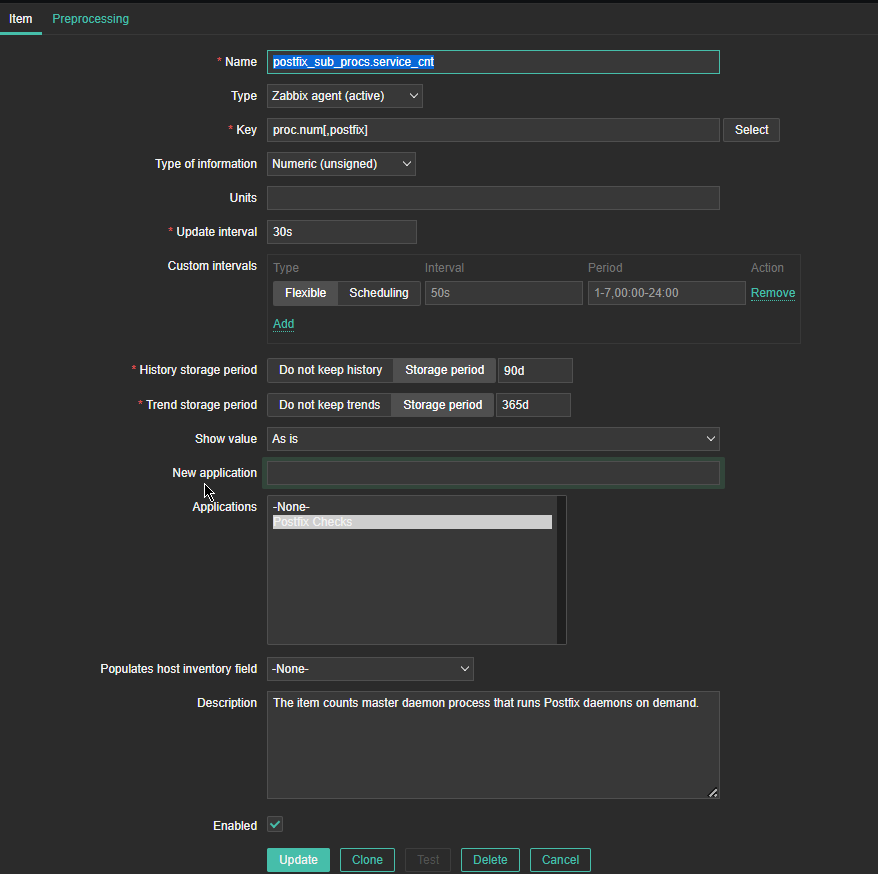
*Name: postfix_sub_procs.service_cnt
Type: Zabbix agent(active)
*Key: proc.num[,postfix]
Type of information: Numeric (unassigned)
Update Interval: 30s
*History Storage period: Storage Period 90d
*Trend storage period: Storage Period 365d
Description: The item counts master daemon processes that runs postfix daemons on demand.
Here the idea with this Item is to check the number of processes that are running with user / groupid that is postfix. Again for other SMPT different from postfix, just set it to whatever user / group
you would like zabbix to look up for in Linux the process list. As you can see here the check for existing postfix mta process is done every 30 seconds (for more critical environments you can put it to less).
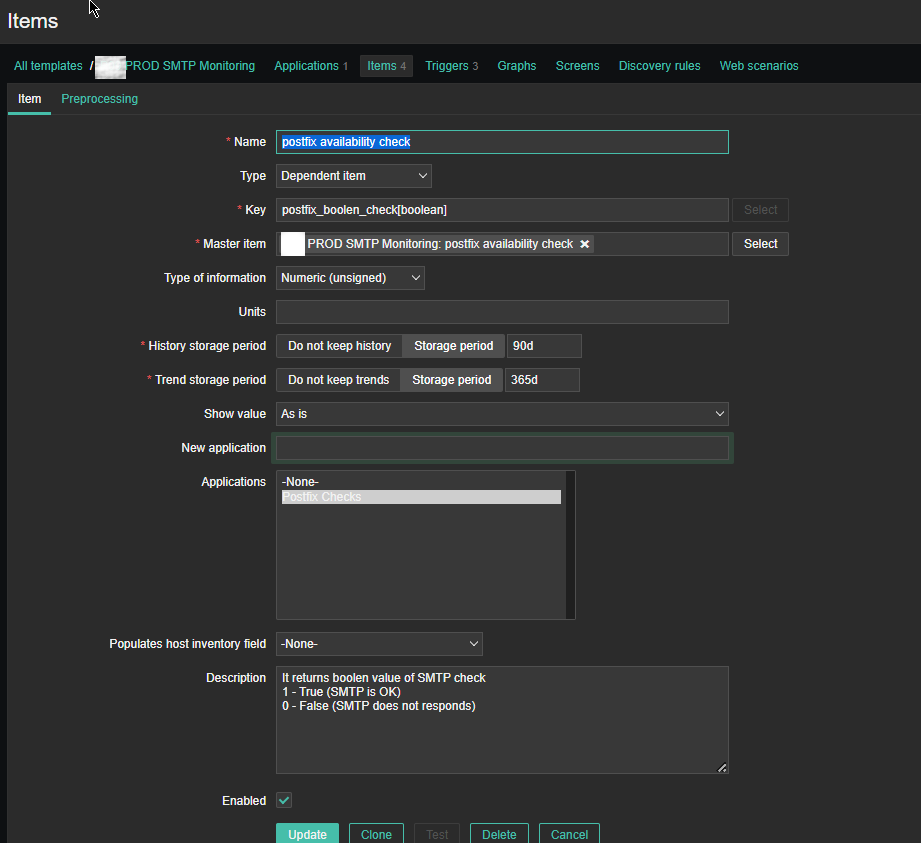
For simple zabbix use this Dependent Item is not necessery required. But as we would like to process more closely the output of the userparameter smtp script, you have to set it up.
If you want to write graphical representation by sending data to Grafana.
*Name: postfix availability check
Key: postfix_boolean_check[boolean]
Master Item: PROD SMTP Monitoring: postfix availability check
Type of Information: Numeric unassigned
*History storage period: Storage period 90d
*Trend storage period: 365d
Applications: Postfix Checks
Description: It returns boolean value of SMTP check
1 – True (SMTP is OK)
0 – False (SMTP does not responds)
Enabled: Tick
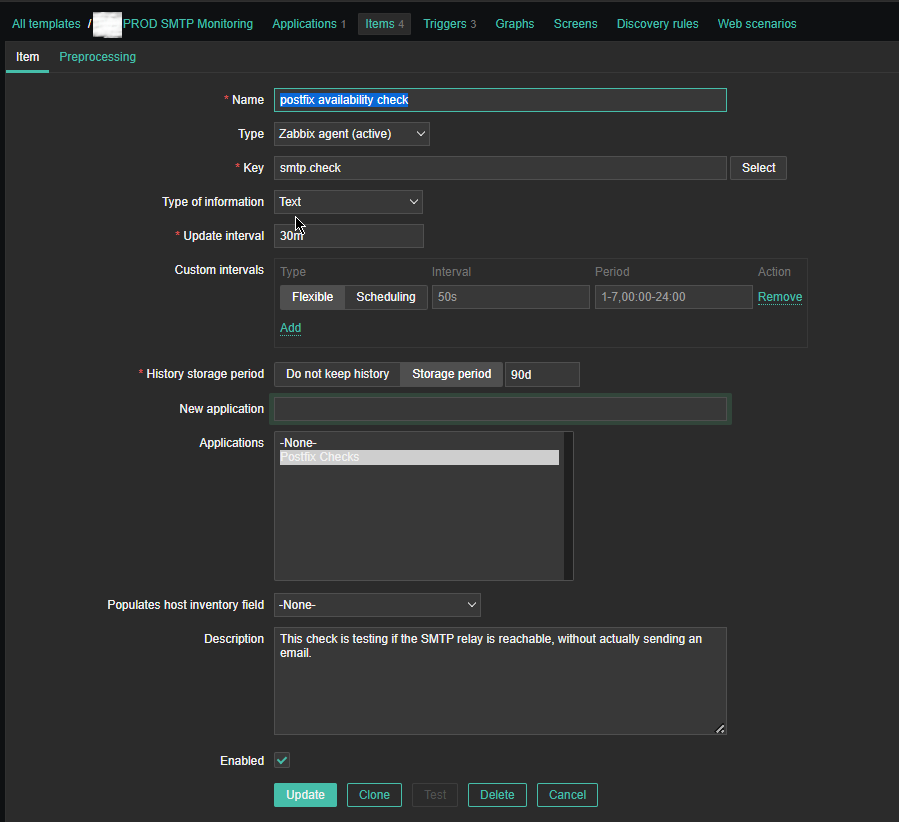
*Name: postfix availability check
*Key: smtp.check
Custom intervals: Flexible
*Update interval: 30 m
History sotrage period: Storage Period 90d
Applications: Postfix Checks
Populates host inventory field: -None-
Description: This check is testing if the SMTP relay is reachable, without actual sending an email
Enabled: Tick
4. Configure following Zabbix Triggers
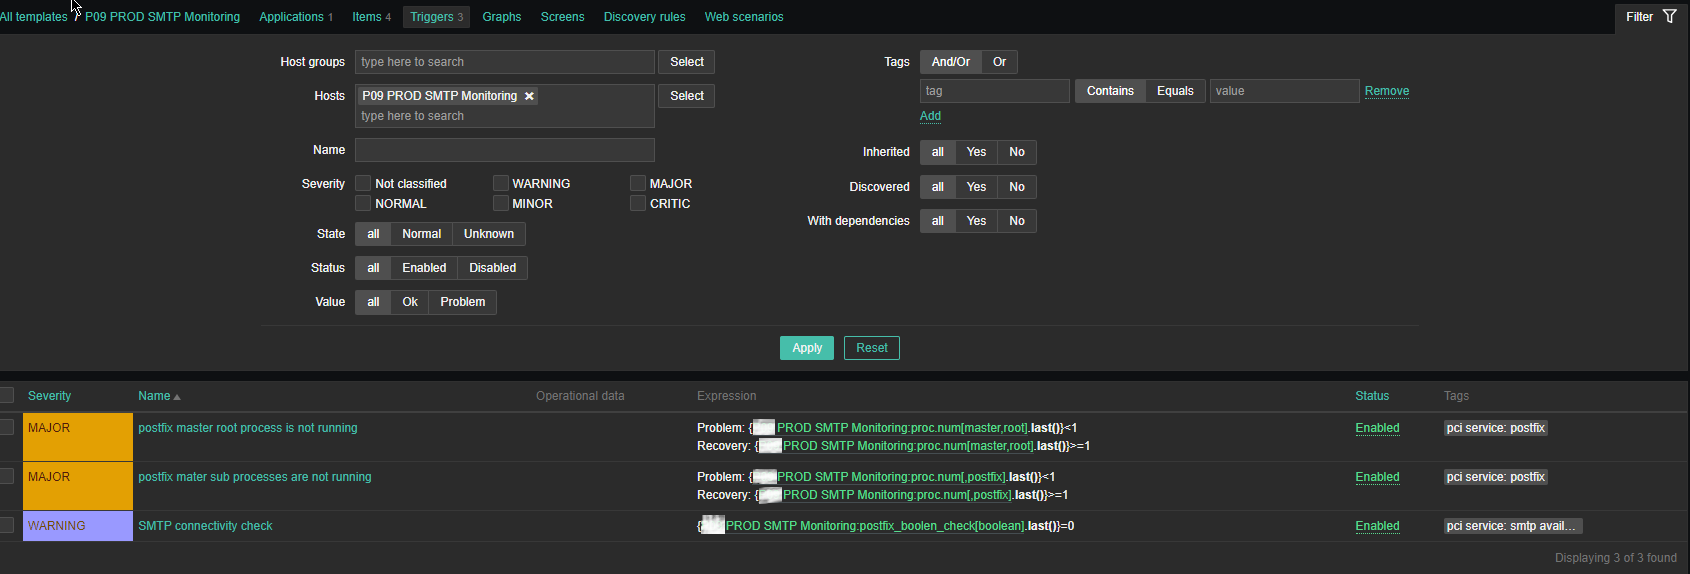
Note: The severity levels you should have previosly set in Zabbix up to your desired ones.
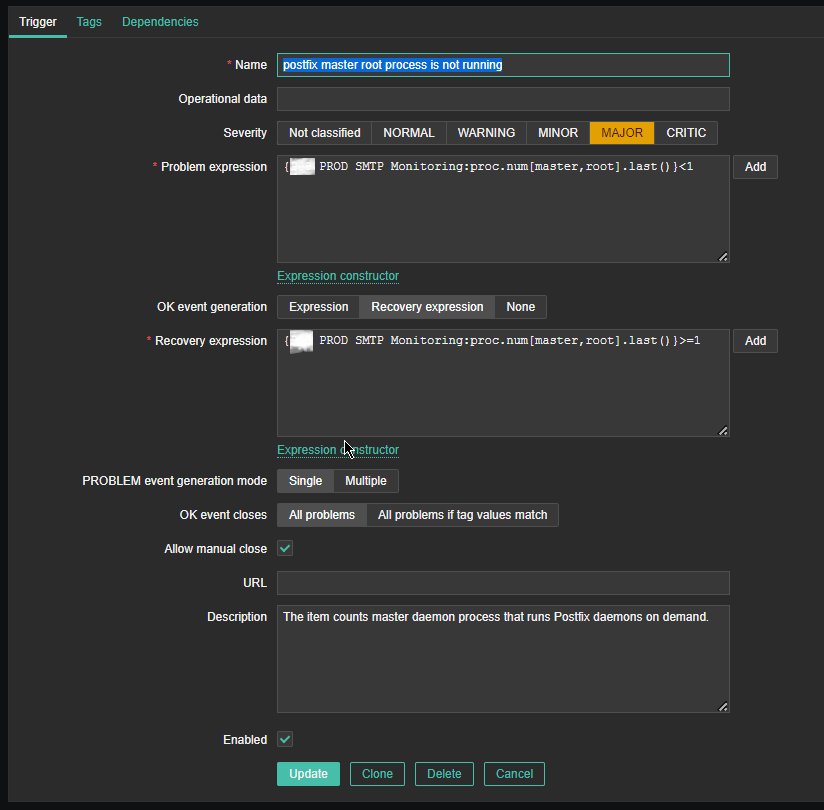
Name: postfix master root process is not running
*Problem Expression: {PROD SMTP Monitoring:proc.num[master,root].last()}<1
OK event generation: Recovery expression
*Recovery Expression: {PROD SMTP Monitoring:proc.num[master,root].last()}>=1
Allow manual close: Tick
Description: The item counts master daemon process that runs Postfix daemon on demand.
Enabed: Tick
I would like to have an AUTO RESOLVE for any detected mail issues, if an issue gets resolved. That is useful especially if you don't have the time to put the Zabbix monitoring in Maintainance Mode during Operating system planned updates / system reboots or unexpected system reboots due to electricity power loss to the server colocated – Data Center / Rack .
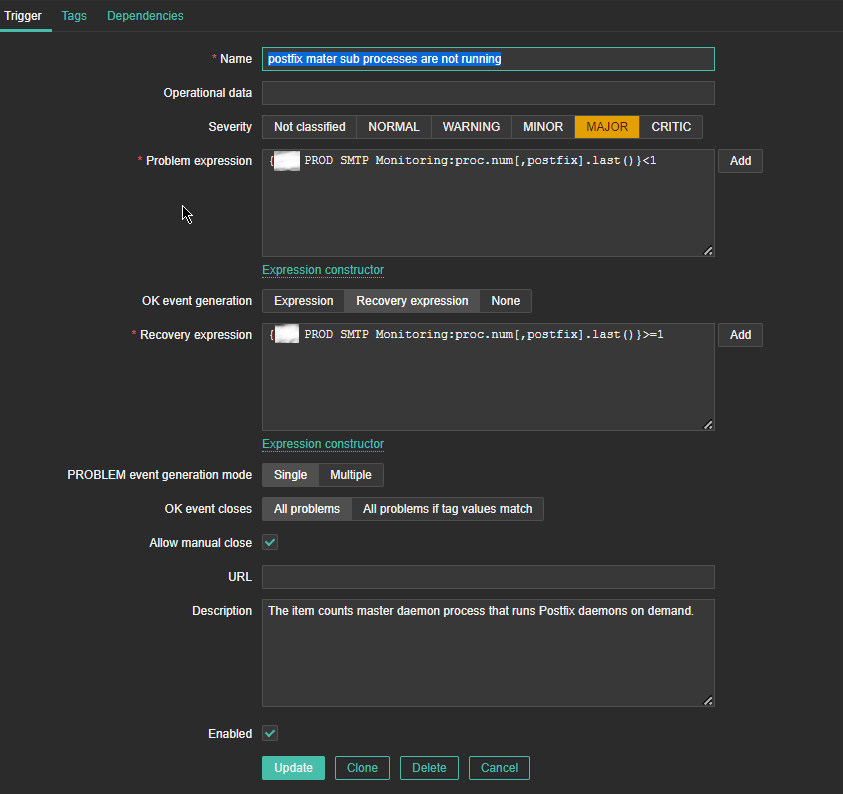
*Name: postfix master sub processes are not running
*Problem Expression: {P09 PROD SMTP Monitoring:proc.num[,postfix].last()}<1
PROBLEM event generation mode: Single
OK event closes: All problems
*Recovery Expression: {P09 PROD SMTP Monitoring:proc.num[,postfix].last()}>=1
Problem event generation mode: Single
OK event closes: All problems
Allow manual close: Tick
Enabled: Tick
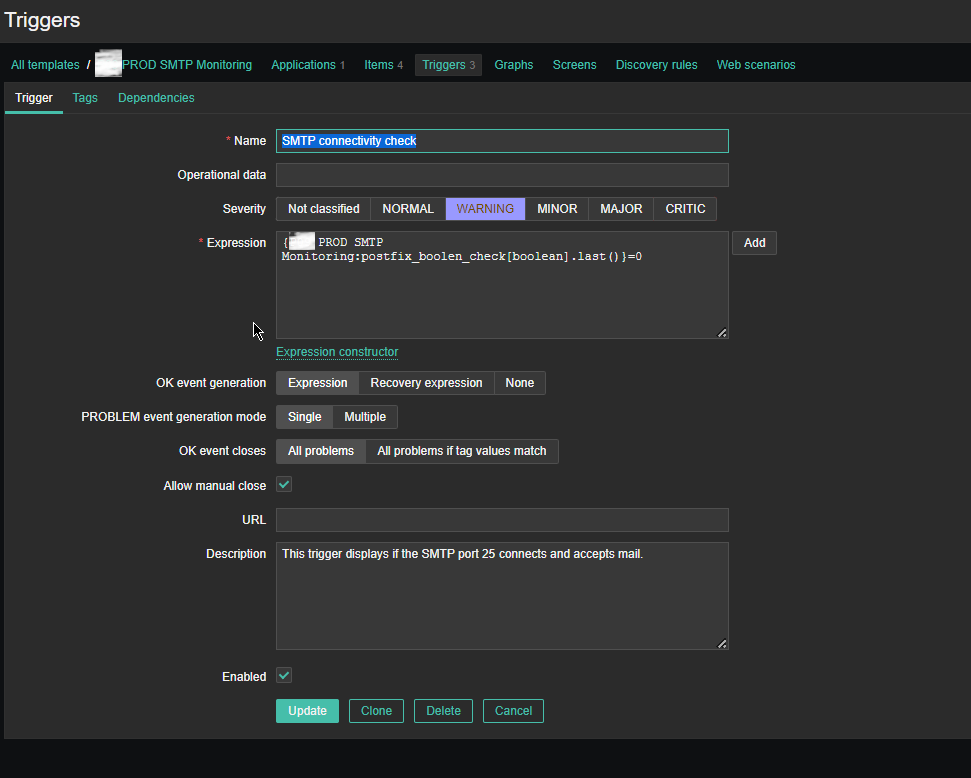
Name: SMTP connectivity check
Severity: WARNING
*Expression: {PROD SMTP Monitoring:postfix_boolen_check[boolean].last()}=0
OK event generation: Expression
PROBLEM even generation mode: SIngle
OK event closes: All problems
Allow manual close: Tick
Enabled: Tick
5. Configure respective Zabbix Action
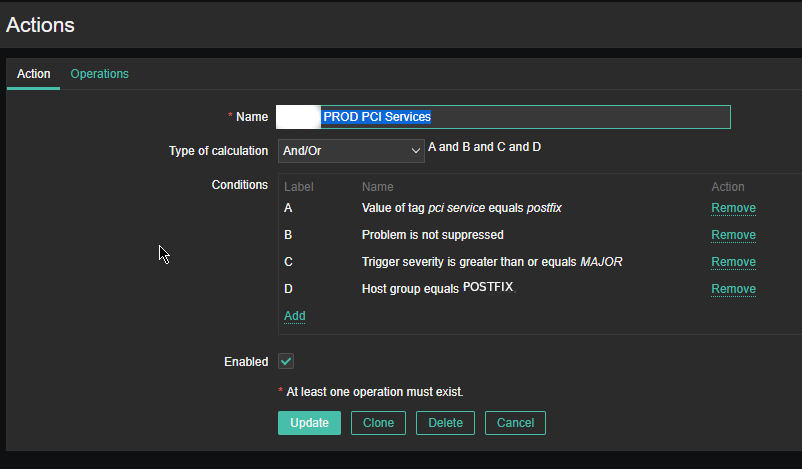
As the service is tagged with 'pci service' tag we define the respective conditions and according to your preferences, add as many conditions as you need for the Zabbix Action to take place.
NOTE! :
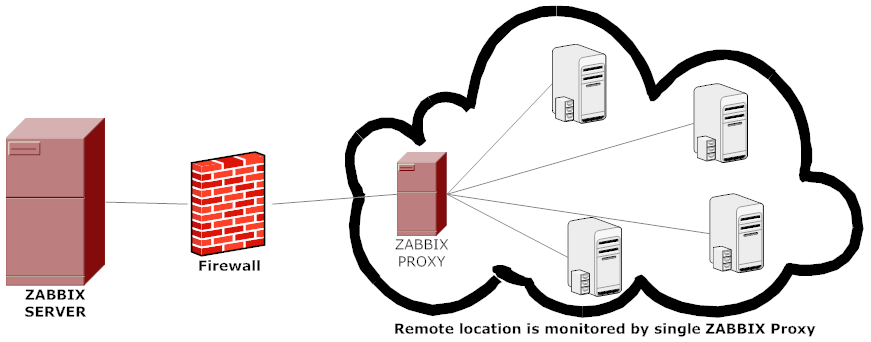
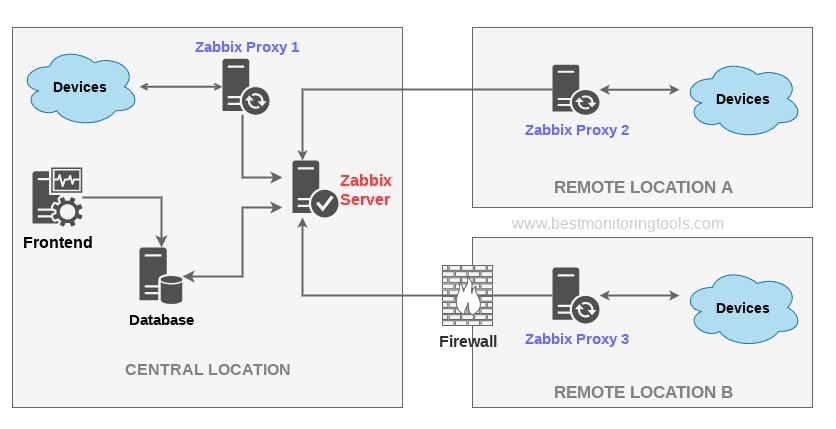
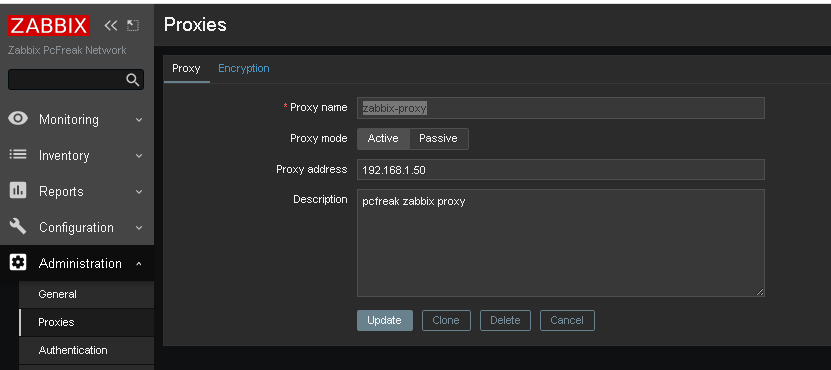
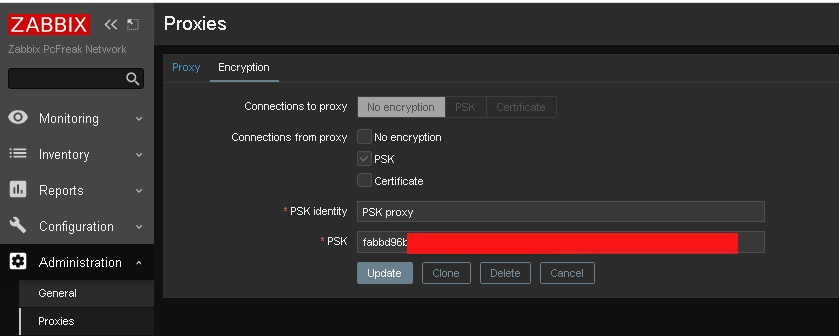
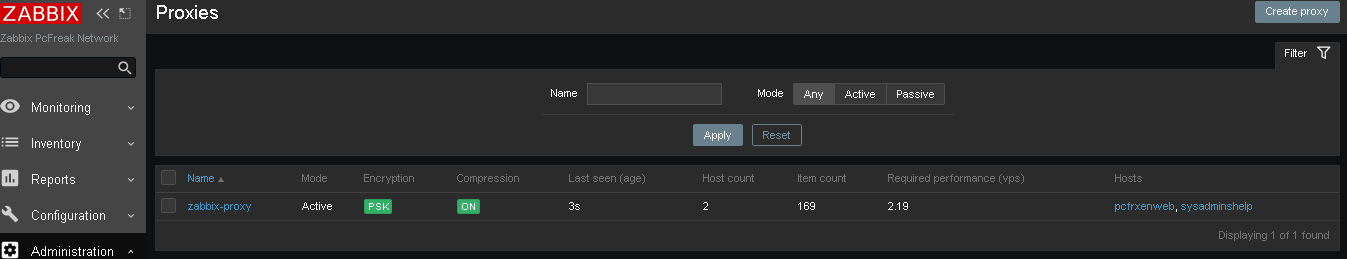
Assuming that communication chain beween Zabbix Server -> Zabbix Proxy (if zabbix proxy is used) -> Zabbix Agent works correctly you should start receiving that from the userparameter script in Zabbix with the configured smtp.check userparam key every 30 minutes.
Note that this simple nc check will keep a trail records inside your /var/log/maillog for each netcat connection, so keep in mind that in /var/log/maillog on each host which has configured the SMTP Check zabbix template, you will have some records similar to:
# tail -n 50 /var/log/maillog
2023-06-22T09:32:18.164128+02:00 lpgblu01f postfix/smtpd[2690485]: improper command pipelining after HELO from localhost[127.0.0.1]: MAIL FROM: root@your-machine-fqdn-address.com\n RCPT TO: your-supposable-receive-addr@whatever-mail-address.com\n QUIT\n
2023-06-22T09:32:18.208888+02:00 lpgblu01f postfix/smtpd[2690485]: 32EB02005B: client=localhost[127.0.0.1]
2023-06-22T09:32:18.209142+02:00 lpgblu01f postfix/smtpd[2690485]: disconnect from localhost[127.0.0.1] helo=1 mail=1 rcpt=1 quit=1 commands=4
2023-06-22T10:02:18.889440+02:00 lpgblu01f postfix/smtpd[2747269]: connect from localhost[127.0.0.1]
2023-06-22T10:02:18.889553+02:00 lpgblu01f postfix/smtpd[2747269]: improper command pipelining after HELO from localhost[127.0.0.1]: MAIL FROM: root@your-machine-fqdn-address.com\n RCPT TO: your-supposable-receive-addr@whatever-mail-address.com\n QUIT\n
2023-06-22T10:02:18.933933+02:00 lpgblu01f postfix/smtpd[2747269]: E3ED42005B: client=localhost[127.0.0.1]
2023-06-22T10:02:18.934227+02:00 lpgblu01f postfix/smtpd[2747269]: disconnect from localhost[127.0.0.1] helo=1 mail=1 rcpt=1 quit=1 commands=4
2023-06-22T10:32:26.143282+02:00 lpgblu01f postfix/smtpd[2804195]: connect from localhost[127.0.0.1]
2023-06-22T10:32:26.143439+02:00 lpgblu01f postfix/smtpd[2804195]: improper command pipelining after HELO from localhost[127.0.0.1]: MAIL FROM: root@your-machine-fqdn-address.com\n RCPT TO: your-supposable-receive-addr@whatever-mail-address.com\n QUIT\n
2023-06-22T10:32:26.186681+02:00 lpgblu01f postfix/smtpd[2804195]: 2D7F72005B: client=localhost[127.0.0.1]
2023-06-22T10:32:26.186958+02:00 lpgblu01f postfix/smtpd[2804195]: disconnect from localhost[127.0.0.1] helo=1 mail=1 rcpt=1 quit=1 commands=4
2023-06-22T11:02:26.924039+02:00 lpgblu01f postfix/smtpd[2860398]: connect from localhost[127.0.0.1]
2023-06-22T11:02:26.924160+02:00 lpgblu01f postfix/smtpd[2860398]: improper command pipelining after HELO from localhost[127.0.0.1]: MAIL FROM: root@your-machine-fqdn-address.com\n RCPT TO: your-supposable-receive-addr@whatever-mail-address.com\n QUIT\n
2023-06-22T11:02:26.963014+02:00 lpgblu01f postfix/smtpd[2860398]: EB08C2005B: client=localhost[127.0.0.1]
2023-06-22T11:02:26.963257+02:00 lpgblu01f postfix/smtpd[2860398]: disconnect from localhost[127.0.0.1] helo=1 mail=1 rcpt=1 quit=1 commands=4
2023-06-22T11:32:29.145553+02:00 lpgblu01f postfix/smtpd[2916905]: connect from localhost[127.0.0.1]
2023-06-22T11:32:29.145664+02:00 lpgblu01f postfix/smtpd[2916905]: improper command pipelining after HELO from localhost[127.0.0.1]: MAIL FROM: root@your-machine-fqdn-address.com\n RCPT TO: your-supposable-receive-addr@whatever-mail-address.com\n QUIT\n
2023-06-22T11:32:29.184539+02:00 lpgblu01f postfix/smtpd[2916905]: 2CF7D2005B: client=localhost[127.0.0.1]
2023-06-22T11:32:29.184729+02:00 lpgblu01f postfix/smtpd[2916905]: disconnect from localhost[127.0.0.1] helo=1 mail=1 rcpt=1 quit=1 commands=4
That's all folks use the :
Configuration -> Host (menu)
and assign the new SMTP check template to as many of the Linux hosts where you have setup the Userparameter script and Enjoy the new mail server monitoring at hand.