
Why run an Own Home or Dedicated Own server nowadays is a must in the Digital Age ?
Having own home based email server should be the target (most basic step) of any person that respects his Email privacy as most of the Public accessible Email accounts such as Yahoo Mail! and Gmail are collecting personal flavour info and flavour data.
Thus to mitigate the possible Personal Security problems of using any of the multiple Public Email services it is rather easy nowdays to configure quickly a own based home Email server, Hire Cheap VPS for Own Email Service or even hire a Dedicated server – the cheapeast dedis nowadays are starting from 40 / 50 EUROs per server.
To protect your Email privacy to maximum and keep your email data owned by you hence in this small article, I'll explain how to setup a Postfix based Simple own hosted Email server in about 2 hours of time, but before proceeding with the actual install instructions, I'll say a bit more on the downsides of using public mail gmail.com / yahoo.com / yandex.ru etc.
– The Downsides of using Public free hosted email address such as Google / Yahoo / Yandex / Mail.com etc.
If you happen to have @gmail.com account then you're more or less surveilled by automated scripts software that prepares your virtual dossier – those of us who lived in the Communism of USSR, knew that each of us had a good personal record kept in policy no matter of his function in society, now the situation is no different besides the fact that your Corporate owned data is often sold to National Governments could leak out of its owner and a lot of very personal data could end up in the hands of some malicious blackmailers or spammers, that could have a very complete records of your interest, age, profession, marrital status, position in society, music preference, daily habits, something definitely most people want to avoid.
– Why using Android Phone with Gmail is terrible for your privacy / myaccount.google.com and what Google knows about you
To get further idea about the great expand of Surveillance, if you're an Android Mobile Phone User like me I recommend you login with your Android Email account to https://myaccount.google.com and find out what Google knows about you or better said what from what it knew is willing to show you.
Android OS phones collect a lot of data connected to your Mail use if you stay logged in in Browser (because you forgot to logout and left the new tab opened) as well as track you about the overall Google Search Engine made searches or Youtube watched and preferred genre videos – hence know about overall activity on the Net. And even worse perhaps there is much more details that are automatically shared to Google as you're continuously logged in to Android Google Play …
To illustrate what I mean in terms of How much we're surveilled nowadays, in one of my Gmail accounts I've been almost stunned seeing that, some Google Data Analytics scripts based on the Android Synchronized pictures has created a full featured nice funny Music video of "my life", showing me pictures of my marriage ceremonly, places, where I visit such as some Monasteries, close friends and a tons of very private data that in normal circumstances, they should never know about.
Earlier I've blogged how to Install and Configure a Postfix server with Dovecot and MySQL with a configuration setup that worked on Debian 7 and prior Debian servers which used to be among the only setups that can keep mail accounts inside the database that worked on the net and for more professional Email server to be serving a small / midsized company multiple email boxes perhaps it is still a good one to follow, however as above suggested initial config is a bit overcomplicated (and maybe outdated) for Linux novice users / sysadmins and for own small home servers with only few Mail accounts it might be not needed at all.
I've decided to write how to setup much more quickly and easily Working Internet Mail server with MailBoxes directly owned by each of the UNIX created local accounts.
1. Install prerequired packages for Email setup and set hostname
Update Debian Linux distribution to the latest:
apt-get –yes update && apt-get –yes upgrade
apt-get install curl net-tools bash-completion wget lsof nano mailutils bsdmailx
In this article I assume you already have your own Linux server.
To make the hosts file ber read before any local running DNS server in case if you're running bind or any other local caching DNS server add following lines to /etc/host.conf
vim /etc/host.conf
order hosts,bind
multi on
If you already haven't configured the machine hostname on Linux OS install time, next step is to set the machine hostname to the Fully Qualified Domain Name (FQDN) that will be used by mail server.
hostnamectl set-hostname mail.your-mail-domain.com
If you don't plan to regularly change the IP address of Mail server It is a good idea to add the IP -> Domain relation to /etc/hosts doing so should not waste DNS cycles to resolve the hostname but every time the hostname will be locally taken from /etc/hosts.
echo "86.78.10.1 your-mail-domain.com mail.your-mail-domain.com" >> /etc/hosts
getent ahosts mail.your-mail-domain.com
86.78.10.1 STREAM mail.your-mail-domain.com
86.78.10.1 DGRAM
86.78.10.1 RAW
Also check whether mail.your-mail-domain.com is pingable
ping mail.your-mail-domain.com
You should get a properly delivered ping packets with no losses.
2. Install Postfix Mail Server Debian package
Debian Postfix package provides a MTA (Message Transfer Agent). MTA is a pr
apt-get install –yes postfix
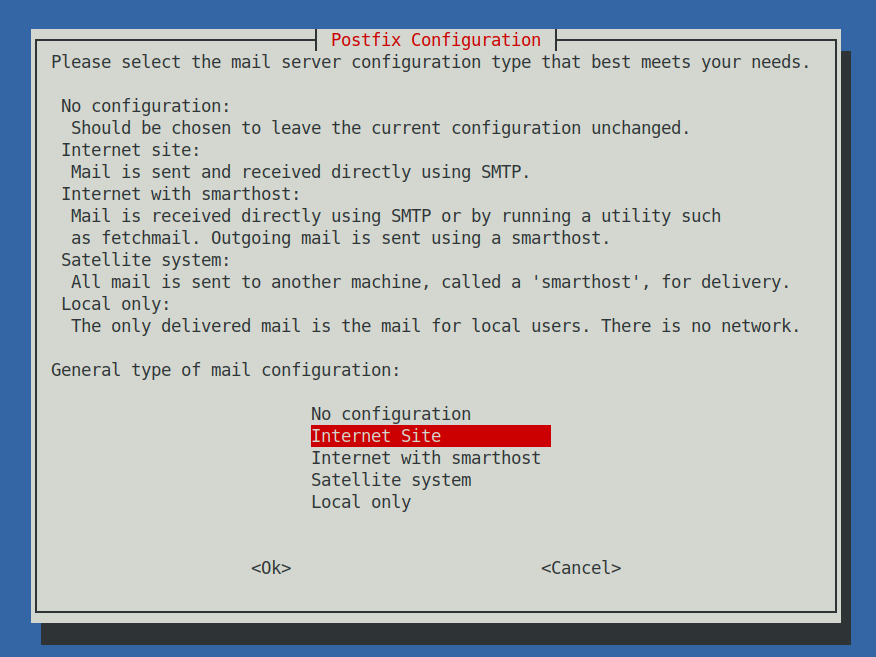
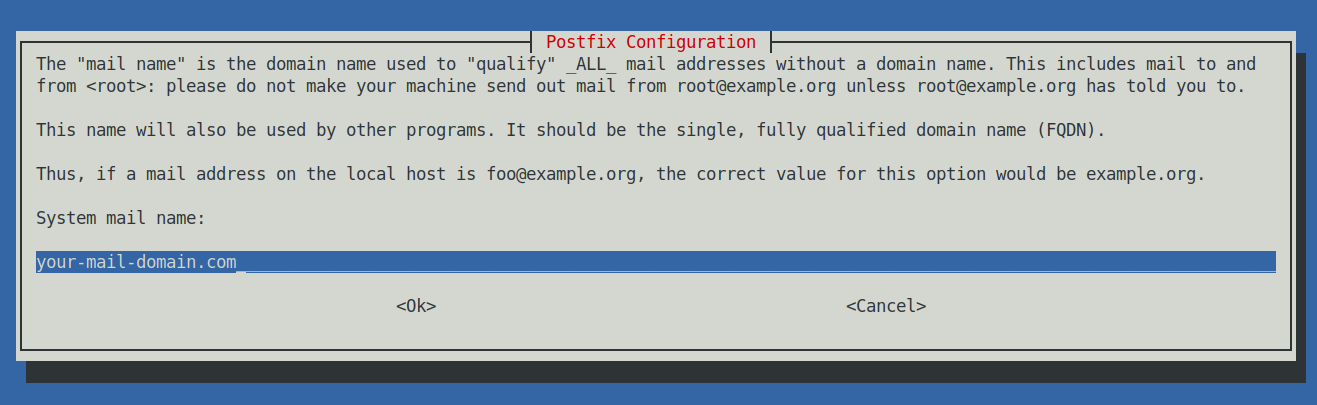
Next a ncurses interface will prompt you the usual Postfix type configuration where we have to choose Internet Site and type in the mail name your-mail-domain.com (note that here you have to type the domain without the mail. part) .
3. Setup Postfix Mail server configuration main.cf
Before starting make backup of main.cf
cp -rpf /etc/postfix/main.cf{,.backup}
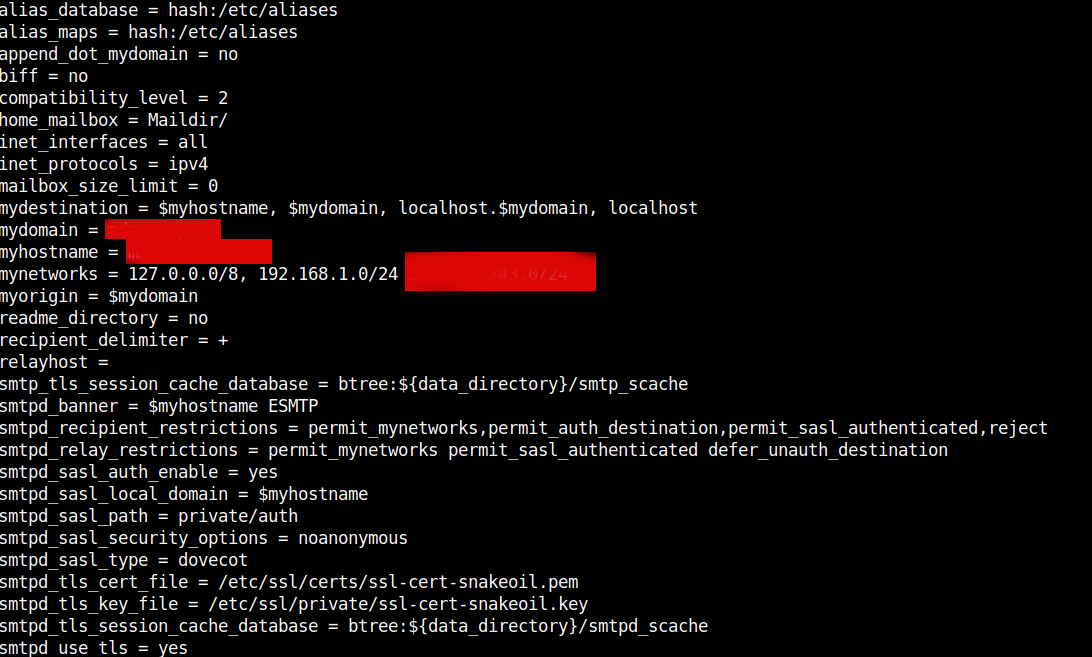
vim /etc/postfix/main.cf
# See /usr/share/postfix/main.cf.dist for a commented, more complete version
smtpd_banner = $myhostname ESMTP
biff = no
# appending .domain is the MUA's job.
append_dot_mydomain = no
readme_directory = no
# See http://www.postfix.org/COMPATIBILITY_README.html — default to 2 on
# fresh installs.
compatibility_level = 2
# TLS parameters
smtpd_tls_cert_file=/etc/ssl/certs/ssl-cert-snakeoil.pem
smtpd_tls_key_file=/etc/ssl/private/ssl-cert-snakeoil.key
smtpd_use_tls=yes
smtpd_tls_session_cache_database = btree:${data_directory}/smtpd_scache
smtp_tls_session_cache_database = btree:${data_directory}/smtp_scache
# See /usr/share/doc/postfix/TLS_README.gz in the postfix-doc package for
# information on enabling SSL in the smtp client.
smtpd_relay_restrictions = permit_mynetworks permit_sasl_authenticated defer_unauth_destination
myhostname = mail.your-mail-domain.com
mydomain = your-mail-domain.com
alias_maps = hash:/etc/aliases
alias_database = hash:/etc/aliases
#myorigin = /etc/mailname
myorigin = $mydomain
mydestination = $myhostname, $mydomain, localhost.$mydomain, localhost
relayhost =
mynetworks = 127.0.0.0/8, 192.168.1.0/24 86.78.10.0/24
mailbox_size_limit = 0
recipient_delimiter = +
inet_interfaces = all
#inet_protocols = all
inet_protocols = ipv4
home_mailbox = Maildir/
# SMTP-Auth settings
smtpd_sasl_type = dovecot
smtpd_sasl_path = private/auth
smtpd_sasl_auth_enable = yes
smtpd_sasl_security_options = noanonymous
smtpd_sasl_local_domain = $myhostname
smtpd_recipient_restrictions = permit_mynetworks,permit_auth_destination,permit_sasl_authenticated,reject
Replace the myhostname, mydomain and mynetworks variables to match your own configurations.
If for example your Mail Host IP is 86.78.10.1 then to add only this IP to mynetworks 86.78.10.1/32, if you have a range of IPs such as a 254 IP's range set the proper mask 86.78.10.1/24 etc.
Next you better test the configuration to make sure you haven't syntax errors with:
postconf -n
If no syntax errors found the command should dump main.cf postfix set variables.
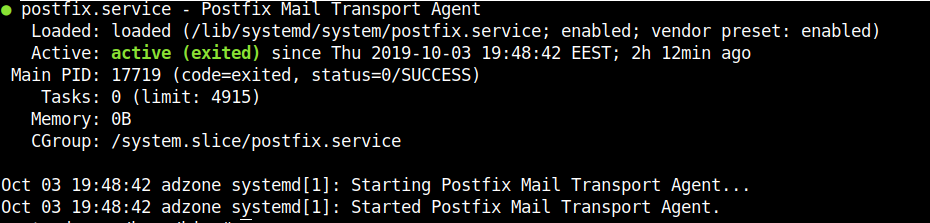
Once config is fine to load it and test the status of postfix run:
systemctl restart postfix
systemctl status postfix
Then lets check the listener and try out telnet connect.
netstat -tulpan|grep -i 25
tcp 0 0 0.0.0.0:25 0.0.0.0:* LISTEN 17715/master
telnet localhost 25
Trying 127.0.0.1…
Connected to localhost.
Escape character is '^]'.
220 mail.your-mail-domain.com ESMTP
4. Testing email sent is working on Postfix Mail Server
First lets test postfix is able to deliver to local email addresses by sending mail to mail root user mailbox
echo "This is a test mail body"| mail -s "Simple test mail" root
Everything should be fine and mail should be the last delivered to root MailBox to view it:
cat /root/Maildir/new/$(ls -1 /root/Maildir/new/|tail -1)
Return-Path: <root@localhost>
X-Original-To: root@localhost
Delivered-To: root@localhost
Received: by mx.adzone.pro (Postfix, from userid 0)
id 9C4FA7E1952; Thu, 3 Oct 2019 22:19:59 +0300 (EEST)
Subject: Simple test mail
To: <root@localhost>
X-Mailer: mail (GNU Mailutils 3.5)
Message-Id: <20191003191959.9C4FA7E1952@mail.your-mail-domain.com>
Date: Thu, 3 Oct 2019 22:19:59 +0300 (EEST)
From: root <root@localhost>
This is a test mail body
by default mail command will try to read email content from /var/mail/root file which will be empty file, because Postfix main.cf home_mailbox = Maildir/ emails served by MTA will be delivered to /$USER/Maildir/ seperated in 3 directories (cur – current, mail ends here once red, new – new incoming mail, tmp – temporary directory used by postfix delivery programs /usr/lib/postfix/sbin/master and qmgr.
# ls -al /$USER/Maildir
total 20
drwx—— 5 root root 4096 Sep 30 20:26 .
drwx—— 9 root root 4096 Oct 3 22:37 ..
drwx—— 2 root root 4096 Sep 30 20:26 cur
drwx—— 2 root root 4096 Oct 3 22:19 new
drwx—— 2 root root 4096 Oct 3 22:19 tmp
Hence to set for mail command to read its mails from /$USER/Maildir you need to add:
export MAIL=$HOME/Maildir
to end of ~/.bashrc red for user after very user login.
echo 'export MAIL=$HOME/Maildir' >> /root/.bashrc
or if you want to make the mail command to read from /$USER/Maildir system wide (e.g. for all users).
You can add a simple script mailenv.sh to /etc/profile.d/
echo 'export MAIL=$HOME/Maildir' ' >> /etc/profile.d/mailenv.sh
If mail is send successfully you should also get an empty mail queue:
# mailq
Mail queue is empty
To get further info on how email got delivered its delivery status:
tail -f /var/log/mail.log
Once we're sure everything is fine with mail delivery, next step is to enable the Server to be accessed via IMAP2 protocol in plain text or crypted connected via Dovecot.
5. Install and configure Dovecot IMAP daemon
Dovecot is server binded daemon, responsible to deliver messages to local recipients mailboxes in IMAP protocol. IMAP protocol runs by default on port 143 and port 993 (SSL) – used for secure communication between the client side and the server. IMAP (Internet Message Acess Protocol) is used by email clients to retrieve email messages from a mail server over a TCP/IP connection.
IMAP was designed with the goal of permitting complete management of an email box by multiple email clients, therefore clients generally leave messages on the server until the user explicitly deletes them.
The IMAP protocol also uses synchronization in order to assure that a copy of each message is saved on the server and allows users to create multiple directories on the server and move mails to this directories in order to sort the e-mails.
POP3 proto (listening on port 110) which is older in time, differs from IMAP as protocol won’t allow users to create multiple directories on the server to sort your mail. You only have the inbox folder to manage mail.
But enought talk, lets kick in and install dovecot.
apt install –yes dovecot-core dovecot-imapd
…
Once installed to make dovecot listen on 143 and 993 on all network interfaces edit /etc/dovecot/dovecot.conf find commented line #listen = *, :: and uncomment it
vim /etc/dovecot/dovecot.conf
#listen = *, ::
listen = *, ::
….
Next edit /etc/dovecot/conf.d/10-auth.conf to disable obligatory SSL / TSL authentication for connecting client programs
disable_plaintext_auth and auth_mechanisms vars should look like so
disable_plaintext_auth = no
auth_mechanisms = plain login
Then, change the default mail store format from Mbox to Maildir in /etc/dovecot/conf.d/10-mail.conf comment mail_location set directive and change it to mail_location = maildir:~/Maildir
vim /etc/dovecot/conf.d/10-mail.conf
…
## mail_location = mbox:~/mail:INBOX=/var/mail/%u
mail_location = maildir:~/Maildir
…
Finally edit /etc/dovecot/conf.d/10-master.conf
Search for smtp-auth block of code and change to look as following:
# Postfix smtp-auth
unix_listener /var/spool/postfix/private/auth {
mode = 0666
user = postfix
group = postfix
}
6. Restart dovecot and test if configuration works as expected
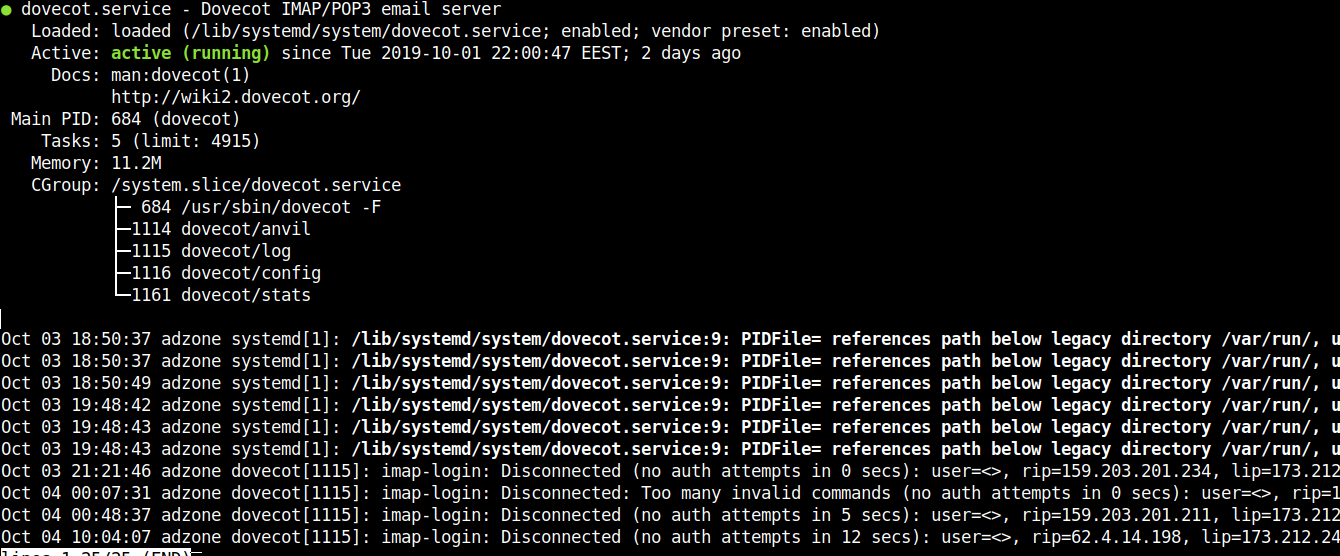
systemctl restart dovecot.service
systemctl status dovecot.service
netstat -tlpn
7. Create new local email user and test mail delivery and IMAP dovecot connectivity
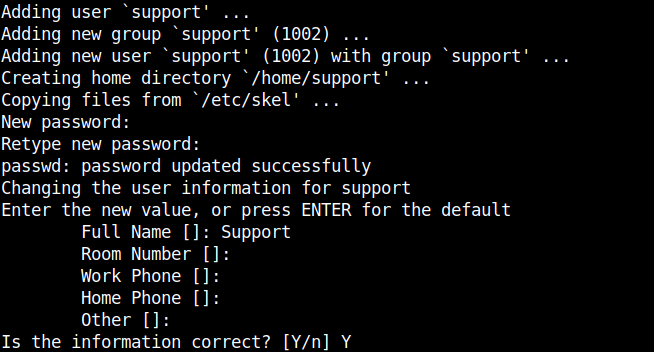
Now as postfix and dovecot are running fine to have a functional email to test SMTP delivery, we need create a new working email address, that means a simple local UNIX account with adduser / useradd *nix commands as usual.
adduser support
telnet localhost 25
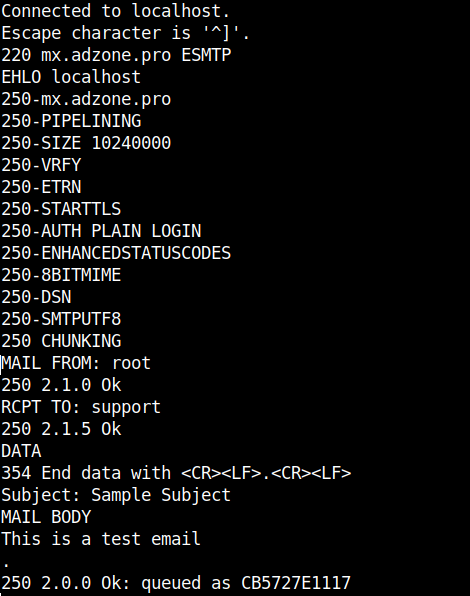
The commands sent after connection with Enters at the end of each line and delay of 1/2 secs are as so:
EHLO localhost
MAIL FROM: root
RCPT TO: support
DATA
Subject: Sample Subject
MAIL BODY
.
The last email in /home/support/Maildir/new/ should be the one we just sent.
cat /home/support/Maildir/new/$(ls -1 /home/support/Maildir/new/|tail -1)
Return-Path: <root@your-mail-domain.com>
X-Original-To: support
Delivered-To: support@your-mail-domain.com
Received: from localhost (localhost [127.0.0.1])
by mx.adzone.pro (Postfix) with ESMTP id CB5727E1117
for <support>; Fri, 4 Oct 2019 11:50:24 +0300 (EEST)
Subject: Sample Subject
Message-Id: <20191004085038.CB5727E1117@mail.your-mail-domain.com>
Date: Fri, 4 Oct 2019 11:50:24 +0300 (EEST)
From: root@your-mail-domain.com
MAIL BODY
This is a test email
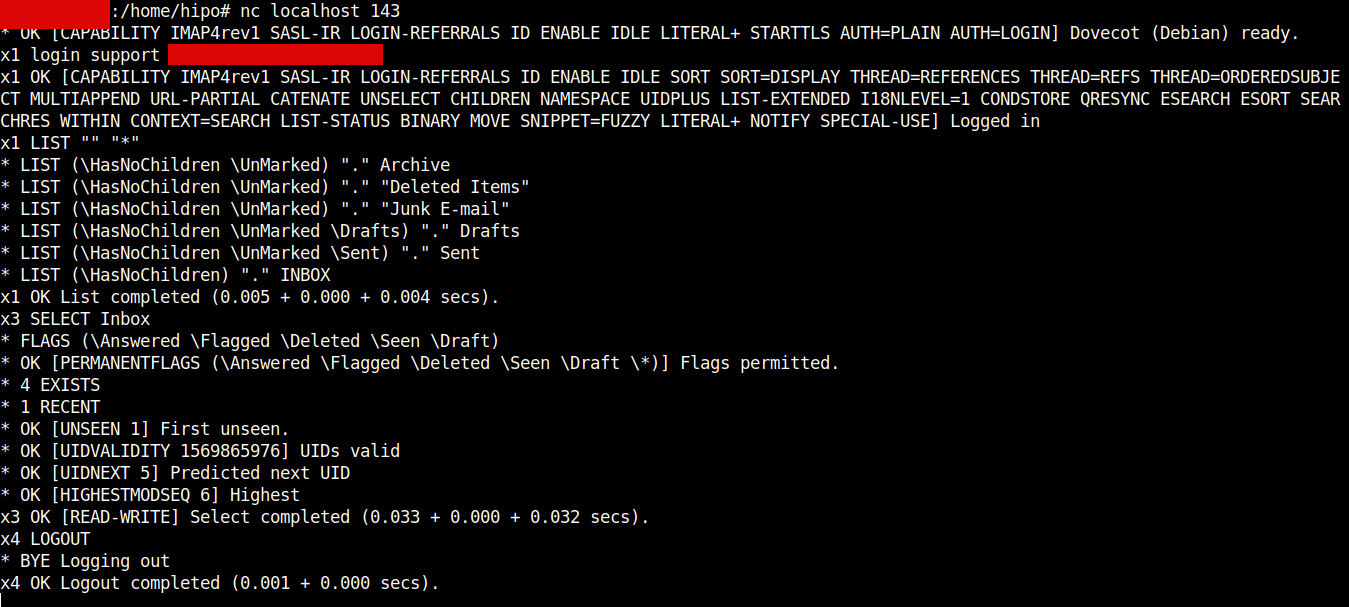
As you see mail delivered as expected, next step is to check we can properly login to IMAP server provided by dovecot.
Thunderbird / Outlook Express / Sylpheed and rest of IMAP protocol supporting clients could be emulated also with a simple netcat / telnet connection and few commands, below is how:
nc localhost 143
x1 LOGIN support user_password
x2 LIST "" "*"
x3 SELECT Inbox
x4 LOGOUT
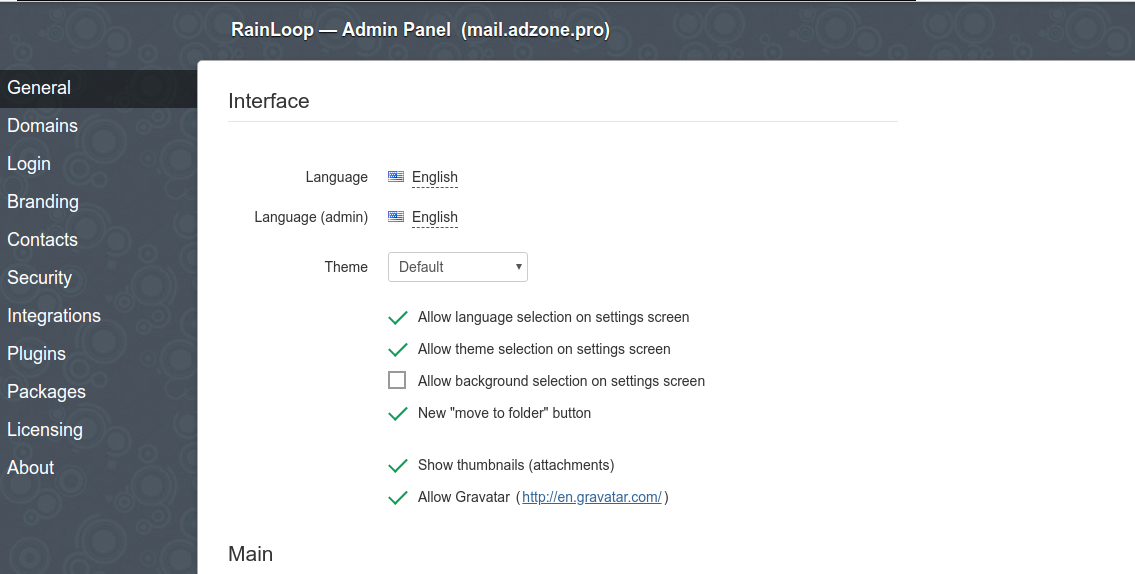
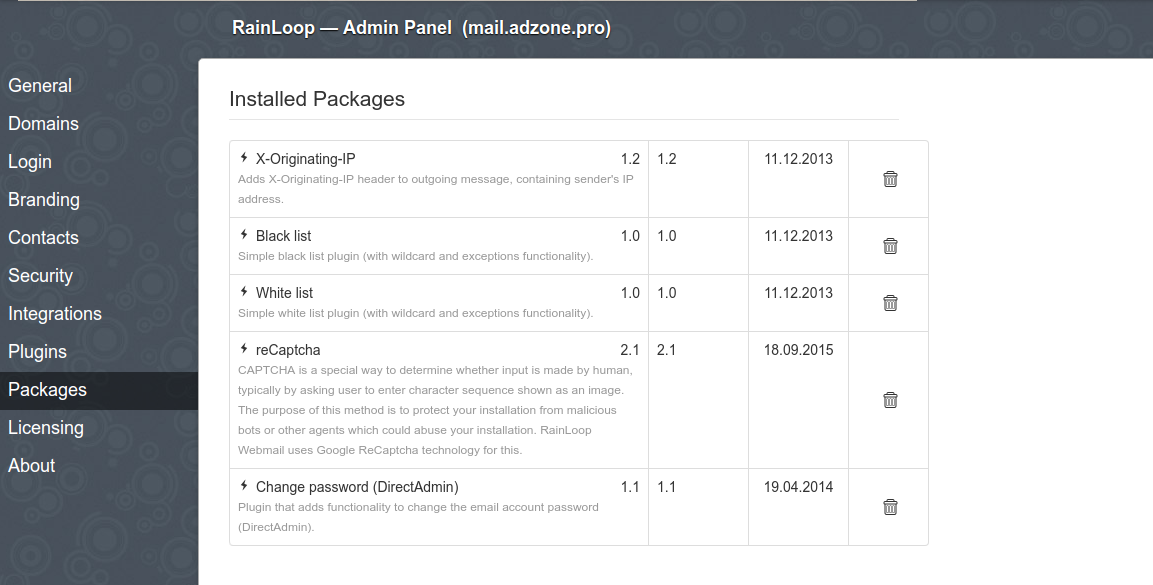
8. Install and Configure RainLoop (PHP) WebMail
RainLoop is Simple, Modern and Fast Web-Based Email client, that supports IMAP over it can communicate to just tested Dovecot IMAP. The pros of RainLoop are the modest system requirements (no database backend required) and the mega simple installation and update.
RainLoop is written in PHP and uses Apache Webserver to serve content, as well has a dependency on few php modules, hence you have to install below .deb packs.
apt install –yes apache2 php7.0 libapache2-mod-php7.0 php7.0-curl php7.0-xml
Once above is installed and HTTP server is running on the backend the most simple way to install is to use the default Apache configured DocumentRoot directory which is /var/www/html to make the RainLoop a default opening Platform for the WebServer delete the default page /var/www/html/index.html, change directory to it and install via the PHP installer, e.g.
rm -f /var/www/html/index.html
cd /var/www/html
curl -sL https://repository.rainloop.net/installer.php | php
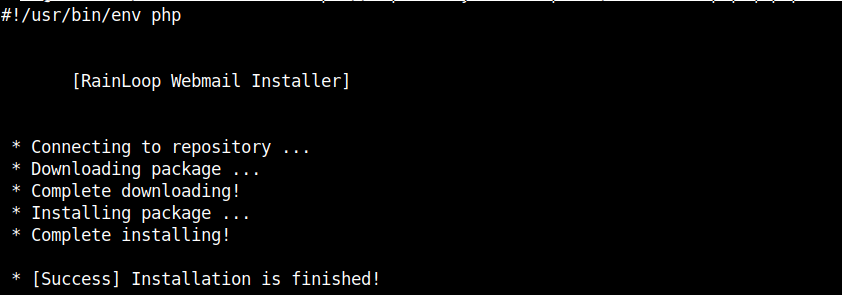
Once RainLoop Webmail Installer is completed to login to Admin use the Host or IP address URL in browser, where it is installed for example:
http://192.168.0.102/?admin
However it is much better to set the webmail to be living on a seperate domain VirtualHost URL address , i. e. (depending on the serving backend Webserver Apache / Nginx etc.) – you can use mail.your-mail-domain.com
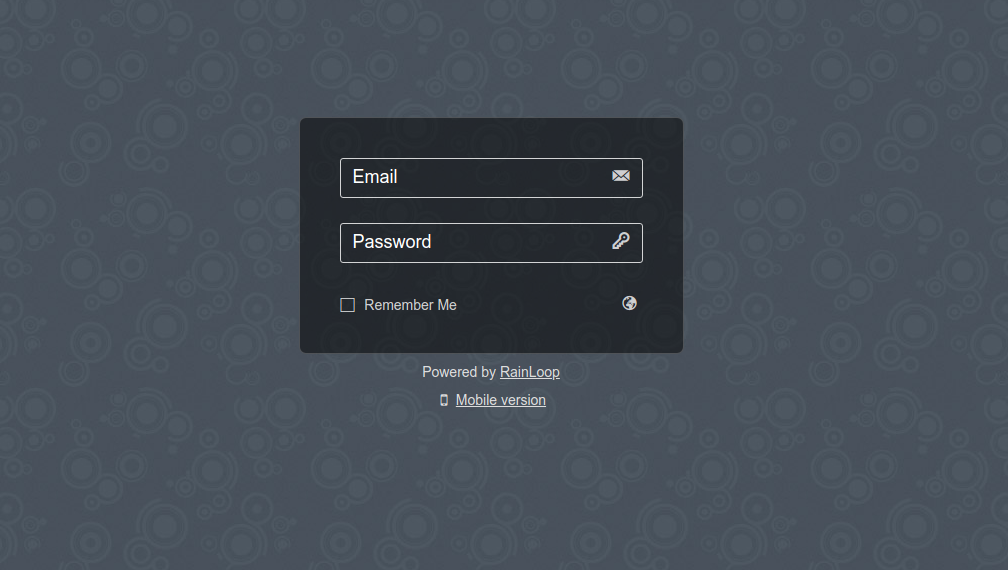
Default Rainloop user and pass to login is:
User: admin
Password: 12345
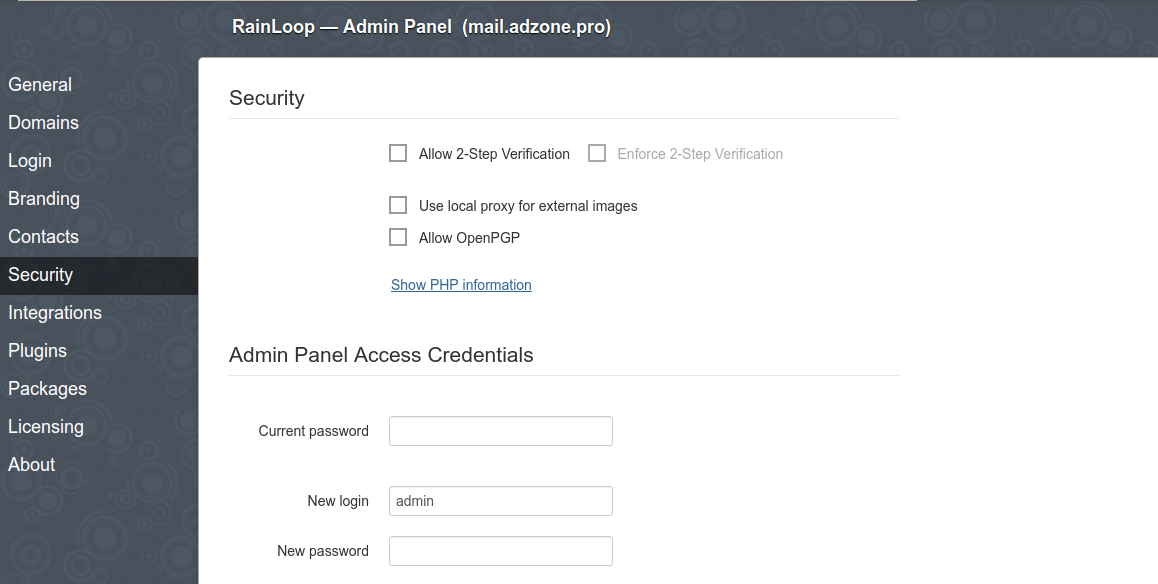
N.B. Please do not forget to change the default password to something more secure right after logging to prevent some malicious users to break in.
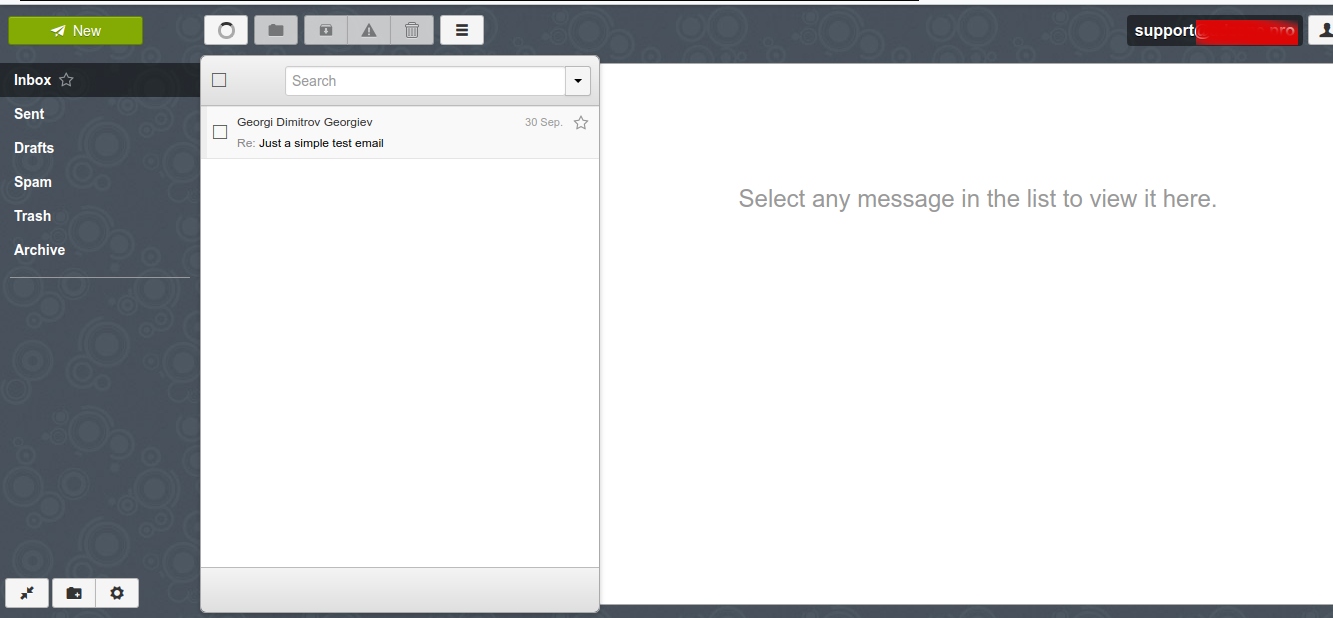
Here is also how Rainloop normal email Send / Receive interface looks like (simplistic and intuitive)
If you want to redirect all Email for a certain user lets say support to another local existing mail address lets say to marketing
echo "support: marketing" >> /etc/aliases
newaliases
The default alias binding in /etc/aliases is for postmaster to deliver all received mails to root mailbox, once added the new alias the newaliases command is used initializes ealias database.
Here is how /etc/aliases looks after above new alias is added
cat /etc/aliases
# See man 5 aliases for format
postmaster: root
support: marketing
What is left is to configure properly is the Domain name DNS records if you will be using an external VirtualHost subdomain that is to be done from your domain registrer (Godaddy, Domain.Com, NameCheap etc.).
We're done with our setup and you can now happily use your Webmail or favourite IMAP client to send / receive mails to recipients. Note that because mail accounts email is to be kept locally on the server as a plain text files it is crucial to secure at max SSH access to the server or even better disable /bin/sh login with usermod command for all used Email addresses.
Here is how to disable interactive SSH / SFTP login to the support local existing UNIX account.
usermod -s /bin/false support
To check the change you can use finger command (assuming you have it installed on the system if not install it with apt install finger)
finger support
Login: support Name: Support
Directory: /home/support Shell: /bin/false
Never logged in.
No mail.
No Plan.
That's all folks, our goal to have an independent (self-owned) Email server from scratch to better Email account privacy is fulfilled.
Now you can be at peace that your email correspondence with friends / relatives / customers will be at your hands only and you and only you will have a sorted view of your Mail stored passwords and personal data over the years.
Enjoy ! 🙂


Baby boomers and Generation X, Y, Z – Generational Marketing and 4 Common personality stereotype traits of people born over the last 60 years
Saturday, August 18th, 2018Those who are employed in the realm of Social or Internet Marketing definitely have to know the existence of at least 4 different conditional stereotypes, these are Baby Boomers and Generation X, Generation Y and Generation Z (Millenials).
According to Socielogist Karl Mannheim (who is among the founding fathers of classical socielogy) – "All members of a generation share a similar collective experience" or in other words people are categorized in generations depending on when they were born.
As stereotypes they're generalization of people born in different periods of time and sharing same or similar traits.
Because of the age and the conditions they grew up and as they share those general spirit of time and age, they tend to be more or less behaving in a similar ways in how they think save / spend money or share some common approach to life choices and attitude towards life and worldview.
But before proceeding to the 4 main cohert provisional stereotypes, its worthy to mention how these four common trait generations came to existence with a little bit of pre-history.
The pre WW I and WW II world situation and the First and Second World War played a pivotal role in forming the social conditions necessery for the development of the baby boomers.
* The depression Era people
Born in period: 1912 – 1921 who came at full maturity around 1930-1939 right in the beginning of WW I (all of whom are already deceased) as of 2018 as a cause of the war uncertainty and the havoc and the war conditions were very conservative, compulsive savers, tried their best to maintain a low debt. They had the mindset (responsibility) to leave some kind of legacy to their children. They were very patriotic, oriented towards work before pleasure, had a great respect for authority and had a strong sense of moral obligation. For all this character traits of this people undoubtfully a key role played the strong belief in God mostly all people had at the time.
The next in line conditional stereotype of people that came to earth are the:
* The World War II Generation
Born in year period: 1922 to 1927 who came to a mature age exactly at the terrible years of Second World War.
People of that time were either fighters for or against the Axis Powers or the Central Powers with the common shared goal to fight against the enemy (of course there are multiple of people who were just trying to survive and not taking a side in this meaningless war).
The current amount of people living are estimated to few million of deathbed elders worldwide.
As above conditional generations types mentioned are of importance for historical reasons and most of the people belonging to those depression pre WWI and WW II era are dead or just a few millions an overall in un less-consuming age (excluding the medicine consumption which is higher compared to youngsters).
I'll further proceed further with the Baby Boomers, GEN X, Y, Zs who are de-facto the still active members participating to society and economy more or less.
So what are these 4 Stereotypes of Generations that and why are so important for the modern marketers or business manager?
1. BABY BOOMERS also called for a short (Boomers)
These are people who have been defined by a birth year range (period) from early to mid 1940s until 1960 and 1964.
In Europe and North America, boomers are widely identified with privilege, as many grew up in a time of widespread government subsidies in post-war housing and education, and increasing affluence.
As a group, baby boomers were considered the wealthiest, most active, and most physically fit generation up to the era in which they arrived, and were amongst the first to grow up genuinely expecting the world to improve with time. They were also the generation that received peak levels of income; they could therefore reap the benefits of abundant levels of food, apparel, retirement programs, and sometimes even "midlife crisis" products. The increased consumerism for this generation has been regularly criticized as excessive (and that's for a good reason).
One feature of the boomers was that they have tended to think of themselves as a special generation, very different from those that had come before or that has come afterward. In the 1960s, as the relatively large numbers of young people became teenagers and young adults, they, and those around them, created a very specific rhetoric around their cohort, and the changes they were bringing about. This rhetoric had an important impact in the self perceptions of the boomers, as well as their tendency to define the world in terms of generations, which was a relatively new phenomenon. The baby boom has been described variously as a "shockwave" and with a methapors such as as "the pig in the python".
2. Generation X / GEN X
Generation X is considered the people born in the following birth year period 1960 forward in time until 1980s. A specific feature in the 60s-80s period was the shifting societal values, perhaps the spring of this generation was also connected to the increasing role and spread of communism in the world.
Sometimes this generation was referred as the "latchkey generation".
The term generation X itself was popularized largely by Douglas Coupland in his novel 1991 novel Generation X Tales for an Accelerated Culture
A very common trait for Generation X was the reduced adult supervision over kids when compared to previous generations a result of increasing divorce rates and the increased role of one parent children upbringing (in most cases that was the mother) which had to be actively involved as a workforce and lacked physically the time to spend enough time with its children and the increased use of childcare options in one parent families.
They were dubbed the "MTV" (Music Television) generation – that was a hit and most popular music TV in the early 1990s.
The kids representing generation X were described as slackers, cynical and disaffected.
The cultural influences dominating the tastes and feelings of the teen masses of that generation was musical genres such as punk music, heavy metal music, grunge and hip-hop and indie films (independent films) produced outside of the major film studio system.
According to many researches in midtime those generation are described as active, happy and achieving a work-life balance kind of lifestyle.
People belonging to Generation X are described as people with Enterpreneural tendencies.
Just to name a few of the celebrities and successful people who belong to this generation, that's Google's founder Sergey Brinn & Larry Page (born in 1973), Richard Stallman (founder of Free Software movement) as well movie and film producer celebrities such as Georgi Clooney, Lenny Kravitz, Quantin Tarantino, Kevin Smith, David Fincher etc.
According to United Kingdom survey study of 2500+ workers conducted by Workfront, GEN X are found to be among the hardest working employees in today's workforce. They are also ranked high by fellow workers for having a strong work ethics (about 59.5%), being helpful (55.4%) and very skilled (54.5%) of respondents as well marked as the best troubleshooters / problem solvers (41.6%) claimed so.
According to research conducted by Viacom, gen x they have a high desire for flexibility and fulfillment at work.
3. Generation Y (Millenials) – GEN Y
Following Generation X came on earth Genreation Y the birth period dated for this kids were years are stretchy year period that this generation is described are years 1980s – 1990s to yearly 2000s where birth period range of those ppl ends.
This kids are descendants of the GEN X and second wave Baby Boomers.
In the public this generation is referred as "echo boomers".
The Millenials characteristics are different based on the region of birth, they're famous for the increased familiarity with communication, media and digital technologies.
There upbringing was marked by increase in liberal approach to politics.
The Great recession crisis of the 2000s played a major impact on this generation because it has caused historical high levels of un-employment among youngsters and led to a possible long term economic and social damage to this generation.
Gen Y according are less brand loyal and the speed of the Internet has led the cohort to be similarly flexible and changing in its fashion, style consciousness and where
and how it is communicated with.
As I am born in 1983 me and my generation belongs to Generation Y and even though Bulgaria before 1991 was a Communist regime country, I should agree that I and many of my friends share a very similar behavior and way of thinking to the GEN Y stereotype described, but as I was born in a times of transition and Bulgaria as a Soviet Union Satellite at the time has been lacking behind in fashion and international culture due to the communist regime, me and my generation seem to be sharing a lot of common stereotype characteristics with Generation X such as the punk-rock, metal, hip-hop culture MTV culture and partly because of the GEN X like overall view on life.
Among most famous representative successful people of the Millenials generation are Mark Zuckerberg (Facebook founder), Prince William (the second in line to the British throne), Kim Jong Un (the leader dictator of North Korea) etc.
4. Generation Z ( GEN Z) / iGeneration / Generation Sensible (Post Millenials)
Following Millenials generation is GEN Z, demographers and researchers typically set as a starting birth date period of those generation 1990s and mid 2000s. As of time of writting there is still no clear consensus regarding ending birth years.
This is the so called Internet Generation because this generation used the internet and Smart Mobile Phone technology since a very young age, they are very confortable with technology (kinda of wired) and addicted to social media such as Facebook / Twitter / Instagram etc. Because of the level of digital communication, many people of this generation are more introvert oriented and often have problems expressing themselves freely in groups. Also they tend to lack the physical communication and more digitally community oriented, even though this depends much also on the specific personality and in some cases it is exactly the opposite.
* Summary
As a Marketer, Human Resources hiring personal specialist, a CEO or some kind of project / business manager it is a good idea to be aware of these 4 common stereotypes. However as this are stereotypes (and a theory) as everything theoritized the data is slighly biased and untrue. The marketer practice shows that whoever conducts a marketing and bases his sales on this theoritizing should consider this to be just one aspect of the marketing campaign those who are trying to sell, stuff ideas or ideology to any of those generation should be careful not to count 100% on the common traits found among the above 4 major groups and consider the individuality of person everyone has and just experiment a little bit to see what works and what doesn't.
Also it should be mentioned these diversification of stereotypes are mostly valid for the US citizens and Westerners but doesn't fully fit to ex-communist countries or countries of the Soviet union, those countries have a slightly different personality traits of person born in any of the year periods defined, same is more or less true for the poor parts of Africa and India, Vietnam, China and mostly all of the coomunist countries ex and current. It should be said that countries who belonged to the Soviet Union many of which are current Russian Federation Republics have a personality traits that are often mixture of the 4 stereotypes and even have a lot of the traits that were typical for the WW I and WW II generations, which makes dealing with this people a very weird experience.
Nomatter the standard error that should always considered when basing a marketing research hypothesis on Generational Marketing (using generational segmentation in marketing best potential customer targets), having a general insight and taking in consideration those stereotypes could seriously help in both marketing as well as HR specific fields like Change Management.
If you're a marketer, I recommend you take a quick look also on following very educative article Generational Makarketing and how to target each of the GEN X, Y, Z and Baby Boomers and what works best for each of them.
Nomatter what just like all Theories, the theory of Boomers and the Generation segmantation is not completely true, but it gives a good soil for reasoning as well definitely helps for people involved in sociology and business.
Comments and feedback on the article are mostly welcome as the topic is very broad and there is much more to be said …
Hope the article was interesting to you ….
What was your Generation like?
Tags: about, Achieving, africa, against, age, ALL, amount, birth, Comments, common, generations, key role, last, MTV, periods, personality, python, time, times, years
Posted in Business Management, Curious Facts, Economy, Educational, Politics, Psychology | No Comments »