![]()
I have recently upgraded a number of machines from Debian 10 Buster to Debian 11 Bullseye. The update as always has some issues on some machines, such as problem with package dependencies, changing a number of external package repositories etc. to match che Bullseye deb packages. On some machines the update was less painful on others but the overall line was that most of the machines after the update ended up with one or more failed systemd services. It could be that some of the machines has already had this failed services present and I never checked them from the previous time update from Debian 9 -> Debian 10 or just some mess I've left behind in the hurry when doing software installation in the past. This doesn't matter anyways the fact was that I had to deal to a number of systemctl services which I managed to track by the Failed service mesage on system boot on one of the physical machines and on the OpenXen VTY Console the rest of Virtual Machines after update had some Failed messages. Thus I've spend some good amount of time like an overall of a day or two fixing strange failed services. This is how this small article was born in attempt to help sysadmins or any home Linux desktop users, who has updated his Debian Linux / Ubuntu or any other deb based distribution but due to the chaotic nature of Linux has ended with same strange Failed services and look for a way to find the source of the failures and get rid of the problems.
Systemd is a very complicated system and in my many sysadmin opinion it makes more problems than it solves, but okay for today's people's megalomania mindset it matches well.
1. Check the journal for errors, running service irregularities and so on
First thing to do to track for errors, right after the update is to take some minutes and closely check,, the journalctl for any strange errors, even on well maintained Unix machines, this journal log would bring you to a problem that is not fatal but still some process or stuff is malfunctioning in the background that you would like to solve:
root@pcfreak:~# journalctl -x
Jan 10 10:10:01 pcfreak CRON[17887]: pam_unix(cron:session): session closed for user root
Jan 10 10:10:01 pcfreak audit[17887]: USER_END pid=17887 uid=0 auid=0 ses=340858 subj==unconfined msg='op=PAM:session_close grantors=pam_loginuid,pam_env,pam_env,pam_permit>
Jan 10 10:10:01 pcfreak audit[17888]: CRED_DISP pid=17888 uid=0 auid=0 ses=340860 subj==unconfined msg='op=PAM:setcred grantors=pam_permit acct="root" exe="/usr/sbin/cron" >
Jan 10 10:10:01 pcfreak CRON[17888]: pam_unix(cron:session): session closed for user root
Jan 10 10:10:01 pcfreak audit[17888]: USER_END pid=17888 uid=0 auid=0 ses=340860 subj==unconfined msg='op=PAM:session_close grantors=pam_loginuid,pam_env,pam_env,pam_permit>
Jan 10 10:10:01 pcfreak audit[17884]: CRED_DISP pid=17884 uid=0 auid=0 ses=340855 subj==unconfined msg='op=PAM:setcred grantors=pam_permit acct="root" exe="/usr/sbin/cron" >
Jan 10 10:10:01 pcfreak CRON[17884]: pam_unix(cron:session): session closed for user root
Jan 10 10:10:01 pcfreak audit[17884]: USER_END pid=17884 uid=0 auid=0 ses=340855 subj==unconfined msg='op=PAM:session_close grantors=pam_loginuid,pam_env,pam_env,pam_permit>
Jan 10 10:10:01 pcfreak audit[17886]: CRED_DISP pid=17886 uid=0 auid=33 ses=340859 subj==unconfined msg='op=PAM:setcred grantors=pam_permit acct="www-data" exe="/usr/sbin/c>
Jan 10 10:10:01 pcfreak CRON[17886]: pam_unix(cron:session): session closed for user www-data
Jan 10 10:10:01 pcfreak audit[17886]: USER_END pid=17886 uid=0 auid=33 ses=340859 subj==unconfined msg='op=PAM:session_close grantors=pam_loginuid,pam_env,pam_env,pam_permi>
Jan 10 10:10:08 pcfreak NetworkManager[696]:[1641802208.0899] device (eth1): carrier: link connected
Jan 10 10:10:08 pcfreak kernel: r8169 0000:03:00.0 eth1: Link is Up – 100Mbps/Full – flow control rx/tx
Jan 10 10:10:08 pcfreak kernel: r8169 0000:03:00.0 eth1: Link is Down
Jan 10 10:10:19 pcfreak NetworkManager[696]:[1641802219.7920] device (eth1): carrier: link connected
Jan 10 10:10:19 pcfreak kernel: r8169 0000:03:00.0 eth1: Link is Up – 100Mbps/Full – flow control rx/tx
Jan 10 10:10:20 pcfreak kernel: r8169 0000:03:00.0 eth1: Link is Down
Jan 10 10:10:22 pcfreak NetworkManager[696]:[1641802222.2772] device (eth1): carrier: link connected
Jan 10 10:10:22 pcfreak kernel: r8169 0000:03:00.0 eth1: Link is Up – 100Mbps/Full – flow control rx/tx
Jan 10 10:10:23 pcfreak kernel: r8169 0000:03:00.0 eth1: Link is Down
Jan 10 10:10:33 pcfreak sshd[18142]: Unable to negotiate with 66.212.17.162 port 19255: no matching key exchange method found. Their offer: diffie-hellman-group14-sha1,diff>
Jan 10 10:10:41 pcfreak NetworkManager[696]:[1641802241.0186] device (eth1): carrier: link connected
Jan 10 10:10:41 pcfreak kernel: r8169 0000:03:00.0 eth1: Link is Up – 100Mbps/Full – flow control rx/tx
If you want to only check latest journal log messages use the -x -e (pager catalog) opts
root@pcfreak;~# journalctl -xe
…
Feb 25 13:08:29 pcfreak audit[2284920]: USER_LOGIN pid=2284920 uid=0 auid=4294967295 ses=4294967295 subj==unconfined msg='op=login acct=28696E76616C>
Feb 25 13:08:29 pcfreak sshd[2284920]: Received disconnect from 177.87.57.145 port 40927:11: Bye Bye [preauth]
Feb 25 13:08:29 pcfreak sshd[2284920]: Disconnected from invalid user ubuntuuser 177.87.57.145 port 40927 [preauth]
Next thing to after the update was to get a list of failed service only.
2. List all systemd failed check services which was supposed to be running
root@pcfreak:/root # systemctl list-units | grep -i failed
● certbot.service loaded failed failed Certbot
● logrotate.service loaded failed failed Rotate log files
● maldet.service loaded failed failed LSB: Start/stop maldet in monitor mode
● named.service loaded failed failed BIND Domain Name Server
Alternative way is with the –failed option
hipo@jeremiah:~$ systemctl list-units –failed
UNIT LOAD ACTIVE SUB DESCRIPTION
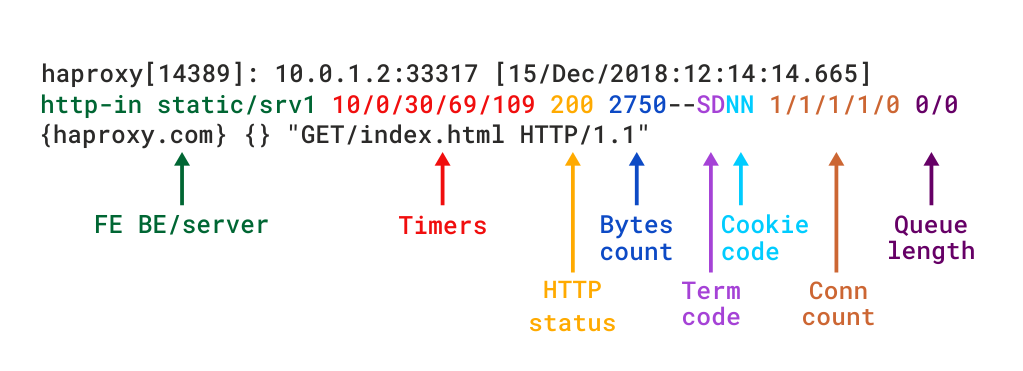
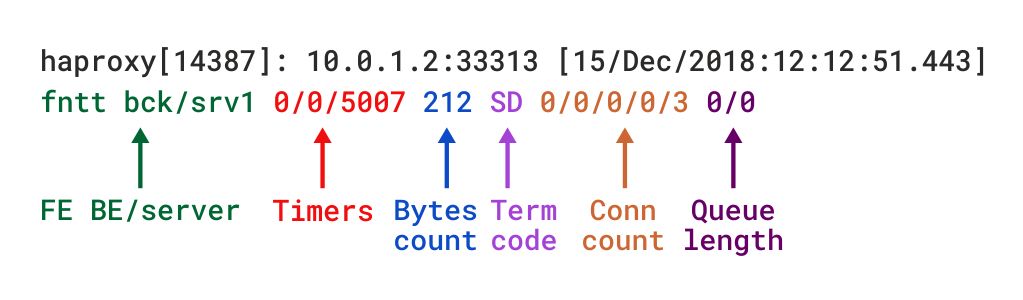
● haproxy.service loaded failed failed HAProxy Load Balancer
● libvirt-guests.service loaded failed failed Suspend/Resume Running libvirt Guests
● libvirtd.service loaded failed failed Virtualization daemon
● nvidia-persistenced.service loaded failed failed NVIDIA Persistence Daemon
● sqwebmail.service masked failed failed sqwebmail.service
● tpm2-abrmd.service loaded failed failed TPM2 Access Broker and Resource Management Daemon
● wd_keepalive.service loaded failed failed LSB: Start watchdog keepalive daemonLOAD = Reflects whether the unit definition was properly loaded.
ACTIVE = The high-level unit activation state, i.e. generalization of SUB.
SUB = The low-level unit activation state, values depend on unit type.
7 loaded units listed.
root@jeremiah:/etc/apt/sources.list.d# systemctl list-units –failed
UNIT LOAD ACTIVE SUB DESCRIPTION
● haproxy.service loaded failed failed HAProxy Load Balancer
● libvirt-guests.service loaded failed failed Suspend/Resume Running libvirt Guests
● libvirtd.service loaded failed failed Virtualization daemon
● nvidia-persistenced.service loaded failed failed NVIDIA Persistence Daemon
● sqwebmail.service masked failed failed sqwebmail.service
● tpm2-abrmd.service loaded failed failed TPM2 Access Broker and Resource Management Daemon
● wd_keepalive.service loaded failed failed LSB: Start watchdog keepalive daemon
To get a full list of objects of systemctl you can pass as state:
# systemctl –state=help
Full list of possible load states to pass is here
Show service properties
Check whether a service is failed or has other status and check default set systemd variables for it.
root@jeremiah~:# systemctl is-failed vboxweb.service
inactive
# systemctl show haproxy
Type=notify
Restart=always
NotifyAccess=main
RestartUSec=100ms
TimeoutStartUSec=1min 30s
TimeoutStopUSec=1min 30s
TimeoutAbortUSec=1min 30s
TimeoutStartFailureMode=terminate
TimeoutStopFailureMode=terminate
RuntimeMaxUSec=infinity
WatchdogUSec=0
WatchdogTimestampMonotonic=0
RootDirectoryStartOnly=no
RemainAfterExit=no
GuessMainPID=yes
SuccessExitStatus=143
MainPID=304858
ControlPID=0
FileDescriptorStoreMax=0
NFileDescriptorStore=0
StatusErrno=0
Result=success
ReloadResult=success
CleanResult=success
…
Full output of the above command is dumped in show_systemctl_properties.txt
3. List all running systemd services for a better overview on what's going on on machine
To get a list of all properly systemd loaded services you can use –state running.
hipo@jeremiah:~$ systemctl list-units –state running|head -n 10
UNIT LOAD ACTIVE SUB DESCRIPTION
proc-sys-fs-binfmt_misc.automount loaded active running Arbitrary Executable File Formats File System Automount Point
cups.path loaded active running CUPS Scheduler
init.scope loaded active running System and Service Manager
session-2.scope loaded active running Session 2 of user hipo
accounts-daemon.service loaded active running Accounts Service
anydesk.service loaded active running AnyDesk
apache-htcacheclean.service loaded active running Disk Cache Cleaning Daemon for Apache HTTP Server
apache2.service loaded active running The Apache HTTP Server
avahi-daemon.service loaded active running Avahi mDNS/DNS-SD Stack
It is useful thing is to list all unit-files configured in systemd and their state, you can do it with:
root@pcfreak:~# systemctl list-unit-files
UNIT FILE STATE VENDOR PRESET
proc-sys-fs-binfmt_misc.automount static –
-.mount generated –
backups.mount generated –
dev-hugepages.mount static –
dev-mqueue.mount static –
media-cdrom0.mount generated –
mnt-sda1.mount generated –
proc-fs-nfsd.mount static –
proc-sys-fs-binfmt_misc.mount disabled disabled
run-rpc_pipefs.mount static –
sys-fs-fuse-connections.mount static –
sys-kernel-config.mount static –
sys-kernel-debug.mount static –
sys-kernel-tracing.mount static –
var-www.mount generated –
acpid.path masked enabled
cups.path enabled enabled
root@pcfreak:~# systemctl list-units –type service –all
UNIT LOAD ACTIVE SUB DESCRIPTION
accounts-daemon.service loaded inactive dead Accounts Service
acct.service loaded active exited Kernel process accounting
● alsa-restore.service not-found inactive dead alsa-restore.service
● alsa-state.service not-found inactive dead alsa-state.service
apache2.service loaded active running The Apache HTTP Server
● apparmor.service not-found inactive dead apparmor.service
apt-daily-upgrade.service loaded inactive dead Daily apt upgrade and clean activities
apt-daily.service loaded inactive dead Daily apt download activities
atd.service loaded active running Deferred execution scheduler
auditd.service loaded active running Security Auditing Service
auth-rpcgss-module.service loaded inactive dead Kernel Module supporting RPCSEC_GSS
avahi-daemon.service loaded active running Avahi mDNS/DNS-SD Stack
certbot.service loaded inactive dead Certbot
clamav-daemon.service loaded active running Clam AntiVirus userspace daemon
clamav-freshclam.service loaded active running ClamAV virus database updater
..

4. Finding out more on why a systemd configured service has failed
Usually getting info about failed systemd service is done with systemctl status servicename.service
However, in case of troubles with service unable to start to get more info about why a service has failed with (-l) or (–full) options
root@pcfreak:~# systemctl -l status logrotate.service
● logrotate.service – Rotate log files
Loaded: loaded (/lib/systemd/system/logrotate.service; static)
Active: failed (Result: exit-code) since Fri 2022-02-25 00:00:06 EET; 13h ago
TriggeredBy: ● logrotate.timer
Docs: man:logrotate(8)
man:logrotate.conf(5)
Process: 2045320 ExecStart=/usr/sbin/logrotate /etc/logrotate.conf (code=exited, status=1/FAILURE)
Main PID: 2045320 (code=exited, status=1/FAILURE)
CPU: 2.479sFeb 25 00:00:06 pcfreak logrotate[2045577]: 2022/02/25 00:00:06| WARNING: For now we will assume you meant to write /32
Feb 25 00:00:06 pcfreak logrotate[2045577]: 2022/02/25 00:00:06| ERROR: '0.0.0.0/0.0.0.0' needs to be replaced by the term 'all'.
Feb 25 00:00:06 pcfreak logrotate[2045577]: 2022/02/25 00:00:06| SECURITY NOTICE: Overriding config setting. Using 'all' instead.
Feb 25 00:00:06 pcfreak logrotate[2045577]: 2022/02/25 00:00:06| WARNING: (B) '::/0' is a subnetwork of (A) '::/0'
Feb 25 00:00:06 pcfreak logrotate[2045577]: 2022/02/25 00:00:06| WARNING: because of this '::/0' is ignored to keep splay tree searching predictable
Feb 25 00:00:06 pcfreak logrotate[2045577]: 2022/02/25 00:00:06| WARNING: You should probably remove '::/0' from the ACL named 'all'
Feb 25 00:00:06 pcfreak systemd[1]: logrotate.service: Main process exited, code=exited, status=1/FAILURE
Feb 25 00:00:06 pcfreak systemd[1]: logrotate.service: Failed with result 'exit-code'.
Feb 25 00:00:06 pcfreak systemd[1]: Failed to start Rotate log files.
Feb 25 00:00:06 pcfreak systemd[1]: logrotate.service: Consumed 2.479s CPU time.
systemctl -l however is providing only the last log from message a started / stopped or whatever status service has generated. Sometimes systemctl -l servicename.service is showing incomplete the splitted error message as there is a limitation of line numbers on the console, see below
root@pcfreak:~# systemctl status -l certbot.service
● certbot.service – Certbot
Loaded: loaded (/lib/systemd/system/certbot.service; static)
Active: failed (Result: exit-code) since Fri 2022-02-25 09:28:33 EET; 4h 0min ago
TriggeredBy: ● certbot.timer
Docs: file:///usr/share/doc/python-certbot-doc/html/index.html
https://certbot.eff.org/docs
Process: 290017 ExecStart=/usr/bin/certbot -q renew (code=exited, status=1/FAILURE)
Main PID: 290017 (code=exited, status=1/FAILURE)
CPU: 9.771sFeb 25 09:28:33 pcfrxen certbot[290017]: The error was: PluginError('An authentication script must be provided with –manual-auth-hook when using th>
Feb 25 09:28:33 pcfrxen certbot[290017]: All renewals failed. The following certificates could not be renewed:
Feb 25 09:28:33 pcfrxen certbot[290017]: /etc/letsencrypt/live/mail.pcfreak.org-0003/fullchain.pem (failure)
Feb 25 09:28:33 pcfrxen certbot[290017]: /etc/letsencrypt/live/www.eforia.bg-0005/fullchain.pem (failure)
Feb 25 09:28:33 pcfrxen certbot[290017]: /etc/letsencrypt/live/zabbix.pc-freak.net/fullchain.pem (failure)
Feb 25 09:28:33 pcfrxen certbot[290017]: 3 renew failure(s), 5 parse failure(s)
Feb 25 09:28:33 pcfrxen systemd[1]: certbot.service: Main process exited, code=exited, status=1/FAILURE
Feb 25 09:28:33 pcfrxen systemd[1]: certbot.service: Failed with result 'exit-code'.
Feb 25 09:28:33 pcfrxen systemd[1]: Failed to start Certbot.
Feb 25 09:28:33 pcfrxen systemd[1]: certbot.service: Consumed 9.771s CPU time.
5. Get a complete log of journal to make sure everything configured on server host runs as it should
Thus to get more complete list of the message and be able to later google and look if has come with a solution on the internet use:
root@pcfrxen:~# journalctl –catalog –unit=certbot
— Journal begins at Sat 2022-01-22 21:14:05 EET, ends at Fri 2022-02-25 13:32:01 EET. —
Jan 23 09:58:18 pcfrxen systemd[1]: Starting Certbot…
░░ Subject: A start job for unit certbot.service has begun execution
░░ Defined-By: systemd
░░ Support: https://www.debian.org/support
░░
░░ A start job for unit certbot.service has begun execution.
░░
░░ The job identifier is 5754.
Jan 23 09:58:20 pcfrxen certbot[124996]: Traceback (most recent call last):
Jan 23 09:58:20 pcfrxen certbot[124996]: File "/usr/lib/python3/dist-packages/certbot/_internal/renewal.py", line 71, in _reconstitute
Jan 23 09:58:20 pcfrxen certbot[124996]: renewal_candidate = storage.RenewableCert(full_path, config)
Jan 23 09:58:20 pcfrxen certbot[124996]: File "/usr/lib/python3/dist-packages/certbot/_internal/storage.py", line 471, in __init__
Jan 23 09:58:20 pcfrxen certbot[124996]: self._check_symlinks()
Jan 23 09:58:20 pcfrxen certbot[124996]: File "/usr/lib/python3/dist-packages/certbot/_internal/storage.py", line 537, in _check_symlinks
root@server:~# journalctl –catalog –unit=certbot|grep -i pluginerror|tail -1
Feb 25 09:28:33 pcfrxen certbot[290017]: The error was: PluginError('An authentication script must be provided with –manual-auth-hook when using the manual plugin non-interactively.')
Or if you want to list and read only the last messages in the journal log regarding a service
root@server:~# journalctl –catalog –pager-end –unit=certbot
…
If you have disabled a failed service because you don't need it to run at all on the machine with:
root@rhel:~# systemctl stop rngd.service
root@rhel:~# systemctl disable rngd.service
And you want to clear up any failed service information that is kept in the systemctl service log you can do it with:
root@rhel:~# systemctl reset-failed
Another useful systemctl option is cat, you can use it to easily list a service it is useful to quickly check what is a service, an actual shortcut to save you from giving a full path to the service e.g. cat /lib/systemd/system/certbot.service
root@server:~# systemctl cat certbot
# /lib/systemd/system/certbot.service
[Unit]
Description=Certbot
Documentation=file:///usr/share/doc/python-certbot-doc/html/index.html
Documentation=https://certbot.eff.org/docs
[Service]
Type=oneshot
ExecStart=/usr/bin/certbot -q renew
PrivateTmp=true
After failed SystemD services are fixed, it is best to reboot the machine and check put some more time to inspect rawly the complete journal log to make sure, no error was left behind.
Closure
As you can see updating a machine from a major to a major version even if you follow the official documentation and you have plenty of experience is always more or a less a pain in the ass, which can eat up much of your time banging your head solving problems with failed daemons issues with /etc/rc.local (which I have faced becase of #/bin/sh -e (which would make /etc/rc.local) to immediately quit if any error from command $? returns different from 0 etc.. The logical questions comes then;
1. Is it really worthy to update at all regularly, especially if you don't know of a famous major Vulnerability 🙂 ?
2. Or is it worthy to update from OS major release to OS major release at all?
3. Or should you only try to patch the service that is exposed to an external reachable computer network or the internet only and still the the same OS release until End of Life (LTS = Long Term Support) as called in Debian or End Of Life (EOL) Cycle as called in RPM based distros the period until the OS major release your software distro has official security patches is reached.
Anyone could take any approach but for my own managed systems small network at home my practice was always to try to keep up2date everything every 3 or 6 months maximum. This has caused me multiple days of irritation and stress and perhaps many white hairs and spend nerves on shit.
4. Based on the company where I'm employed the better strategy is to patch to the EOL is still offered and keep the rule First Things First (FTF), once the EOL is reached, just make a copy of all servers data and configuration to external Data storage, bring up a new Physical or VM and migrate the services.
Test after the migration all works as expected if all is as it should be change the DNS records or Leading Infrastructure Proxies whatever to point to the new service and that's it! Yes it is true that migration based on a full OS reinstall is more time consuming and requires much more planning, but usually the result is much more expected, plus it is much less stressful for the guy doing the job.