If you're into IT industry even if you don't like installing frequently Windows or you're completely Linux / BSD user, you will certainly have a lot of friends which will want help from you to re-install or fix their Windows 7 / 8 / 10 OS. At least this is the case with me every year, I'm kinda of obliged to install fresh windowses on new bought friends or relatives notebooks / desktop PCs.
Of course according to for whom the new Windows OS installed the preferrences of necessery software varies, however more or less there is sort of standard list of Windows Software which is used daily by most of Avarage Computer user, such as:
- CD Mounting ISO software ( VirtualClone Drive )
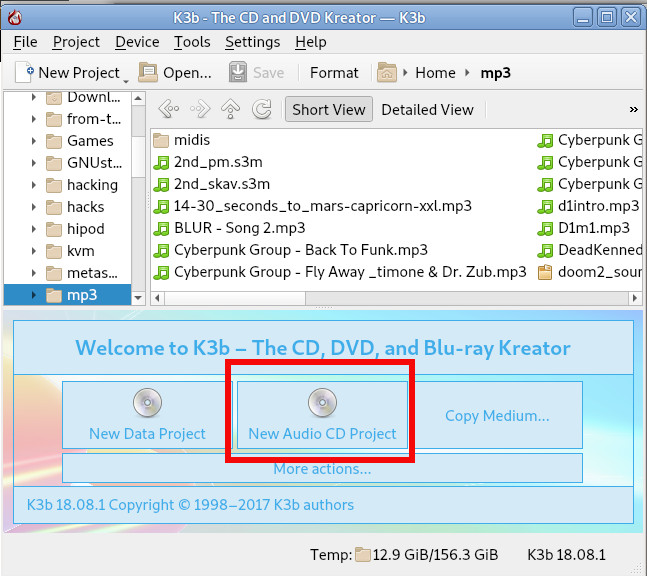
- CD Recording ( CDBurnerXP )
- Archiving / Unarchiving (Zip Rar) Software ( 7-Zip, Winrar, PeaZip )
- Office Software ( Apache Open Office – also known widely as LibreOffice )
- Internet Browsers ( Mozilla Firefox, Opera, Google Chrome )
- Antivirus ( Avira Antivirus or AVG or Kaspersky, Nod32, McAffee (however rarely install non-freeware AV, usually only for companies or organizations) )
- Anti-Malware ( Malware Bytes, SpyBot – Search & Destroy )
- Chat Audio / Video Conferencing ( Skype / Pidgin (ICQ Client) / Telegram (A free software multiple platform Chat messanger alternative to Skype) )
- Video Player ( VLC (Video Lan Client), KMplayer, GOM Player, Quick time, K-lite Codecs )
- Music Player ( Winamp (nowadays discontinued), foobar2000, Audacity )
- Graphic Design / Graphic Editor / Web Design tools ( The Gimp, Inkscape, PhotoShop and CorelDraw )
- Picture Viewer ( IrfanView, FastStone, Picasa )
- Java ( Java 7 / 8 JRE and at some PCs where necessery JDK )
- PDF Viewers / DJViewPDF ( Adobe Acrobat Reader, Foxit Reader, Sumatra PDF, WinDJView )
- Flash Player ( Adobe Shockware Flash player, Adobe Air (install it only on some PCs) )
- SSH Client ( MobaXterm (Home Edition), PuTTY (Free Telnet SSH Client) )
- FTP Client ( WinSCP, FileZilla )
- Programming Text Editor ( Notepad++, Scintilla (SciTE), GVIM, Eclipse (only on developers and programmers PCs) )
- Virtualization Software ( VirtualBox, VMWare (install VMWare only on Admin PCs))
- Remote Desktop and VNC connector program ( RealVNC, TeamViewer )
- Bittorrent Client ( uTorrent or qBittorrent or Transmission )
- E-Mail POP3 / Imap Client ( Mozilla Thunderbird )
- Screenshotting Tool ( GreenShot )
- Password Safe program ( Password Safe or KeePass )
- Remote Backup and Storage (Cloud) synchronization ( Dropbox, GoogleDrive, OneDrive (Comes preinstalled on Win 8.1 and Windows 10 )
- Tools
– UnixUtils – Installs following common Linux command package tools for Windows CLIbc-1.05, bison-1.28, bzip2-1.0.2, diffutils-2.7, fileutils-3.16, findutils-4.1, flex-2.5.4, gawk-3.1.0
grep-2.4.2, gsar110, gzip-1.2.4, indent-2.2.9, jwhois-2.4.1, less-340, m4-1.4, make-3.78.1
patch-2.5, recode-3.6, rman-3.0.7, sed-3.02, shellutils-1.9.4, tar-1.12, textutils-2.1
unrar-3.00, wget-1.8.2, which-2.4– (WinDirStat or SpaceSniffer – Tools that can show you which is the biggest files and directory inside a directory tree)
– WinGrep (Grep: Grep for Windows)
– Everest Home Edition ( Hardware System Information – Shows you what is the PC hardware )
Not to forget a good candidate from the list to install on new fresh windows Installation candidates are:
- Winrar
- PeaZIP
- WinZip
- GreenShot (to be able to easily screenshot stuff and save pictures locally and to the cloud)
- AnyDesk (non free but very functional alternative to TeamViewer) to be able to remotely access remote PC
- TightVNC
- ITunes / Spotify (for people who have also iPhone smart phone)
- DropBox or pCloud (to have some extra cloud free space)
- FBReader (for those reading a lot of books in different formats)
- Rufus – Rufus is an efficient and lightweight tool to create bootable USB drives. It helps you to create BIOS or UEFI bootable devices. It helps you to create Windows TO Go drives. It provides support for various disk, format, and partition.
- Recuva is a data recovery software for Windows 10 (non free)
- EaseUS (for specific backup / restore data purposes but unfortunately (non free)
- For designers
- Adobe Photoshop
- Adobe Illustrator
- f.lux – to control brightness of screen and potentially Save your eyes
- ImDisk virtual Disk Driver
- KeePass / PasswordSafe – to Securely store your passwords
- Putty / MobaXterm / SecureCRT / mPutty (for system administrators and programmers that has to deal with Linux / UNIX)
I tend to install on New Windows installs and thus I have more or less systematized the process.
I try to usually stick to free software where possible for each of the above categories as a Free Software enthusiast and luckily nowadays there is a lot of non-priprietary or at least free as in beer software available out there.
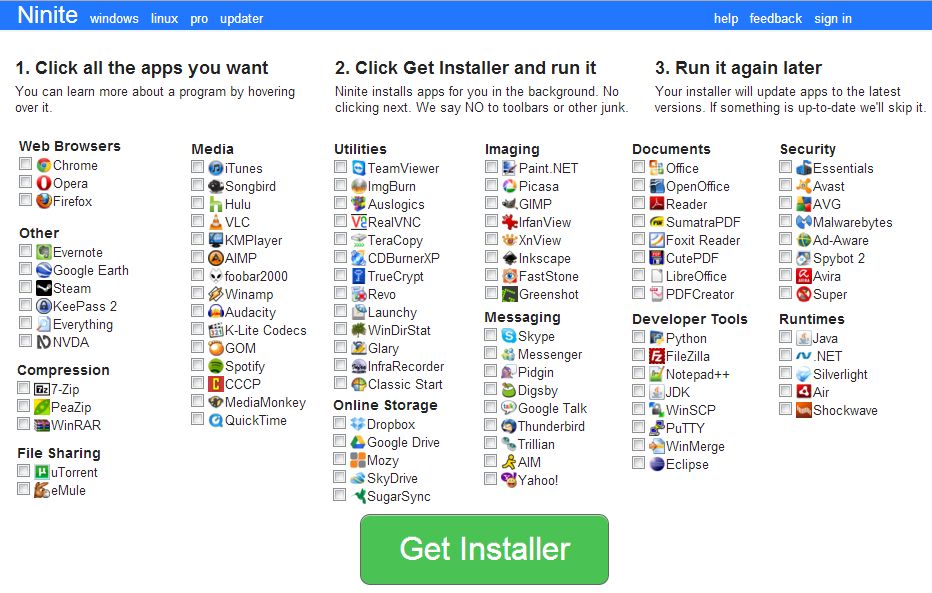
For Windows sysadmins or College and other public institutions networks including multiple of Windows Computers which are not inside a domain and also for people in computer repair shops where daily dozens of windows pre-installs or a set of software Automatic updates are necessery make sure to take a look at Ninite
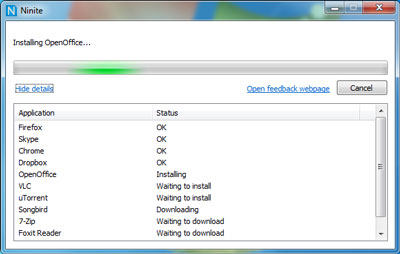
As official website introduces Ninite:
Ninite – Install and Update All Your Programs at Once
Of course as Ninite is used by organizations as NASA, Harvard Medical School etc. it is likely the tool might reports your installed list of Windows software and various other Win PC statistical data to Ninite developers and most likely NSA, but this probably doesn't much matter as this is probably by the moment you choose to have installed a Windows OS on your PC.
For Windows System Administrators managing small and middle sized network PCs that are not inside a Domain Controller, Ninite could definitely save hours and at cases even days of boring install and maintainance work. HP Enterprise or HP Inc. Employees or ex-employees would definitely love Ninite, because what Ninite does is pretty much like the well known HP Internal Tool PC COE.
Ninite could also prepare an installer containing multiple applications based on the choice on Ninite's website, so that's also a great thing especially if you need to deploy a different type of Users PCs (Scientific / Gamers / Working etc.)
Perhaps there are also other useful things to install on a new fresh Windows installations, if you're using something I'm missing let me know in comments.
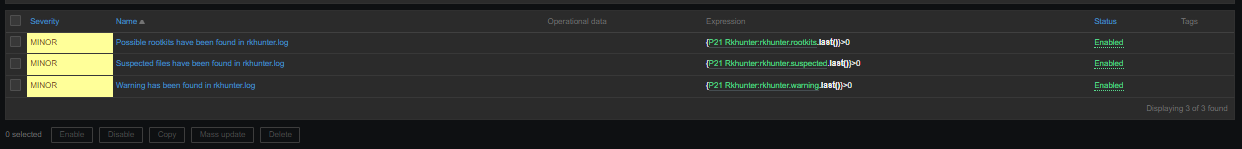


Report haproxy node switch script useful for Zabbix or other monitoring
Tuesday, June 9th, 2020For those who administer corosync clustered haproxy and needs to build monitoring in case if the main configured Haproxy node in the cluster is changed, I've developed a small script to be integrated with zabbix-agent installed to report to a central zabbix server via a zabbix proxy.
The script is very simple it assumed DC1 variable is the default used haproxy node and DC2 and DC3 are 2 backup nodes. The script is made to use crm_mon which is not installed by default on each server by default so if you'll be using it you'll have to install it first, but anyways the script can easily be adapted to use pcs cmd instead.
Below is the bash shell script:
To configure it with zabbix monitoring it can be configured via UserParameterScript.
The way I configured it in Zabbix is as so:
1. Create the userpameter_active_node.conf
Below script is 3 nodes Haproxy cluster
Once pasted to save the file press CTRL + D
The version of the script with 2 nodes slightly improved is like so:
The haproxy_active_DC_zabbix.sh script with a bit of more comments as explanations is available here
2. Configure access for /usr/sbin/crm_mon for zabbix user in sudoers
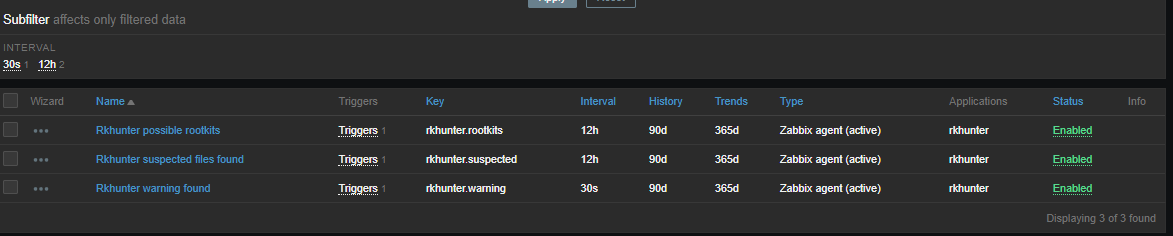
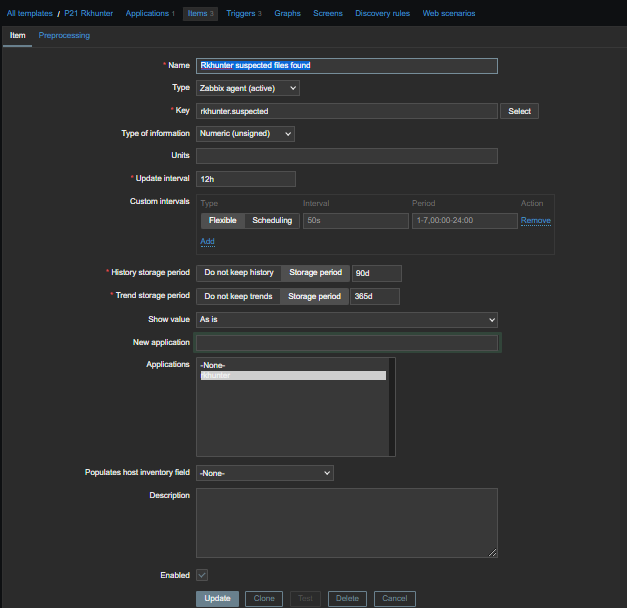
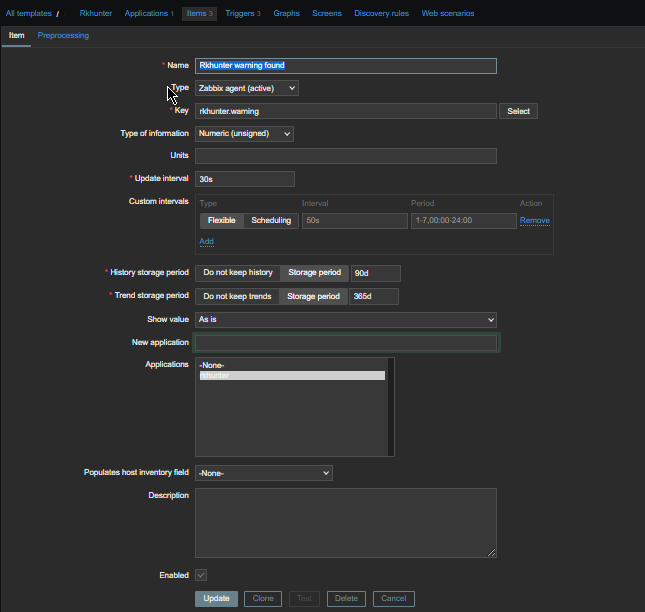
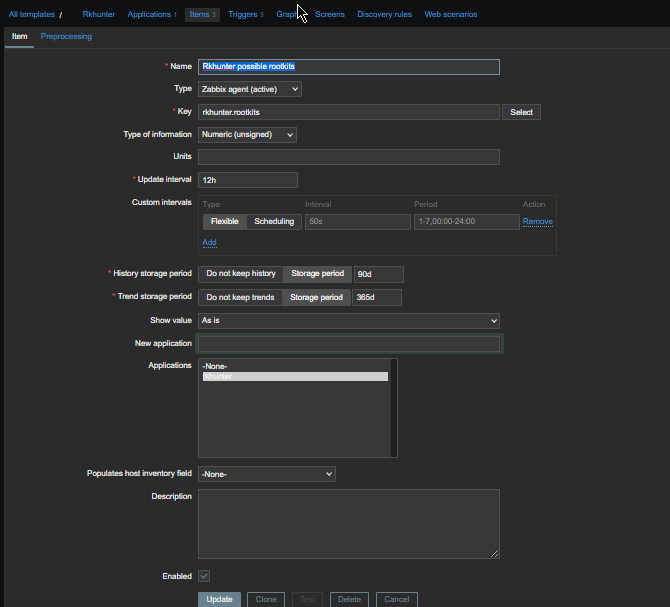
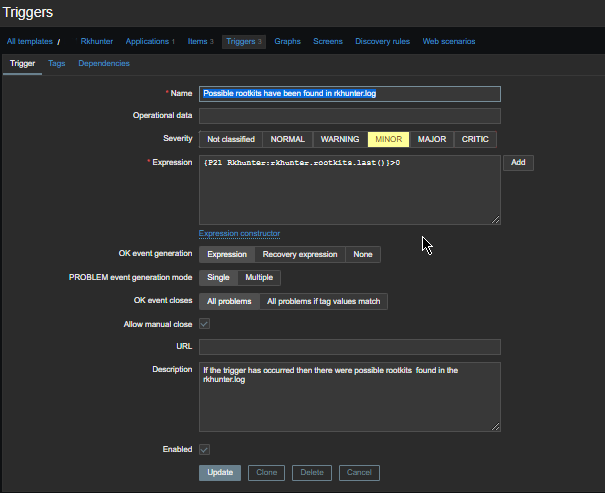
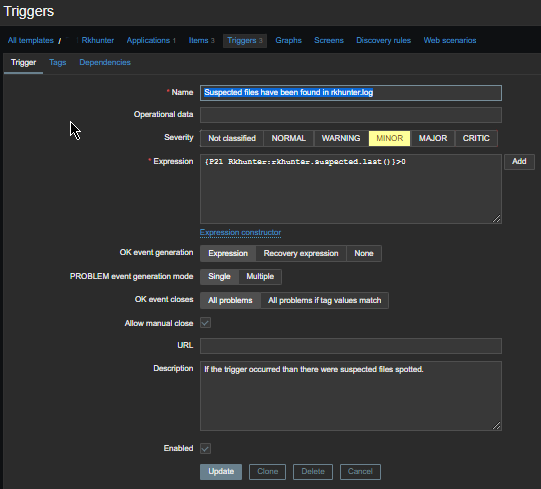
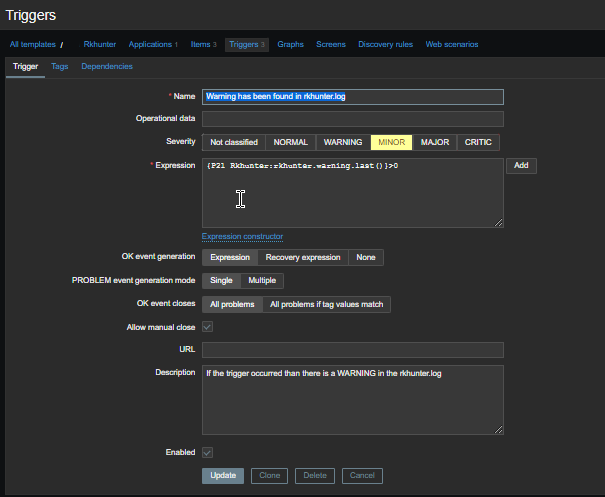
3. Configure in Zabbix for active.dc key Trigger and Item
Tags: access, ALL, and, Anyways, are, available, awk, bash shell, bash shell script, Below, bit, case, cat, Central, check, Cluster, cmd, Comments, conf, configure
Posted in Linux, Monitoring, Zabbix | No Comments »