Posts Tagged ‘nginx’

How to enable output compression (gzipfile content compression) in nginx webserver

Friday, April 8th, 2011

I have recently installed and configured a Debian Linux server with nginx
. Since then I’ve been testing around different ways to optimize the nginx performance.

In my nginx quest, one of the most crucial settings which dramatically improved the end client performance was enabling the so called output compression which in Apache based servers is also known as content gzip compression .
In Apache webservers the content gzip compression is provided by a server module called mod_deflate .

The output compression nginx settings saves a lot of bandwidth and though it adds up a bit more load to the server, the plain text files like html, xml, js and css’s download time reduces drasticly as they’re streamed to the browser in gzip compressed format.
This little improvement in download speed also does impact the overall end user browser experience and therefore improves the browsing speed experience with websites.

If you have already had experience nginx you already know it is a bit fastidious and you have to be very careful with it’s configuration, however thanksfully enabling the gzip compression was actually rather easier than I thought.

Here is what I added in my nginx config to enable output compression:

## Compression
gzip on;
gzip_buffers 16 8k;
gzip_comp_level 9;
gzip_http_version 1.1;
gzip_min_length 0;
gzip_vary on;

Important note here is that need to add this code in the nginx configuration block starting with:

http {
....
## Compression
gzip on;
gzip_buffers 16 8k;
gzip_comp_level 9;
gzip_http_version 1.1;
gzip_min_length 0;
gzip_vary on;

In order to load the gzip output compression as a next step you need to restart the nginx server, either by it’s init script if you use one or by killing the old nginx server instances and starting up the nginx server binary again:
I personally use an init script, so restarting nginx for me is done via the cmd:

debian:~# /etc/init.d/nginx restart
Restarting nginx: nginx.

Now to test if the output gzip compression is enabled for nginx, you can simply use telnet

hipo@linux:~$ telnet your-nginx-webserver-domain.com 80
Escape character is '^]'.

After the Escape character is set ‘^]’ appears on your screen type in the blank space:

HEAD / HTTP/1.0

and press enter twice.
The output which should follow should look like:


HTTP/1.1 200 OK
Server: nginx
Date: Fri, 08 Apr 2011 12:04:43 GMT
Content-Type: text/html
Content-Length: 13
Last-Modified: Tue, 22 Mar 2011 15:04:26 GMT
Connection: close
Vary: Accept-Encoding
Expires: Fri, 15 Apr 2011 12:04:43 GMT
Cache-Control: max-age=604800
Accept-Ranges: bytes

The whole transaction with telnet command issued and the nginx webserver output should look like so:

hipo@linux:~$ telnet your-nginx-webserver-domain.com 80
Trying xxx.xxx.xxx.xxx...
Connected to your-nginx-webserver-domain.com
.Escape character is '^]'.
HEAD / HTTP/1.0

HTTP/1.1 200 OK
Server: nginx
Date: Fri, 08 Apr 2011 12:04:43 GMT
Content-Type: text/html
Content-Length: 13
Last-Modified: Tue, 22 Mar 2011 15:04:26 GMT
Connection: close
Vary: Accept-Encoding
Expires: Fri, 15 Apr 2011 12:04:43 GMT
Cache-Control: max-age=604800
Accept-Ranges: bytes

The important message in the returned output which confirms your nginx output compression is properly configured is:

Vary: Accept-Encoding

If this message is returned by your nginx server, this means your nginx now will distribute it’s content to it’s clients in compressed format and apart from the browsing boost a lot of server and client bandwitdth will be saved.

Fix to “413 Request Entity Too Large” error in Nginx webserver and what causes it

Friday, November 14th, 2014

nginx_413_request_entity_too_large-fix

If you administer NGINX caching server serving static files content and redirecting some requests to Apache and you end up with errors when uploading big files (using HTTP PUT method), even though in Apache's PHP  upload_max_filesize is set to relatively high number upload_max_filesize = 60M.

Here is what happens during hand shake of web-browser -> server interaction 'till status is returned:
 

Web browser or Webcrawler robot goes through the following phases while talking to Web server:


1. Obtain an IP address from the IP name of the site (base on site URL without the leading 'http://'). 
This is provided by domain name servers (DNSs) configured for PC.
2. Open an IP socket connection to that IP address.
3. Write an HTTP data stream through that socket
(4) Receive an HTTP data stream back from the Web server in response. 
This data stream contains status codes whose values are determined by the HTTP protocol
whether successful. 


In the case the is recognized and reported to client 'web browser', causing the error.

The fix is to also increase max file upload limit in NGINX this is done via:
 
client_max_body_size variable in /usr/local/nginx/nginx.conf (or /etc/nginx/nginx.conf whether Nginx is installed from package).
Here is extract from nginx.conf

http {
    include       mime.types;
    default_type  application/octet-stream;
    sendfile        on;
    keepalive_timeout  65;


    server {
        client_max_body_size 60M;
        listen       80;
        server_name  localhost;

        # Main location
        location / {
            proxy_pass         http://127.0.0.1:8000/;
        }
    }
}


To make new configuration active Restart Nginx:

/etc/init.d/nginx restart

Tracking multiple log files in real time in Linux console / terminal (MultiTail)

Monday, July 29th, 2013

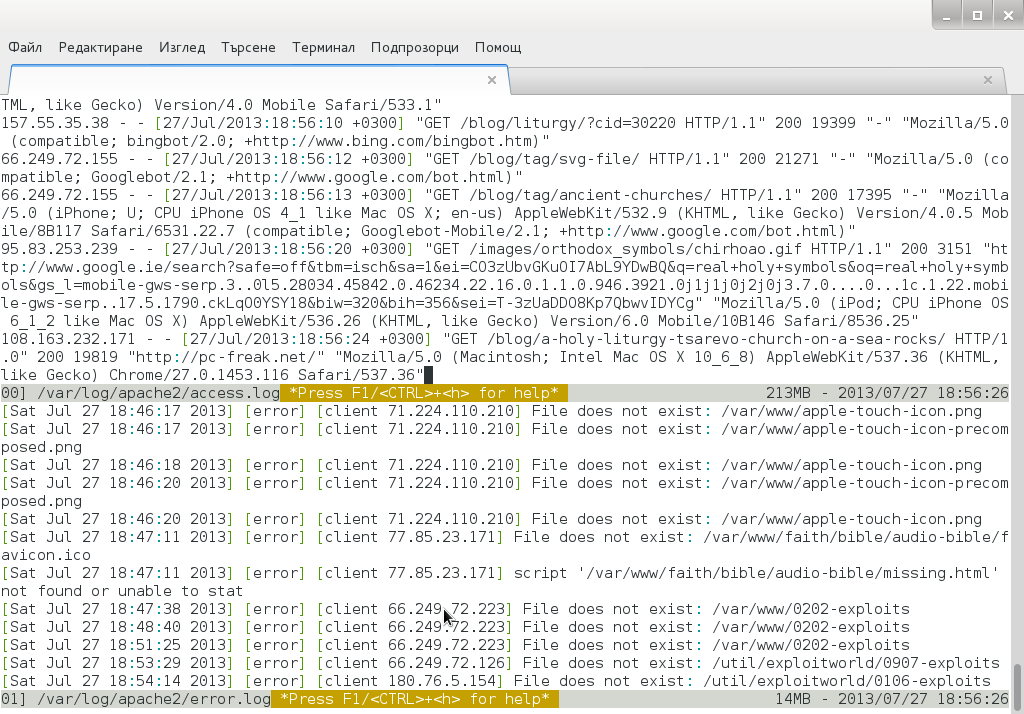
Multitail multiple tail Debian GNU Linux viewing Apache access and error log in shared screen
Whether you have to administer Apache, Nginx or Lighttpd, or whatever other kind of daemon which interactively logs user requests or errors you probably already know well of tail command (tail -f /var/log/apache2/access.log) is something Webserver Linux admin can't live without. Sometimes however you have number of Virtualhost (domains) each configured to log site activity in separate log file. One solution to the problem is to use GNU Screen (screen – terminal emulator) to launch multiple screen session and launch separate tail -f /var/log/apache2/domain1/access.log , tail -f /var/log/apache2/domain2/access.log etc. This however is a bit of hack and except configuring screen to show multiple windows on one Virtual Terminal (tty or vty in gnome), you can't really see output simultaneously in one separated window.

Here is where multitail comes handy. MultiTail is tool to visualize in real time log records output of multiple logs (tails) in one shared terminal Window. MultiTail is written to use ncurses library used by a bunch of other useful tools like Midnight Command so output is colorful and very nice looking.

Here is MultiTail package description on Debian Linux:

linux:~# apt-cache show multitail|grep -i description -A 1
Description-en: view multiple logfiles windowed on console
 multitail lets you view one or multiple files like the original tail

Description-md5: 5e2f688efb214b063bdc418a705860a1
Tag: interface::text-mode, role::program, scope::utility, uitoolkit::ncurses,
root@noah:/home/hipo# apt-cache show multitail|grep -i description -A 1
Description-en: view multiple logfiles windowed on console
 multitail lets you view one or multiple files like the original tail

Description-md5: 5e2f688efb214b063bdc418a705860a1
Tag: interface::text-mode, role::program, scope::utility, uitoolkit::ncurses,
 

Multiple Tail is available across most Linux distributions to install on Debian / Ubuntu / Mint etc. Linux:

debian:~# apt-get install --yes multitail
...

On recent Fedora / RHEL / CentOS etc. RPM based Linuces to install:

[root@centos ~]# yum -y install multitail
...

On FreeBSD multitail is available to install from ports:

freebsd# cd /usr/ports/sysutils/multitail
freebsd# make install clean
...

Once installed to display records in multiple files lets say Apache domain name access.log and error.log

debian:~# multitail -f /var/log/apache2/access.log /var/log/apache2/error.log

It has very extensive help invoked by simply pressing h while running
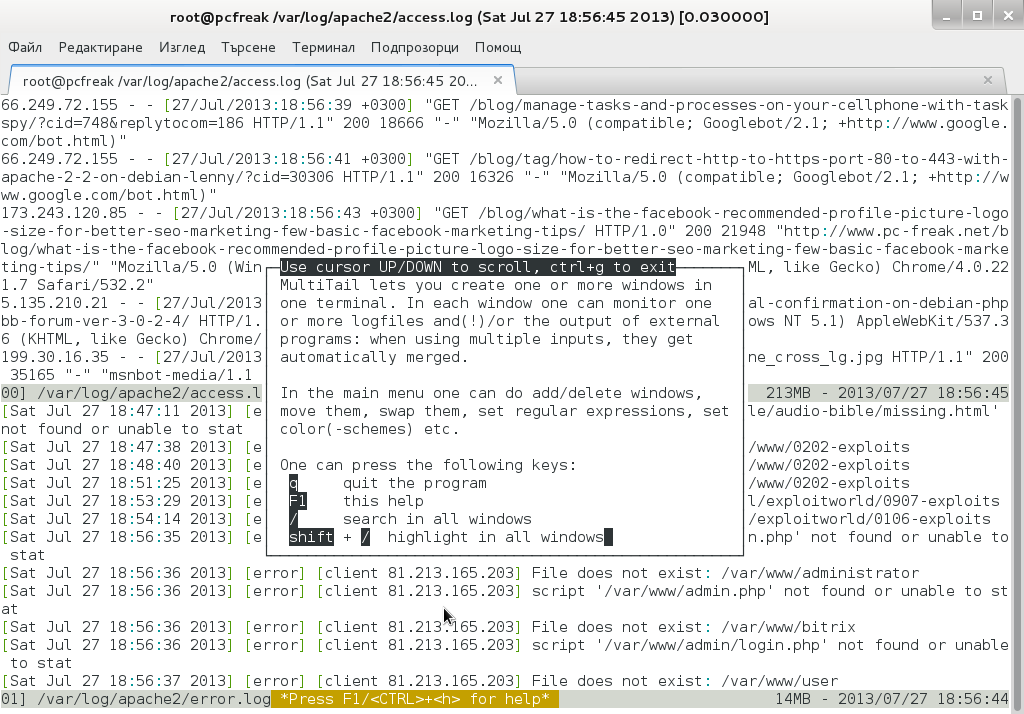
multtail-viewing-in-gnome-shared-screen-debian-2-log-files-screenshot

Even better multitail is written to already have integrated color schemes for most popular Linux services log files
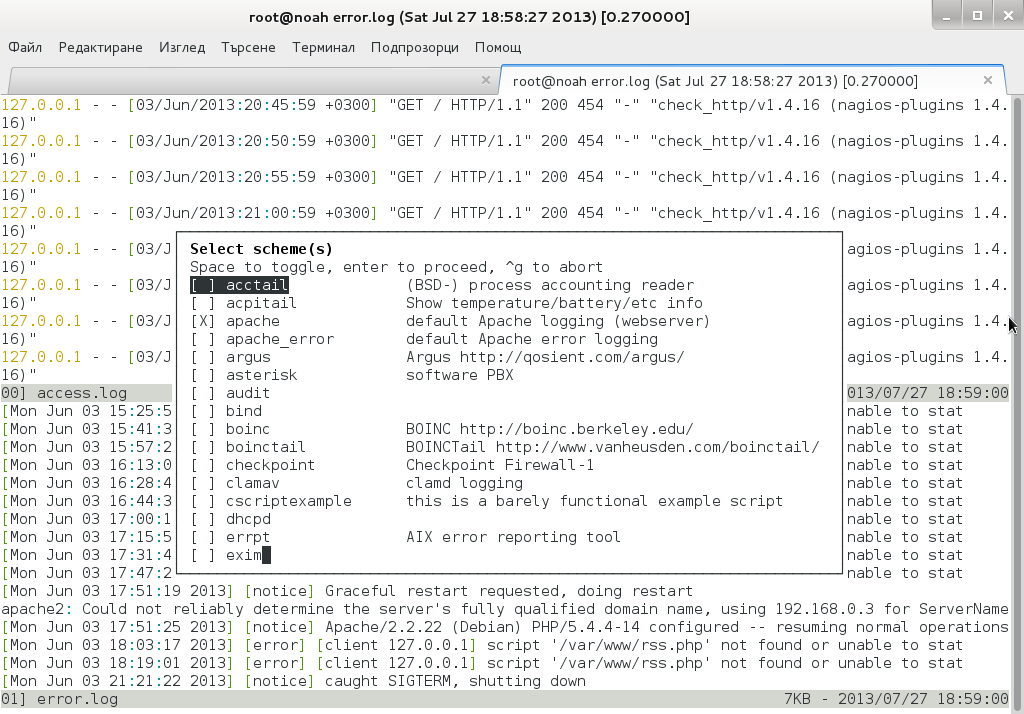
multitail multiple tail debian gnu linux logformat different color schemes screenshot
List of supported MulLog Color schemes as of time of writting article is:

acctail, acpitail, apache, apache_error, argus, asterisk, audit, bind, boinc, boinctail ,checkpoint, clamav, cscriptexample, dhcpd, errrpt, exim, httping, ii, inn, kerberos, lambamoo, liniptfw, log4j, mailscanner, motion, mpstat, mysql, nagtail, netscapeldap, netstat, nttpcache, ntpd, oracle, p0f, portsentry, postfix, pptpd, procmail, qmt-clamd, qmt-send, qmt-smtpd, qmt-sophie, qmt-spamassassin, rsstail, samba, sendmail, smartd, snort spamassassin, squid, ssh, strace, syslog, tcpdump, vmstat, vnetbr, websphere, wtmptail

To tell it what kind of log Color scheme to use from cmd line use:

debian:~# multitail -Csapache /var/log/apache2/access.log /var/log/apache2/error.log
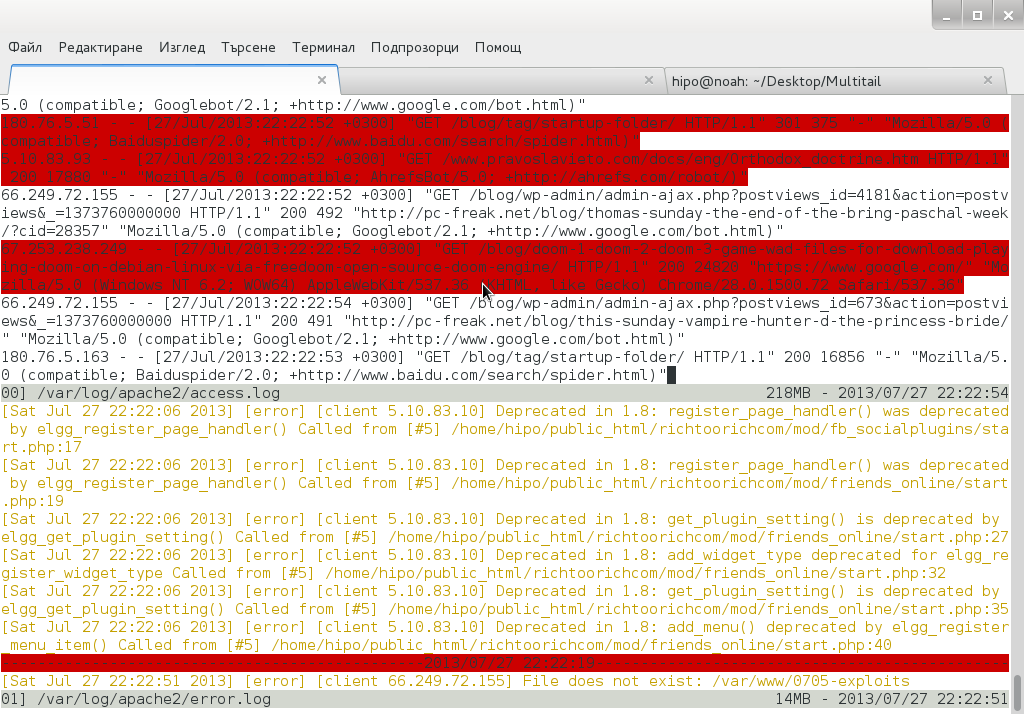
multiple tail with Apache highlight on Debian Linux screenshot

Useful feature is to run command display in separate Windows while still following log output, i.e.:

[root@centos:~]# multitail /var/log/httpd.log -l "netstat -nat"
...

Multitail can also merge output from files in one Window, while in second window some other log or command output is displayed. To merge output from Apache access.log and error.log:

debian:~# multitail /var/log/apache2/access.log -I /var/log/apache2/error.log

When merging two log files output to show in one Window it is useful to display each file output in different color for the sake of readability

For example:
 

debian:~# multitail -ci green /var/log/apache/access.log -ci red -I /var/log/apache/error.log
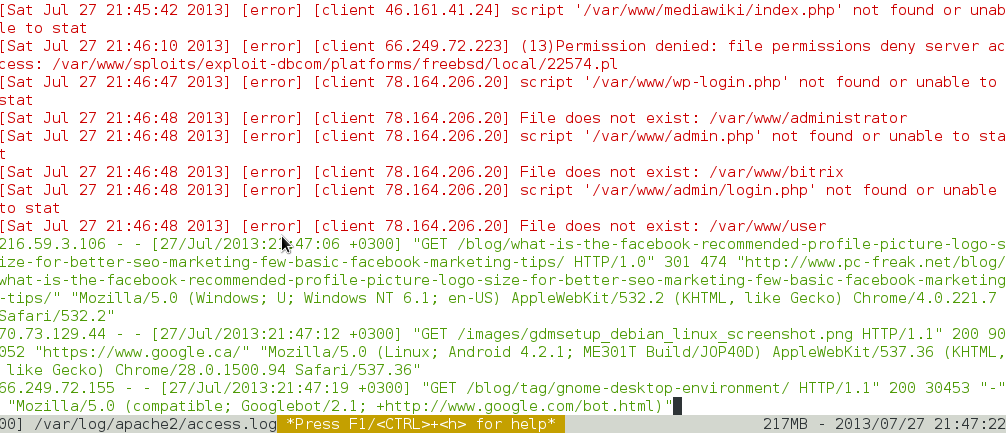
multitail merged Apache access and error log on Debian Linux

To display output from 3 log files in 3 separate shared Windows in console use:

linux:~# multitail -s 2 /var/log/syslog /var/log/apache2/access.log /var/log/apache2/error.log

For some more useful examples, check out MultiTail's official page examples
There is plenty of other useful things to do with multitail, for more RTFM 🙂

How to disable nginx static requests access.log logging

Monday, March 5th, 2012

NGINX logo Static Content Serving Stop logging

One of the companies, where I'm employed runs nginx as a CDN (Content Delivery Network) server.
Actually nginx, today has become like a standard for delivering tremendous amounts of static content to clients.
The nginx, server load has recently increased with the number of requests, we have much more site visitors now.
Just recently I've noticed the log files are growing to enormous sizes and in reality this log files are not used at all.
As I've used disabling of web server logging as a way to improve Apache server performance in past time, I thought of implying the same little "trick" to improve the hardware utilization on the nginx server as well.

To disable logging, I proceeded and edit the /usr/local/nginx/conf/nginx.conf file, commenting inside every occurance of:

access_log /usr/local/nginx/logs/access.log main;

to

#access_log /usr/local/nginx/logs/access.log main;

Next, to load the new nginx.conf settings I did a restart:

nginx:~# killall -9 nginx; sleep 1; /etc/init.d/nginx start

I expected, this should be enough to disable completely access.log, browser request logins. Unfortunately /usr/local/nginx/logs/access.log was still displaying growing with:

nginx:~# tail -f /usr/local/nginx/logs/access.log

After a bit thorough reading of nginx.conf config rules, I've noticed there is a config directive:

access_log off;

Therefore to succesfully disable logging I had to edit config occurance of:

access_log /usr/local/nginx/logs/access.log main

to

After a bit thorough reading of nginx.conf config rules, I've noticed there is a config directive:

access_log off;

Therefore to succesfully disable logging I had to edit config occurance of:

access_log /usr/local/nginx/logs/access.log main

to

access_log /usr/local/nginx/logs/access.log main
access_log off;

Finally to load the new settings, which thanksfully this time worked, I did nginx restart:

nginx:~# killall -9 nginx; sleep 1; /etc/init.d/nginx start

And hooray! Thanks God, now nginx logging is disabled!

As a result, as expected the load avarage on the server reduced a bit 🙂

How to Prevent Server inaccessibility by using a secondary SSH Server access port

Monday, December 12th, 2011

One of the Debian servers’s SSH daemon suddenly become inaccessible today. While trying to ssh I experienced the following error:

$ ssh root@my-server.net -v
OpenSSH_5.8p1 Debian-2, OpenSSL 0.9.8o 01 Jun 2010
debug1: Reading configuration data /etc/ssh/ssh_config
debug1: Applying options for *
debug1: Connecting to mx.soccerfame.com [83.170.104.169] port 22.
debug1: Connection established.
debug1: identity file /home/hipo/.ssh/id_rsa type -1
debug1: identity file /home/hipo/.ssh/id_rsa-cert type -1
debug1: identity file /home/hipo/.ssh/id_dsa type -1
debug1: identity file /home/hipo/.ssh/id_dsa-cert type -1
...
Connection closed by remote host

Interestingly only the SSH server and sometimes the mail server was failing to respond and therefore any mean to access the server was lost. Anyways some of the services on the server for example Nginx continued working just fine.
Some time ago while still working for design.bgweb development company, I’ve experienced some similar errors with SSH servers, so I already had a clue, on a way to work around the issue and to secure myself against the situation to loose access to remote server because the secure shell daemon has broken up.

My work around is actually very simple, I run a secondary sshd (different sshd instance) listening on a different port number.

To do so I invoke the sshd daemon on port 2207 like so:

debian:~# /usr/sbin/sshd -p 2207
debian:~#

Besides that to ensure my sshd -p 2207 will be running on next boot I add:

/usr/sbin/sshd -p 2207

to /etc/rc.local (before the script end line exit 0 ). I do set the sshd -p 2207 to run via /etc/rc.local on purpose instead of directly adding a Port 2207 line in /etc/ssh/sshd_config. The reason, why I’m not using /etc/ssh/sshd_config is that I’m not sure if using the sshd config to set a secondary port does run the port under a different sshd parent. If using the config doesn’t run the separate ssh port under a different server parent this will mean that once the main parent hangs, the secondary port will become inaccessible as well.

How to find out all programs bandwidth use with (nethogs) top like utility on Linux

Friday, September 30th, 2011

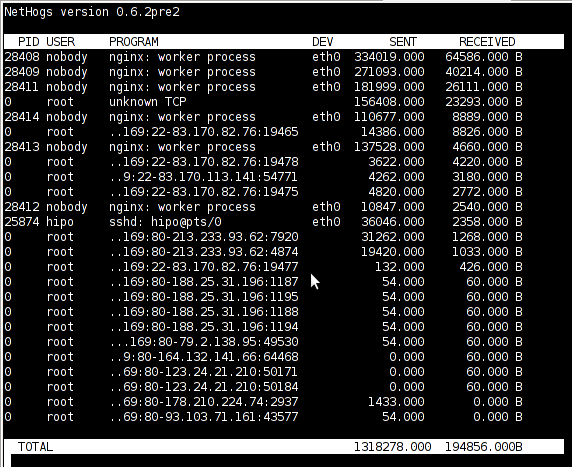
Just run across across a super nice top like, program for system administrators, its called nethogs and is definitely entering my “l337” admin outfit next to tools like iftop, nettop, ettercap, darkstat htop, iotop etc.

nethogs is ultra easy to use, to get immediately in console statistics about running processes UPLOAD and DOWNLOAD bandwidth consumption just run it:

linux:~# nethogs

Nethogs screenshot on Linux Server with Nginx
Nethogs running on Debian GNU/Linux serving static web content with Nginx

If you need to check what program is using what amount of network bandwidth, you will definitely love this tool. Having information of bandwidth consumption is also viewable partially with iftop, however iftop is unable to track the bandwidth consumption to each process using the network thus it seems nethogs is unique at what it does.

Nethogs supports IPv4 and IPv6 as well as supports network traffic over ppp. The tool is available via package repositories for Debian GNU/Lenny 5 and Debian Squeeze 6.

To install Nethogs on CentOS and Fedora distributions, you will have to install it from source. On CentOS 5.7, latest nethogs which as of time of writting this article is 0.8.0 compiles and installs fine with make && make install commands.

In the manner of thoughts of network bandwidth monitoring, another very handy tool to add extra understanding on what kind of traffic is crossing over a Linux server is jnettop
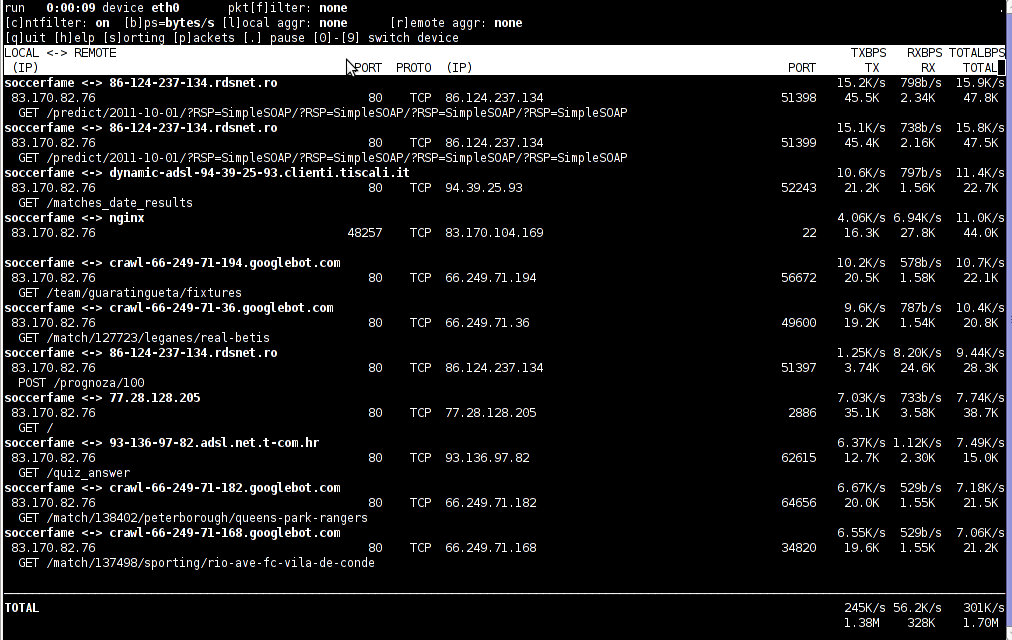
jnettop shows which hosts/ports is taking up the most network traffic.
It is available for install via apt in Debian 5/6).

Here is a screenshot on jnettop in action:

Jnettop check network traffic in console

To install jnettop on latest Fedoras / CentOS / Slackware Linux it has to be download and compiled from source via jnettop’s official wiki page
I’ve tested jnettop install from source on CentOS release 5.7 and it seems to compile just fine using the usual compile commands:

[root@prizebg jnettop-0.13.0]# ./configure
...
[root@prizebg jnettop-0.13.0]# make
...
[root@prizebg jnettop-0.13.0]# make install

If you need to have an idea on the network traffic passing by your Linux server distringuished by tcp/udp/icmp network protocols and services like ssh / ftp / apache, then you will definitely want to take a look at nettop (if of course not familiar with it yet).
Nettop is not provided as a deb package in Debian and Ubuntu, where it is included as rpm for CentOS and presumably Fedora?
Here is a screenshot on nettop network utility in action:

Nettop server traffic division by protocol screenshot
FreeBSD users should be happy to find out that jnettop and nettop are part of the ports tree and the two can be installed straight, however nethogs would not work on FreeBSD, I searched for a utility capable of what Nethogs can, but couldn’t find such.
It seems the only way on FreeBSD to track bandwidth back and from originating process is using a combination of iftop and sockstat utilities. Probably there are other tools which people use to track network traffic to the processes running on a hos and do general network monitoringt, if anyone knows some good tools, please share with me.

Few nginx.conf configuration options for Nginx to improve webserver performance

Tuesday, April 12th, 2011

Nginx server main logo with russian star
From my previous two articles How to install nginx webserver from source on Debian Linux / Install Latest Nginx on Debian and How to enable output compression (gzipfile content compression) in nginx webserver , I have explained how the Nginx server can be installed and configured easily.

As I’m continuing my nginx adventures this days, by trying to take the best out of the installed nginx server, I’ve found few configuration options, which does improve nginx’s server performance and thought it might be nice to share it here in hope that some other nginx novice might benefit out if them.
To setup and start using the options you will have of course to place the conf directives in /usr/local/nginx/conf/nginx.conf or wherever your nginx.conf is located.

The configuration options should be placed in nginx’s conf section which starts up with:

http {

Here are the configuration options useful in hastening my nginx’s performance:

1. General options nginx settings

## General Options
ignore_invalid_headers on;
keepalive_requests 2000;
recursive_error_pages on;
server_name_in_redirect off;
server_tokens off;

2. Connection timeout nginx settings

## Timeouts
client_body_timeout 60;
client_header_timeout 60;
keepalive_timeout 60 60;
send_timeout 60;
expires 24h;

3. server options for better nginx tcp/ip performance

## TCP options
tcp_nodelay on;
tcp_nopush on;

4. Increase the number of nginx worker processes

Somewhere near the beginning of nginx.conf file you should have the directive option:

worker_processes 1;

Make sure you change this option to:

worker_processes 4;

This will increase the number of spawned nginx worker processes in a way that more spawned threaded servers will await for client connections:

Being done with all the above settings, as a next step you have to restart the nginx server, in my case via the init script:

debian:~# /etc/init.d/nginx restart
Restarting nginx: nginx.

Now to check everything is fine with nginx and more specific that the worker_processes 4 options has taken place issue the command:

debian:~# ps axu |grep -i nginx|grep -v grep
root 20456 0.0 0.0 25280 816 ? Ss 10:35 0:00 nginx: master process /usr/local/nginx/sbin/nginx
nobody 20457 0.0 0.0 25844 1820 ? S 10:35 0:00 nginx: worker process
nobody 20458 0.0 0.0 25624 1376 ? S 10:35 0:00 nginx: worker process
nobody 20459 0.0 0.0 25624 1376 ? S 10:35 0:00 nginx: worker process
nobody 20460 0.0 0.0 25624 1368 ? S 10:35 0:00 nginx: worker process

Above you notice the 4 nginx processes running with user nobody, they’re the same configured worker_processes I just pointed out above.