Posts Tagged ‘Disk’

How to check any filesystem for bad blocks using GNU / Linux or FreeBSD with dd

Monday, November 28th, 2011

Check any filesystem partition for BAD BLOCKS with DD on GNU Linux and FreeBSD

Have you looked for a universal physical check up tool to check up any filesystem type existing on your hard drive partitions?
I did! and was more than happy to just recently find out that the small UNIX program dd is capable to check any file system which is red by the Linux or *BSD kernel.

I’ll give an example, I have few partitions on my laptop computer with linux ext3 filesystem and NTFS partition.
My partitions looks like so:

noah:/home/hipo# fdisk -l
Disk /dev/sda: 160.0 GB, 160041885696 bytes
255 heads, 63 sectors/track, 19457 cylinders
Units = cylinders of 16065 * 512 = 8225280 bytes
Sector size (logical/physical): 512 bytes / 512 bytes
I/O size (minimum/optimal): 512 bytes / 512 bytes
Disk identifier: 0x2d92834c
Device Boot Start End Blocks Id System
/dev/sda1 1 721 5786624 27 Unknown
Partition 1 does not end on cylinder boundary.
/dev/sda2 * 721 9839 73237024 7 HPFS/NTFS
/dev/sda3 9839 19457 77263200 5 Extended
/dev/sda5 9839 12474 21167968+ 83 Linux
/dev/sda6 12474 16407 31593208+ 83 Linux
/dev/sda7 16407 16650 1950448+ 82 Linux swap / Solaris
/dev/sda8 16650 19457 22551448+ 83 Linux

For all those unfamiliar with dddd – convert and copy a file this tiny program is capable of copying data from (if) input file to an output file as in UNIX , the basic philosophy is that everything is a file partitions themselves are also files.
The most common use of dd is to make image copies of a partition with any type of filesystem on it and move it to another system
Looking from a Windows user perspective dd is the command line Norton Ghost equivalent for Linux and BSD systems.
The classic way dd is used to copy let’s say my /dev/sda1 partition to another hard drive /dev/hdc1 is by cmds:

noah:/home/hipo# dd if=/dev/sda1 of=/dev/hdc1 bs=16065b

Even though the basic use of dd is to copy files, its flexibility allows a “trick” through which dd can be used to check any partition readable by the operating system kernel for bad blocks

In order to check any of the partitions listed, let’s say the one listed with filesystem HPFS/NTFS on /dev/sda2 using dd

noah:/home/hipo# dd if=/dev/sda2 of=/dev/null bs=1M

As you can see the of (output file) for dd is set to /dev/null in order to prevent dd to write out any output red by /dev/sda2 partition. bs=1M instructs dd to read from /dev/sda2 by chunks of 1 Megabyte in order to accelerate the speed of checking the whole drive.
Decreasing the bs=1M to less will take more time but will make the bad block checking be more precise.
Anyhow in most cases bs of 1 Megabyte will be a good value.

After some minutes (depending on the partition size), dd if, of operations outputs a statistics informing on how dd operations went.
Hence ff some of the blocks on the partition failed to be red by dd this will be shown in the final stats on its operation completion.
The drive, I’m checking does not have any bad blocks and dd statistics for my checked partition does not show any hard drive bad block problems:

71520+1 records in
71520+1 records out
74994712576 bytes (75 GB) copied, 1964.75 s, 38.2 MB/s

The statistics is quite self explanatory my partition of s size 75 GB was scanned for 1964 seconds roughly 32 minutes 46 seconds. The number of records red and written are 71520+1 e.g. (records in / records out). This means that all the records were properly red and wrote to /dev/null and therefore no BAD blocks on my NTFS partition 😉

Easy way to look for irregularities and problems in log files / Facilitate reading log files on GNU / Linux and FreeBSD

Thursday, November 24th, 2011

LogWatch logo picture check Logcheck Linux BSD look for irregularities in log files

As a System Administrator I need to check daily the log files produced on various GNU / Linux distributions or FreeBSD. This can sometimes take too much time if the old fashioned way using the normal system tools cat, less and tail etc. is used.

Reading logs one by one eats too much of my time and often as logs are reviewed in a hurry some crucial system irregularities, failed ssh or POP3 / Imap logins, filling disk spaces etc. are missed.

Therefore I decided to implement automated log parsing programs which will summary and give me an overview (helicopter view) on what were the system activities from the previous day (24h) until the moment I logged the system and issued the log analyzer program.
There are plenty of programs available out there that does “wide scale” log analysis, however there are two applications which on most GNU / Linux and BSD systems had become a de-facto standard programs to scan system log files for interesting lines.

These are:
 

  • 1. logwatchsystem log analyzer and reporter
  • 2. logcheckprogram to scan system log files for interesting lines

1. logwatch is by default installed on most of the Redhat based Linux systems (Fedora, RHEL, CentOS etc.). On Debian distributions and as far as I know (Ubuntu) and the other deb based distros logwatch is not installed by default. Most of the servers I manage these days are running Debian GNU / Linux so, to use logwatch I needed to install it from the available repository package, e.g.:

debian:~# apt-get install logwatch
...

logwatch is written in perl and with some big files to analyze, parsing them might take hell a lot of time. It does use a bunch of configuration scripts which defines how logwatch should read and parse the various services logwatch support by default. These conf scripts are also easily extensible, so if one has to analyze some undefined service in the conf files he can easily come up with a new conf script that will support the service/daemon of choice.Using logwatch is very easy, to get an overview about server system activity invoke the logwatch command:

debian:~# logwatch
################### Logwatch 7.3.6+cvs20080702-debian (07/02/08) ####################
Processing Initiated: Thu Nov 24 05:22:07 2011
Date Range Processed: yesterday
( 2011-Nov-23 )
Period is day.
Detail Level of Output: 0
Type of Output/Format: stdout / text
Logfiles for Host: debian
 ################################################# 

——————— dpkg status changes Begin ————- 

Upgraded:
libfreetype6 2.3.7-2+lenny7 => 2.3.7-2+lenny8
libfreetype6-dev 2.3.7-2+lenny7 => 2.3.7-2+lenny8

———————- dpkg status changes End ————————-

——————— httpd Begin ————————

Requests with error response codes
400 Bad Request
HTTP/1.1: 2 Time(s)
admin/scripts/setup.php: 2 Time(s)
401 Unauthorized


———————- vpopmail End ————————-

——————— Disk Space Begin ————————

Filesystem Size Used Avail Use% Mounted on
/dev/md0 222G 58G 154G 28% /

———————- Disk Space End ————————-

###################### Logwatch End #########################

The execution might take up from 10 to 20 seconds up to 10 or 20 minutes depending on the log files size and the CPU / RAM hardware on the machine where /var/log/… logs will be analyzed.

logwatch output can be easily mailed to a custom mail address using a crontab if the server runs a properly configured SMTP server. Using a cron like:

00 5 * * * /usr/sbin/logwatch | mail -s "$(hostname) log files for $(date)"

Here is time to make a note that logwatch is ported also to FreeBSD and is available from BSD’s port tree, from a port with path:

/usr/ports/security/logcheck

2. logcheck is another handy program, which does very similar job to logwatch . The “interesting” information it returns is a bit less than compared to logwatch

The good thing about logcheck is that by default it is made to mail every 1 hour a brief data summary which might be of an interest to the sys admin.
Logcheck is available for install on RedHat distros via yum and has existing package for Debian as well as a port for FreeBSD under the port location /usr/ports/security/logcheck

To install on logcheck on Debian:

debian:~# apt-get install logcheck
...

After installation I found it wise to change the default mailing time from each and every hour to just once per day to prevent my email from overfilling with “useless” mails.

This is done by editting the default cron tab installed by the package located in /etc/cron.d/logcheck

The default file looks like so:

# /etc/cron.d/logcheck: crontab entries for the logcheck package
PATH=/usr/local/sbin:/usr/local/bin:/sbin:/bin:/usr/sbin:/usr/bin
MAILTO=root
@reboot logcheck if [ -x /usr/sbin/logcheck ]; then nice -n10 /usr/sbin/logcheck -R; fi
2 * * * * logcheck if [ -x /usr/sbin/logcheck ]; then nice -n10 /usr/sbin/logcheck; fi
# EOF

To change it run only once per day its content should looks something like:

# /etc/cron.d/logcheck: crontab entries for the logcheck package
PATH=/usr/local/sbin:/usr/local/bin:/sbin:/bin:/usr/sbin:/usr/bin
MAILTO=root
@reboot logcheck if [ -x /usr/sbin/logcheck ]; then nice -n10 /usr/sbin/logcheck -R; fi
2 5 * * * logcheck if [ -x /usr/sbin/logcheck ]; then nice -n10 /usr/sbin/logcheck; fi
# EOF

Altering it that way the log summary interesting info analysis will be sent on mail every day in 05:02 a.m.
Changing the default email logcheck will ship its log analyzer report emails on deb based distros is done via editting the file:

/etc/logcheck/logcheck.conf

And changing the SENDMAILTO=”” variable to point to the appropriate admin email email addr.
 

How to find out which processes are causing a hard disk I/O overhead in GNU/Linux

Wednesday, September 28th, 2011

iotop monitor hard disk io bottlenecks linux
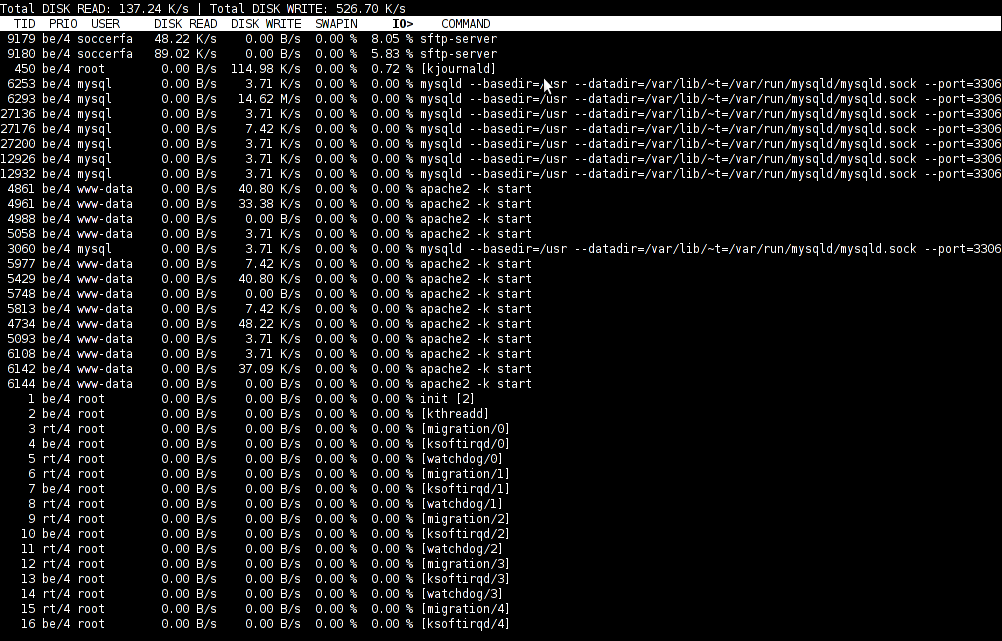
To find out which programs are causing the most read/write overhead on a Linux server one can use iotop

Here is the description of iotop – simple top-like I/O monitor, taken from its manpage.

iotop does precisely the same as the classic linux top but for hard disk IN/OUT operations.

To check the overhead caused by some daemon on the system or some random processes launching iotop without any arguments is enough;

debian:~# iotop

The main overview of iostat statistics, are the:

Total DISK READ: xx.xx MB/s | Total DISK WRITE: xx.xx K/s
If launching iotop, shows a huge numbers and the server is facing performance drop downs, its a symptom for hdd i/o overheads.
iotop is available for Debian and Ubuntu as a standard package part of the distros repositories. On RHEL based Linuxes unfortunately, its not available as RPM.

While talking about keeping an eye on hard disk utilization and disk i/o’s as bottleneck and a possible pitfall to cause a server performance down, it’s worthy to mention about another really great tool, which I use on every single server I administrate. For all those unfamiliar I’m talking about dstat

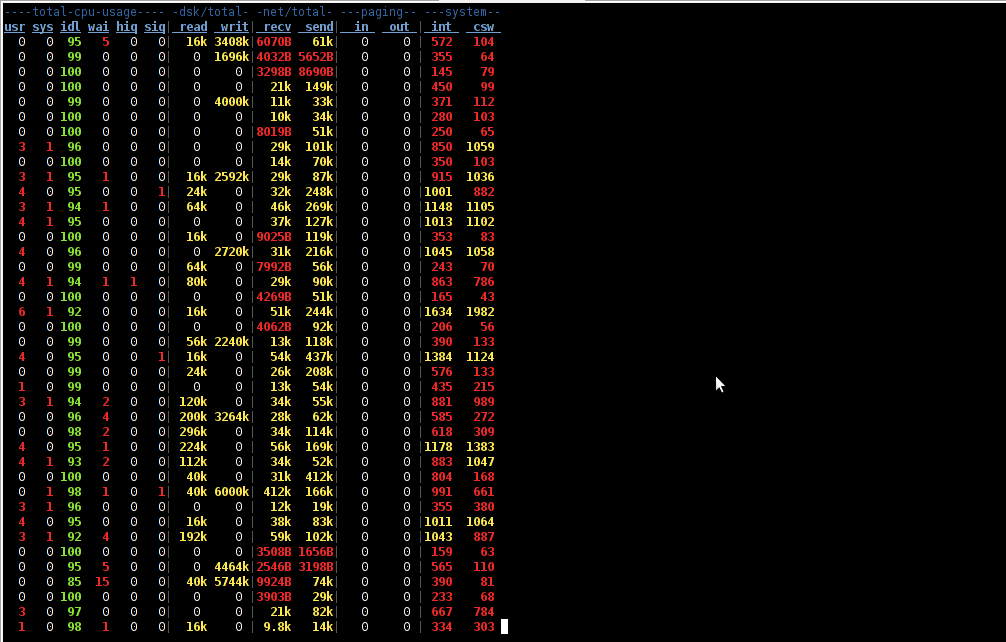
dstat is a – versatile tool for generating system resource statistics as the description on top of the manual states. dstat is great for people who want to have iostat, vmstat and ifstat in one single program.
dstat is nowdays available on most Linux distributions ready to be installed from the respective distro package manager. I’ve used it and I can confirm tt is installable via a deb/rpm package on Fedora, CentOS, Debian and Ubuntu linuces.

Here is how the tool in action looks like:

dstat Linux hdd load stats screenshot

The most interesting things from all the dstat cmd output are read, writ and recv, send , they give a good general overview on hard drive performance and if tracked can reveal if the hdd disk/writes are a bottleneck to create server performance issues.
Another handy tool in tracking hdd i/o problems is iostat its a tool however more suitable for the hard core admins as the tool statistics output is not easily readable.

In case if you need to periodically grasp data about disks read/write operations you will definitely want to look at collectl i/o benchmarking tool .Unfortunately collect is not included as a packaget for most linux distributions except in Fedora. Besides its capabilities to report on servers disk usage, collect is also capable to show brief stats on cpu, network.

Collectl looks really promosing and even seems to be in active development the latest tool release is from May 2011. It even supports NVidia’s GPU monitoring 😉 In short what collectl does is very similar to sysstat which by the way also has some possibilities to track disk reads in time.  collectl’s website praises the tool, much and says that in most machines the extra load the tool would add to a system to generate reports on cpu, disk and disk io is < 0.1%.  I couldn’t find any data online on how much sysstat (sar) extra loads a system. It will be interesting if some of someone concluded some testing and can tell which of the two puts less load on a system.

How to solve qmail /usr/local/bin/tcpserver: libc.so.6: failed to map segment from shared object: Cannot allocate memory

Saturday, April 30th, 2011

If you’re building (compiling) a new qmail server on some Linux host and after properly installing the qmail binaries and daemontools, suddenly you notice in readproctitle service errors: or somewhere in in qmail logs for instance in/var/log/qmail/current the error:

/usr/local/bin/tcpserver: error while loading shared libraries:
libc.so.6: failed to map segment from shared object: Cannot allocate memory

then you have hit a bug caused by insufficient memory assigned for tcpserver in your /var/qmail/supervise/qmail-smtpd/run daemontools qmail-smtpd initialize script:

This kind of issue is quite common especially on hardware architectures that are 64 bit and on Linux installations that are amd65 (x86_64) e.g. run 64 bit version of Linux.

It relates to the 64 bit architecture different memory distribution and thus as I said to solve requires increase in memory softlimit specified in the run script an example good qmail-smtpd run script configuration which fixed the libc.so.6: failed to map segment from shared object: Cannot allocate memory I use currently is as follows:

#!/bin/shQMAILDUID=`id -u vpopmail`NOFILESGID=`id -g vpopmail`MAXSMTPD=`cat /var/qmail/control/concurrencyincoming`# softlimit changed from 8000000exec /usr/local/bin/softlimit -m 32000000 /usr/local/bin/tcpserver -v -H -R -l 0 -x /home/vpopmail/etc/tcp.smtp.cdb -c "$MAXSMTPD"
-u "$QMAILDUID" -g "$NOFILESGID" 0 smtp
/var/qmail/bin/qmail-smtpd
/home/vpopmail/bin/vchkpw /bin/true 2>&1

The default value which was for softlimit was:

exec /usr/local/bin/softlimit -m 8000000

A good softlimit raise up values which in most cases were solving the issue for me are:

exec /usr/local/bin/softlimit -m 3000000

or exec /usr/local/bin/softlimit -m 4000000

The above example run configuration fixed the issue on a amd64 debian 5.0 lenny install, the server hardware was:

CPU: Intel(R) Core(TM)2 Duo CPU @ 2.93GHz
System Memory: 4GB
HDD Disk space: 240GB

The softlimit configuration which I had to setup on another server with system parameters:

Intel(R) Core(TM) i7 CPU (8 CPUS) @ 2.80GHz
System Memory: 8GB
HDD Disk Space: 1.4Terabytes

is as follows:

#!/bin/sh
QMAILDUID=`id -u vpopmail`
NOFILESGID=`id -g vpopmail`
MAXSMTPD=`cat /var/qmail/control/concurrencyincoming`
exec /usr/bin/softlimit -m 64000000
/usr/local/bin/tcpserver -v -H -R -l 0
-x /home/vpopmail/etc/tcp.smtp.cdb -c "$MAXSMTPD"
-u "$QMAILDUID" -g "$NOFILESGID" 0 smtp
/var/qmail/bin/qmail-smtpd
/home/vpopmail/bin/vchkpw /bin/true 2>&1

If none of the two configurations pointed out in the post works, for you just try to manually set up the exec /usr/bin/softlimit -m to some high value.

To assure that the newly set value is not producing the same error you will have to, reload completely the daemontools proc monitor system.
To do so open /etc/inittab comment out the line:

SV:123456:respawn:/command/svscanboot
to
#SV:123456:respawn:/command/svscanboot

Save again /etc/inittab and issue te cmd:

linux:~# init q

Now again open /etc/inittab and uncomment the commented line:

#SV:123456:respawn:/command/svscanboot to
SV:123456:respawn:/command/svscanboot

Lastly reload the inittab script once again with command:

linux:~# init q

To check if the error has disappeared check the readproctitle process, like so:

linux:~# ps ax|grep -i readproctitle

The command output should produce something like:

3070 ? S 0:00 readproctitle service errors: .......................................

Hope that helps.