Posts Tagged ‘index’
Friday, May 13th, 2022 
Haproxy is doing quite a good job in High Availability tasks where traffic towards multiple backend servers has to be redirected based on the available one to sent data from the proxy to.
Lets say haproxy is configured to proxy traffic for App backend machine1 and App backend machine2.
Usually in companies people configure a monitoring like with Icinga or Zabbix / Grafana to keep track on the Application server is always up and running. Sometimes however due to network problems (like burned Network Switch / router or firewall misconfiguration) or even an IP duplicate it might happen that Application server seems to be reporting reachable from some monotoring tool on it but unreachable from Haproxy server -> App backend machine2 but reachable from App backend machine1. And even though haproxy will automatically switch on the traffic from backend machine2 to App machine1. It is a good idea to monitor and be aware that one of the backends is offline from the Haproxy host.
In this article I'll show you how this is possible by using 2 shell scripts and userparameter keys config through the autodiscovery zabbix legacy feature.
Assumably for the setup to work you will need to have as a minimum a Zabbix server installation of version 5.0 or higher.
1. Create the required haproxy_discovery.sh and haproxy_stats.sh scripts
You will have to install the two scripts under some location for example we can put it for more clearness under /etc/zabbix/scripts
[root@haproxy-server1 ]# mkdir /etc/zabbix/scripts
[root@haproxy-server1 scripts]# vim haproxy_discovery.sh
#!/bin/bash
#
# Get list of Frontends and Backends from HAPROXY
# Example: ./haproxy_discovery.sh [/var/lib/haproxy/stats] FRONTEND|BACKEND|SERVERS
# First argument is optional and should be used to set location of your HAPROXY socket
# Second argument is should be either FRONTEND, BACKEND or SERVERS, will default to FRONTEND if not set
#
# !! Make sure the user running this script has Read/Write permissions to that socket !!
#
## haproxy.cfg snippet
# global
# stats socket /var/lib/haproxy/stats mode 666 level admin
HAPROXY_SOCK=""/var/run/haproxy/haproxy.sock
[ -n “$1” ] && echo $1 | grep -q ^/ && HAPROXY_SOCK="$(echo $1 | tr -d '\040\011\012\015')"
if [[ “$1” =~ (25[0-5]|2[0-4][0-9]|[01]?[0-9][0-9]?)\.(25[0-5]|2[0-4][0-9]|[01]?[0-9][0-9]?)\.(25[0-5]|2[0-4][0-9]|[01]?[0-9][0-9]?)\.(25[0-5]|2[0-4][0-9]|[01]?[0-9][0-9]?):[0-9]{1,5} ]];
then
HAPROXY_STATS_IP="$1"
QUERYING_METHOD="TCP"
fi
QUERYING_METHOD="${QUERYING_METHOD:-SOCKET}"
query_stats() {
if [[ ${QUERYING_METHOD} == “SOCKET” ]]; then
echo "show stat" | socat ${HAPROXY_SOCK} stdio 2>/dev/null
elif [[ ${QUERYING_METHOD} == “TCP” ]]; then
echo "show stat" | nc ${HAPROXY_STATS_IP//:/ } 2>/dev/null
fi
}
get_stats() {
echo "$(query_stats)" | grep -v "^#"
}
[ -n “$2” ] && shift 1
case $1 in
B*) END="BACKEND" ;;
F*) END="FRONTEND" ;;
S*)
for backend in $(get_stats | grep BACKEND | cut -d, -f1 | uniq); do
for server in $(get_stats | grep "^${backend}," | grep -v BACKEND | grep -v FRONTEND | cut -d, -f2); do
serverlist="$serverlist,\n"'\t\t{\n\t\t\t"{#BACKEND_NAME}":"'$backend'",\n\t\t\t"{#SERVER_NAME}":"'$server'"}'
done
done
echo -e '{\n\t"data":[\n’${serverlist#,}’]}'
exit 0
;;
*) END="FRONTEND" ;;
esac
for frontend in $(get_stats | grep "$END" | cut -d, -f1 | uniq); do
felist="$felist,\n"'\t\t{\n\t\t\t"{#'${END}'_NAME}":"'$frontend'"}'
done
echo -e '{\n\t"data":[\n’${felist#,}’]}'
[root@haproxy-server1 scripts]# vim haproxy_stats.sh
#!/bin/bash
set -o pipefail
if [[ “$1” = /* ]]
then
HAPROXY_SOCKET="$1"
shift 0
else
if [[ “$1” =~ (25[0-5]|2[0-4][0-9]|[01]?[0-9][0-9]?)\.(25[0-5]|2[0-4][0-9]|[01]?[0-9][0-9]?)\.(25[0-5]|2[0-4][0-9]|[01]?[0-9][0-9]?)\.(25[0-5]|2[0-4][0-9]|[01]?[0-9][0-9]?):[0-9]{1,5} ]];
then
HAPROXY_STATS_IP="$1"
QUERYING_METHOD="TCP"
shift 1
fi
fi
pxname="$1"
svname="$2"
stat="$3"
DEBUG=${DEBUG:-0}
HAPROXY_SOCKET="${HAPROXY_SOCKET:-/var/run/haproxy/haproxy.sock}"
QUERYING_METHOD="${QUERYING_METHOD:-SOCKET}"
CACHE_STATS_FILEPATH="${CACHE_STATS_FILEPATH:-/var/tmp/haproxy_stats.cache}"
CACHE_STATS_EXPIRATION="${CACHE_STATS_EXPIRATION:-1}" # in minutes
CACHE_INFO_FILEPATH="${CACHE_INFO_FILEPATH:-/var/tmp/haproxy_info.cache}" ## unused
CACHE_INFO_EXPIRATION="${CACHE_INFO_EXPIRATION:-1}" # in minutes ## unused
GET_STATS=${GET_STATS:-1} # when you update stats cache outsise of the script
SOCAT_BIN="$(which socat)"
NC_BIN="$(which nc)"
FLOCK_BIN="$(which flock)"
FLOCK_WAIT=15 # maximum number of seconds that "flock" waits for acquiring a lock
FLOCK_SUFFIX='.lock'
CUR_TIMESTAMP="$(date '+%s')"
debug() {
[ “${DEBUG}” -eq 1 ] && echo "DEBUG: $@" >&2 || true
}
debug "SOCAT_BIN => $SOCAT_BIN"
debug "NC_BIN => $NC_BIN"
debug "FLOCK_BIN => $FLOCK_BIN"
debug "FLOCK_WAIT => $FLOCK_WAIT seconds"
debug "CACHE_FILEPATH => $CACHE_FILEPATH"
debug "CACHE_EXPIRATION => $CACHE_EXPIRATION minutes"
debug "HAPROXY_SOCKET => $HAPROXY_SOCKET"
debug "pxname => $pxname"
debug "svname => $svname"
debug "stat => $stat"
# check if socat is available in path
if [ “$GET_STATS” -eq 1 ] && [[ $QUERYING_METHOD == “SOCKET” && -z “$SOCAT_BIN” ]] || [[ $QUERYING_METHOD == “TCP” && -z “$NC_BIN” ]]
then
echo 'ERROR: cannot find socat binary'
exit 126
fi
# if we are getting stats:
# check if we can write to stats cache file, if it exists
# or cache file path, if it does not exist
# check if HAPROXY socket is writable
# if we are NOT getting stats:
# check if we can read the stats cache file
if [ “$GET_STATS” -eq 1 ]
then
if [ -e “$CACHE_FILEPATH” ] && [ ! -w “$CACHE_FILEPATH” ]
then
echo 'ERROR: stats cache file exists, but is not writable'
exit 126
elif [ ! -w ${CACHE_FILEPATH%/*} ]
then
echo 'ERROR: stats cache file path is not writable'
exit 126
fi
if [[ $QUERYING_METHOD == “SOCKET” && ! -w $HAPROXY_SOCKET ]]
then
echo "ERROR: haproxy socket is not writable"
exit 126
fi
elif [ ! -r “$CACHE_FILEPATH” ]
then
echo 'ERROR: cannot read stats cache file'
exit 126
fi
# index:name:default
MAP="
1:pxname:@
2:svname:@
3:qcur:9999999999
4:qmax:0
5:scur:9999999999
6:smax:0
7:slim:0
8:stot:@
9:bin:9999999999
10:bout:9999999999
11:dreq:9999999999
12:dresp:9999999999
13:ereq:9999999999
14:econ:9999999999
15:eresp:9999999999
16:wretr:9999999999
17:wredis:9999999999
18:status:UNK
19:weight:9999999999
20:act:9999999999
21:bck:9999999999
22:chkfail:9999999999
23:chkdown:9999999999
24:lastchg:9999999999
25:downtime:0
26:qlimit:0
27:pid:@
28:iid:@
29:sid:@
30:throttle:9999999999
31:lbtot:9999999999
32:tracked:9999999999
33:type:9999999999
34:rate:9999999999
35:rate_lim:@
36:rate_max:@
37:check_status:@
38:check_code:@
39:check_duration:9999999999
40:hrsp_1xx:@
41:hrsp_2xx:@
42:hrsp_3xx:@
43:hrsp_4xx:@
44:hrsp_5xx:@
45:hrsp_other:@
46:hanafail:@
47:req_rate:9999999999
48:req_rate_max:@
49:req_tot:9999999999
50:cli_abrt:9999999999
51:srv_abrt:9999999999
52:comp_in:0
53:comp_out:0
54:comp_byp:0
55:comp_rsp:0
56:lastsess:9999999999
57:last_chk:@
58:last_agt:@
59:qtime:0
60:ctime:0
61:rtime:0
62:ttime:0
"
_STAT=$(echo -e "$MAP" | grep :${stat}:)
_INDEX=${_STAT%%:*}
_DEFAULT=${_STAT##*:}
debug "_STAT => $_STAT"
debug "_INDEX => $_INDEX"
debug "_DEFAULT => $_DEFAULT"
# check if requested stat is supported
if [ -z “${_STAT}” ]
then
echo "ERROR: $stat is unsupported"
exit 127
fi
# method to retrieve data from haproxy stats
# usage:
# query_stats "show stat"
query_stats() {
if [[ ${QUERYING_METHOD} == “SOCKET” ]]; then
echo $1 | socat ${HAPROXY_SOCKET} stdio 2>/dev/null
elif [[ ${QUERYING_METHOD} == “TCP” ]]; then
echo $1 | nc ${HAPROXY_STATS_IP//:/ } 2>/dev/null
fi
}
# a generic cache management function, that relies on 'flock'
check_cache() {
local cache_type="${1}"
local cache_filepath="${2}"
local cache_expiration="${3}"
local cache_filemtime
cache_filemtime=$(stat -c '%Y' "${cache_filepath}" 2> /dev/null)
if [ $((cache_filemtime+60*cache_expiration)) -ge ${CUR_TIMESTAMP} ]
then
debug "${cache_type} file found, results are at most ${cache_expiration} minutes stale.."
elif "${FLOCK_BIN}" –exclusive –wait "${FLOCK_WAIT}" 200
then
cache_filemtime=$(stat -c '%Y' "${cache_filepath}" 2> /dev/null)
if [ $((cache_filemtime+60*cache_expiration)) -ge ${CUR_TIMESTAMP} ]
then
debug "${cache_type} file found, results have just been updated by another process.."
else
debug "no ${cache_type} file found, querying haproxy"
query_stats "show ${cache_type}" > "${cache_filepath}"
fi
fi 200> "${cache_filepath}${FLOCK_SUFFIX}"
}
# generate stats cache file if needed
get_stats() {
check_cache 'stat' "${CACHE_STATS_FILEPATH}" ${CACHE_STATS_EXPIRATION}
}
# generate info cache file
## unused at the moment
get_info() {
check_cache 'info' "${CACHE_INFO_FILEPATH}" ${CACHE_INFO_EXPIRATION}
}
# get requested stat from cache file using INDEX offset defined in MAP
# return default value if stat is ""
get() {
# $1: pxname/svname
local _res="$("${FLOCK_BIN}" –shared –wait "${FLOCK_WAIT}" "${CACHE_STATS_FILEPATH}${FLOCK_SUFFIX}" grep $1 "${CACHE_STATS_FILEPATH}")"
if [ -z “${_res}” ]
then
echo "ERROR: bad $pxname/$svname"
exit 127
fi
_res="$(echo $_res | cut -d, -f ${_INDEX})"
if [ -z “${_res}” ] && [[ “${_DEFAULT}” != “@” ]]
then
echo "${_DEFAULT}"
else
echo "${_res}"
fi
}
# not sure why we'd need to split on backslash
# left commented out as an example to override default get() method
# status() {
# get "^${pxname},${svnamem}," $stat | cut -d\ -f1
# }
# this allows for overriding default method of getting stats
# name a function by stat name for additional processing, custom returns, etc.
if type get_${stat} >/dev/null 2>&1
then
debug "found custom query function"
get_stats && get_${stat}
else
debug "using default get() method"
get_stats && get "^${pxname},${svname}," ${stat}
fi
! NB ! Substitute in the script /var/run/haproxy/haproxy.sock with your haproxy socket location
You can download the haproxy_stats.sh here and haproxy_discovery.sh here
2. Create the userparameter_haproxy_backend.conf
[root@haproxy-server1 zabbix_agentd.d]# cat userparameter_haproxy_backend.conf
#
# Discovery Rule
#
# HAProxy Frontend, Backend and Server Discovery rules
UserParameter=haproxy.list.discovery[*],sudo /etc/zabbix/scripts/haproxy_discovery.sh SERVER
UserParameter=haproxy.stats[*],sudo /etc/zabbix/scripts/haproxy_stats.sh $2 $3 $4
# support legacy way
UserParameter=haproxy.stat.downtime[*],sudo /etc/zabbix/scripts/haproxy_stats.sh $2 $3 downtime
UserParameter=haproxy.stat.status[*],sudo /etc/zabbix/scripts/haproxy_stats.sh $2 $3 status
UserParameter=haproxy.stat.last_chk[*],sudo /etc/zabbix/scripts/haproxy_stats.sh $2 $3 last_chk
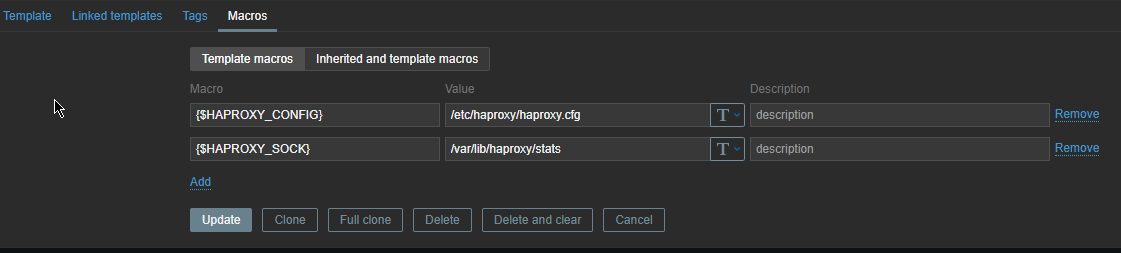
3. Create new simple template for the Application backend Monitoring and link it to monitored host
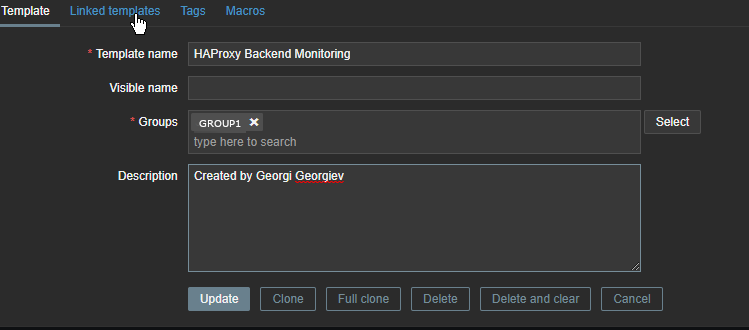
Go to Configuration -> Hosts (find the host) and Link the template to it
4. Restart Zabbix-agent, in while check autodiscovery data is in Zabbix Server
[root@haproxy-server1 ]# systemctl restart zabbix-agent
Check in zabbix the userparameter data arrives, it should not be required to add any Items or Triggers as autodiscovery zabbix feature should automatically create in the server what is required for the data regarding backends to be in.
To view data arrives go to Zabbix config menus:
Configuration -> Hosts -> Hosts: (lookup for the haproxy-server1 hostname)
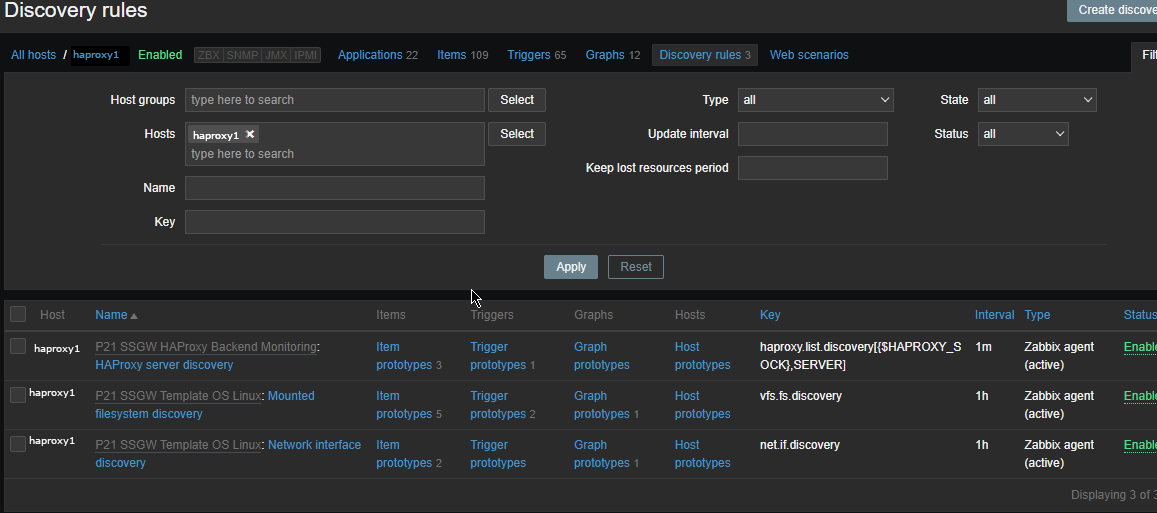
The autodiscovery should have automatically created the following prototypes
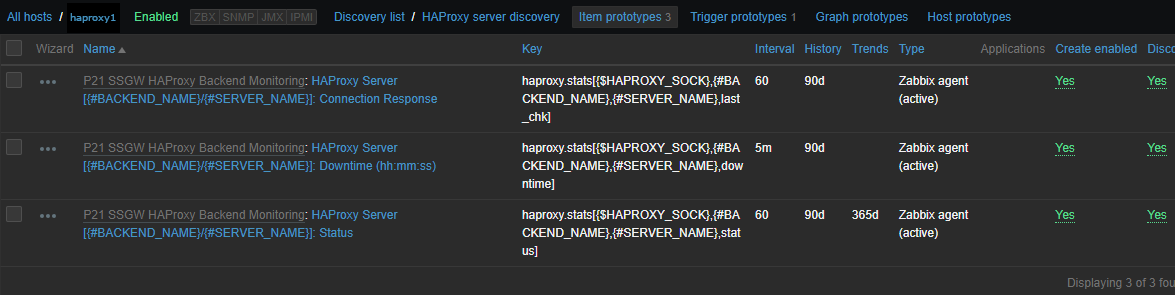
Now if you look inside Latest Data for the Host you should find some information like:
HAProxy Backend [backend1] (3 Items)
HAProxy Server [backend-name_APP/server1]: Connection Response
2022-05-13 14:15:04 History
HAProxy Server [backend-name/server2]: Downtime (hh:mm:ss)
2022-05-13 14:13:57 20:30:42 History
HAProxy Server [bk_name-APP/server1]: Status
2022-05-13 14:14:25 Up (1) Graph
ccnrlb01 HAProxy Backend [bk_CCNR_QA_ZVT] (3 Items)
HAProxy Server [bk_name-APP3/server1]: Connection Response
2022-05-13 14:15:05 History
HAProxy Server [bk_name-APP3/server1]: Downtime (hh:mm:ss)
2022-05-13 14:14:00 20:55:20 History
HAProxy Server [bk_name-APP3/server2]: Status
2022-05-13 14:15:08 Up (1)
To make alerting in case if a backend is down which usually you would like only left thing is to configure an Action to deliver alerts to some email address.
Tags: admin, configured, esac, file, frontend, Haproxy Application, How to, index, information, Network Switch, scripts, servers, shell scripts, sid, Zabbix Server
Posted in Bash Scripting, System Optimization, Zabbix | No Comments »
Sunday, March 18th, 2012 
I've noticed in /var/log/apache2/error.log on one of the Debian servers I manage a lot of warnings and errors produced by tidy – HTML syntax checker and reformatter program.
There were actually quite plenty frequently appearing messages in the the log like:
...

To learn more about HTML Tidy see http://tidy.sourceforge.net

Please fill bug reports and queries using the "tracker" on the Tidy web site.

Additionally, questions can be sent to html-tidy@w3.org

HTML and CSS specifications are available from http://www.w3.org/

Lobby your company to join W3C, see http://www.w3.org/Consortium

line 1 column 1 - Warning: missing <!DOCTYPE> declaration

line 1 column 1 - Warning: plain text isn't allowed in <head> elements

line 1 column 1 - Info: <head> previously mentioned

line 1 column 1 - Warning: inserting implicit <body>

line 1 column 1 - Warning: inserting missing 'title' element

Info: Document content looks like HTML 3.2

4 warnings, 0 errors were found!

...
I did a quick investigation on where from this messages are logged in error.log, and discovered few .php scripts in one of the websites containing the tidy string.
I used Linux find + grep cmds find in all php files the "tidy "string, like so:
server:~# find . -iname '*.php'-exec grep -rli 'tidy' '{}' ;

find . -iname '*.php' -exec grep -rli 'tidy' '{}' ; ./new_design/modules/index.mod.php

./modules/index.mod.php

./modules/index_1.mod.php

./modules/index1.mod.php
Opening the files, with vim to check about how tidy is invoked, revealed tidy calls like:
exec('/usr/bin/tidy -e -ashtml -utf8 '.$tmp_name,$rett);
As you see the PHP programmers who wrote this website, made a bigtidy mess. Instead of using php5's tidy module, they hard coded tidy external command to be invoked via php's exec(); external tidy command invocation.
This is extremely bad practice, since it spawns the command via a pseudo limited apache shell.
I've notified about the issue, but I don't know when, the external tidy calls will be rewritten.
Until the external tidy invocations are rewritten to use the php tidy module, I decided to at least remove the tidy warnings and errors output.
To remove the warning and error messages I've changed:
exec('/usr/bin/tidy -e -ashtml -utf8 '.$tmp_name,$rett);
exec('/usr/bin/tidy --show-warnings no --show-errors no -q -e -ashtml -utf8 '.$tmp_name,$rett);
The extra switches meaning is like so:
q – instructs tidy to produce quiet output
-e – show only errors and warnings
–show warnings no && –show errors no, completely disable warnings and error output
Onwards tidy no longer logs junk messages in error.log Not logging all this useless warnings and errors has positive effect on overall server performance especially, when the scripts, running /usr/bin/tidy are called as frequently as 1000 times per sec. or more
Tags: apache, Auto, body, bug reports, command invocation, consortium, content, CSS, css specifications, declaration, design modules, doctype, document content, Draft, element, element info, elementInfo, elements, exec, exec grep, HEAD, How to, HTML, html syntax checker, iname, index, investigation, isn, line 1, Linux, log, logs, lt, mod, php, php exec, php programmers, php scripts, php5, queries, quot, reformatter, rett, rli, servers, Shell, show, sourceforge, text, tmp, usr bin, validator, vim
Posted in System Administration, Web and CMS | No Comments »
Saturday, March 24th, 2012 
I've written a tiny script to check and restart, Apache if the server encounters, extremely high load avarage like for instance more than (>25). Below is an example of a server reaching a very high load avarage:;
server~:# uptime

13:46:59 up 2 days, 18:54, 1 user, load average: 58.09, 59.08, 60.05

load average: 0.09, 0.08, 0.08
Sometimes high load avarage is not a problem, as the server might have a very powerful hardware. A high load numbers is not always an indicator for a serious problems. Some 16 CPU dual core (2.18 Ghz) machine with 16GB of ram could probably work normally with a high load avarage like in the example. Anyhow as most servers are not so powerful having such a high load avarage, makes the machine hardly do its job routine.
In my specific, case one of our Debian Linux servers is periodically reaching to a very high load level numbers. When this happens the Apache webserver is often incapable to serve its incoming requests and starts lagging for clients. The only work-around is to stop the Apache server for a couple of seconds (10 or 20 seconds) and then start it again once the load avarage has dropped to less than "3".
If this temporary fix is not applied on time, the server load gets increased exponentially until all the server services (ssh, ftp … whatever) stop responding normally to requests and the server completely hangs …
Often this server overloads, are occuring at night time so I'm not logged in on the server and one such unexpected overload makes the server unreachable for hours.
To get around the sudden high periodic load avarage server increase, I've written a tiny bash script to monitor, the server load avarage and initiate an Apache server stop and start with a few seconds delay in between.
#!/bin/sh

# script to check server for extremely high load and restart Apache if the condition is matched

check=`cat /proc/loadavg | sed 's/\./ /' | awk '{print $1}'`

# define max load avarage when script is triggered

max_load='25'

# log file

high_load_log='/var/log/apache_high_load_restart.log';

# location of inidex.php to overwrite with temporary message

index_php_loc='/home/site/www/index.php';

# location to Apache init script

apache_init='/etc/init.d/apache2';

#

site_maintenance_msg="Site Maintenance in progress - We will be back online in a minute";

if [ $check -gt "$max_load" ]; then>

#25 is load average on 5 minutes

cp -rpf $index_php_loc $index_php_loc.bak_ap

echo "$site_maintenance_msg" > $index_php_loc

sleep 15;

if [ $check -gt "$max_load" ]; then

$apache_init stop

sleep 5;

$apache_init restart

echo "$(date) : Apache Restart due to excessive load | $check |" >> $high_load_log;

cp -rpf $index_php_loc.bak_ap $index_php_loc

fi

fi
The idea of the script is partially based on a forum thread – Auto Restart Apache on High Load – http://www.webhostingtalk.com/showthread.php?t=971304Here is a link to my restart_apache_on_high_load.sh script
The script is written in a way that it makes two "if" condition check ups, to assure 100% there is a constant high load avarage and not just a temporal 5 seconds load avarage jump. Once the first if is matched, the script first tries to reduce the server load by overwritting a the index.php, index.html script of the website with a one stating the server is ongoing a maintenance operations.
Temporary stopping the index page, often reduces the load in 10 seconds of time, so the second if case is not necessery at all. Sometimes, however this first "if" condition cannot decrease enough the load and the server load continues to stay too high, then the script second if comes to play and makes apache to be completely stopped via Apache init script do 2 secs delay and launch the apache server again.
The script also logs about, the load avarage encountered, while the server was overloaded and Apache webserver was restarted, so later I can check what time the server overload occured.
To make the script periodically run, I've scheduled the script to launch every 5 minutes as a cron job with the following cron:
# restart Apache if load is higher than 25

*/5 * * * * /usr/sbin/restart_apache_on_high_load.sh >/dev/null 2>&1
I have also another system which is running FreeBSD 7_2, which is having the same overload server problems as with the Linux host.
Copying the auto restart apache on high load script on FreeBSD didn't work out of the box. So I rewrote a little chunk of the script to make it running on the FreeBSD host. Hence, if you would like to auto restart Apache or any other service on FreeBSD server – get /usr/sbin/restart_apache_on_high_load_freebsd.sh my script and set it on cron on your BSD.
This script is just a temporary work around, however as its obvious that the frequency of the high overload will be rising with time and we will need to buy new server hardware to solve permanently the issues, anyways, until this happens the script does a great job 🙂
I'm aware there is also alternative way to auto restart Apache webserver on high server loads through using monit – utility for monitoring services on a Unix system. However as I didn't wanted to bother to run extra services in the background I decided to rather use the up presented script.
Interesting info to know is Apache module mod_overload exists – which can be used for checking load average. Using this module once load avarage is over a certain number apache can stop in its preforked processes current serving request, I've never tested it myself so I don't know how usable it is. As of time of writting it is in early stage version 0.2.2
If someone, have tried it and is happy with it on a busy hosting servers, please share with me if it is stable enough?
Tags: Anyhow, apache server, apache webserver, Auto, avarage, awk print, bak, bash script, bash shell, bash shell script, condition, cron, cron job, Draft, dual core, host, incoming requests, index, index page, init, instance, job, level, level numbers, Linux, linux servers, loc, location, night time, php, quot, Restart, restart apache, rpf, script, server load, server overloads, server services, server uptime, Shell, ssh, ssh ftp, time, unexpected overload, unreachable, utility
Posted in FreeBSD, Programming, System Administration | 5 Comments »
Tuesday, July 29th, 2014 
I took the sacraments this Sunday, and as we're on a holiday and we go to swimming daily. I never swim eucharist in my wife, so a logical came is it allowed to swim after receiving the holy sacraments?
I've googled around to see for an answer but it seems from what I find there is no official plain answer telling whether swimming is allowed or not after communion.
As there is no official church position on this question, this question is solved privately with your priest (spiritual father), if you have such, if not you can do it according to your own conscious.
I've red there are some priests who say, the best practice is not to swim after communion at least 9 hours after holy communion.
For monks the question to swim or not after receiving the holy sacraments is clearly answered as monks are not allowed to go to a beach / undress or wear a swimwear. The reason for that swimming could turn to pleasing the flesh and even a passion in some cases.

For layman swimming is allowed, but it is dangerous to swim for the only reason, one can hurt himself during swimming and there might be bleeding and it is well known rule to try to follow not to have bleeding or open wounds during communion. Of course in some cases for old people who believe and take the holy blood and flesh of the Lord Jesus Christ with permanent open wounds this rule cannot be observed and with such there might be exceptions. But the general rule for healthy people to follow is to preserve themselves from bleeding after receiving holy communion.
Also an interesting thing that is good to observe after communion is not to take haircut on the same day, cut nails and even it is recommended to not take shower the same day.
The reason to generally try to not wash the body is because the blessing and renewal of the body by the holy spirit which is received in form of Christ's blood and flesh is bathing us and we don't want to wash out this blessing.

Of course to shower or not after communion is a personal decision. Also the one of the reasons not to haircut on same day as holy communion is it is usual to get a shower after haircut and it is better not to do that. No bleeding on the same day as communion is because we physically receive holy Christ's body and flesh and his holy gifts run through all our body including in the blood and we don't want to have to waste and "spill" this grace through bleeding.
Also on day of receiving holy sacraments it is church rule not to kiss, not to spit and walking barefoot (for the danger that you can hurt yourself and have a blood spill).

If for some reason you fall and bleed the proper way to deal with the situation is to burn the tissue with the blood.
The number 9 hours to wait is significant in that it reminds us of the hours our Lord Jesus Christ spent to pay our debts with his holy blood and thus grant us salvation. This is the way of the cross starting from 9:00 AM – 6:00 PM, the trial, crucifixion, death, and laying in the tomb took a total of 9 hours.
Also trying consedering not to spit, not chew chewing gum, wash, take shower and kiss is important as it is a mean of watchfulness and as Christians we have to be watchful, at least some minor time after being allowed to re-join the Holy Body of Christ through the holy sacraments gifts in Church.
If you're bringing to communion your kids it is a different story and you can be less vigilent to obseve all this, as it is impossible to know what a kid could do.
It should be known except spitting, right after receiving the holy communion all is not a must observe rules but it is good ones to follow.
Most of the information of this post is based on Coptic Oriental Orthodox forum with questions and answers on wha it is better not to do after communion, anyways as we Eastern Orthodox Chrsitians are so close in faith to Copts, the answers there are true for us too.
Tags: blessing, body, church, church on communion and showering, communion swim allowed, course, flesh, going to beach after communion, holiday, index, information, org, php, question, reason, sacraments, swim after sacraments
Posted in Christianity, Everyday Life, Various | No Comments »
Monday, July 9th, 2012 
2 of the wordpress installations, I take care for had been reported an annoying bug today by some colleagues.
The bug consisted in double trailing slash at the end of the domain url e.g.;
http://our-company-domainname.com//
As a result in the urls everywhere there was the double trailing slash appearing i.e.::
http://our-company-domainname.com//countact-us/

http://our-company-domainname.com//languages/
etc.
The bug was reported to happen in the multiolingual version of the wordpress based sites, as the Qtranslate plugin is used on this installations to achieve multiple languages it seemed at first logical that the double slash domain and url wordpress issues are caused for some reason by qTranslate.
Therefore, I initially looked for the cause of the problem, within the wordpress admin settings for qTranslate plugin. After not finding any clue pointing the bug to be related to qTranslate, I've then checked the settings for each individual wordpress Page and Post (There in posts usually one can manually set the exact url pointing to each post and page).
The double slash appeared also in each Post and Page and it wasn't possible to edit the complete URL address to remove the double trailin slashes. My next assumption was the cause for the double slash appearing on each site link is because of something wrong with the sites .htaccess, therefore I checked in the wp main sites directory .htaccess
Strangely .htacces seemed OKAY and there was any rule that somehow might lead to double slashes in URL. WP-sites .htaccess looked like so:
server:/home/wp-site1/www# cat .htaccess
RewriteEngine On
RewriteBase /
# Rewrite rules for new content and scripts folder
RewriteRule ^jscripts/(.*)$ wp-includes/js/$1
RewriteRule ^gallery/(.*)$ wp-content/uploads/$1
RewriteRule ^modules/(.*)$ wp-content/plugins/$1
RewriteRule ^gui/(.*)/(.*)$ wp-content/themes/$1/$2 [L]
# Disable direct acceees to wp files if referer is not valid
#RewriteCond %{THE_REQUEST} .wp-*
#RewriteCond %{REQUEST_URI} .wp-*
#RewriteCond %{REQUEST_URI} !.*media-upload.php.*
#RewriteCond %{HTTP_REFERER} !.*cadia.*
#RewriteRule . /error404 [L]
# Standard WordPress rewrite
RewriteCond %{REQUEST_FILENAME} !-f
RewriteCond %{REQUEST_FILENAME} !-d
RewriteRule . /index.php [L]
Onwards, I thought a possible way to fix bug by adding mod_rewrite rules in .htaccess which would do a redirect all requests to http://www.our-company-domainname.com//contact-us/ to http://www.our-company-domainname.com//contact-us/ etc. like so:
RewriteRule ^/(.*)$ /$1
This for unknown reasons to me didn't worked either, finally thanks God I remembered to check the variables in wp-config.php (some month ago or so I added there some variables in order to improve the wordpress websites opening times).
I've figured out I did a mistake in one of the variables by adding an ending slash to the URL. The variable added was:
define('WP_HOME','http://our-company-domainname.com/');
whether instead it should be without the ending trailing slash like so:
define('WP_HOME','http://our-company-domainname.com');
By removing the ending trailing slash:
define('WP_HOME','http://our-company-domainname.com/');
to:
define('WP_HOME','http://our-company-domainname.com');
fixed the issue.
Cheers 😉
Tags: annoying bug, assumption, Auto, care, cause, clue, colleagues, content themes, Draft, exact url, FILENAME, folderRewriteRule, GUI, HTTP, index, languages, mod, nbsp, Onwards, page, php, plugin, reason, referer, rewrite, RewriteCond, RewriteEngine, RewriteRule, scripts, slashes, something, standard, Strangely, url address, URLs, Wordpress, wp, WP-sites, www cat
Posted in System Administration, Wordpress | No Comments »
Saturday, July 14th, 2012 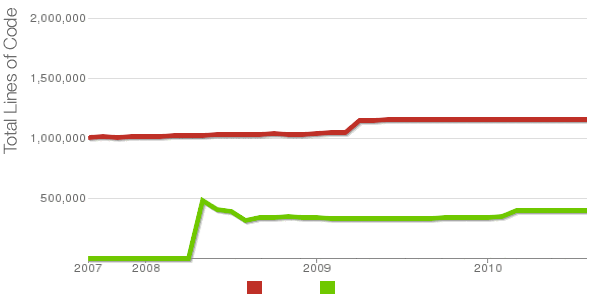
Being able to count the number of PHP source code lines for a website is a major statistical information for timely auditting of projects and evaluating real Project Managment costs. It is inevitable process for any software project evaluation to count the number of source lines programmers has written.
In many small and middle sized software and website development companies, it is the system administrator task to provide information or script quickly something to give info on the exact total number of source lines for projects.
Even for personal use out of curiousity it is useful to know how many lines of PHP source code a wordpress or Joomla website (with the plugins) contains.
Anyone willing to count the number of PHP source code lines under one directory level, could do it with:::
serbver:~# cd /var/www/wordpress-website

server:/var/www/wordpress-website:# wc -l *.php

17 index.php

101 wp-activate.php

1612 wp-app.php

12 wp-atom.php

19 wp-blog-header.php

105 wp-comments-post.php

12 wp-commentsrss2.php

90 wp-config-sample.php

85 wp-config.php

104 wp-cron.php

12 wp-feed.php

58 wp-links-opml.php

59 wp-load.php

694 wp-login.php

236 wp-mail.php

17 wp-pass.php

12 wp-rdf.php

15 wp-register.php

12 wp-rss.php

12 wp-rss2.php

326 wp-settings.php

451 wp-signup.php

110 wp-trackback.php

109 xmlrpc.php

4280 total
This will count and show statistics, for each and every PHP source file within wordpress-website (non-recursively), to get only information about the total number of PHP source code lines within the directory, one could grep it, e.g.:::
server:/var/www/wordpress-website:# wc -l *.php |grep -i '\stotal$'

4280 total
The command grep -i '\stotal$' has \s in beginning and $ at the end of total keyword in order to omit erroneously matching PHP source code file names which contain total in file name; for example total.php …. total_blabla.php …. blabla_total_bla.php etc. etc.
The \s grep regular expression meaning is "put empty space", "$" is placed at the end of tital to indicate to regexp grep only for words ending in string total.
So far, so good … Now it is most common that instead of counting the PHP source code lines for a first directory level to count complete number of PHP, C, Python whatever source code lines recursively – i. e. (a source code of website or projects kept in multiple sub-directories). To count recursively lines of programming code for any existing filesystem directory use find in conjunction with xargs:::
server:/var/www/wp-website1# find . -name '*.php' | xargs wc -l

1079 ./wp-admin/includes/file.php

2105 ./wp-admin/includes/media.php

103 ./wp-admin/includes/list-table.php

1054 ./wp-admin/includes/class-wp-posts-list-table.php

105 ./wp-admin/index.php

109 ./wp-admin/network/user-new.php

100 ./wp-admin/link-manager.php

410 ./wp-admin/widgets.php

108 ./wp-content/plugins/akismet/widget.php

104 ./wp-content/plugins/google-analytics-for-wordpress/wp-gdata/wp-gdata.php

104 ./wp-content/plugins/cyr2lat-slugs/cyr2lat-slugs.php

,,,,

652239 total
As you see the cmd counts and displays the number of source code lines encountered in each and every file, for big directory structures the screen gets floated and passing | less is nice, e.g.:
find . -name '*.php' | xargs wc -l | less
Displaying lines of code for each file within the directories is sometimes unnecessery, whether just a total number of programming source code line is required, hence for scripting purposes it is useful to only get the source lines total num:::
server:/var/www/wp-website1# find . -name '*.php' | xargs wc -l | grep -i '\stotal$'
Another shorter and less CPU intensive one-liner to calculate the lines of codes is:::
server:/var/www/wp-website1# ( find ./ -name '*.php' -print0 | xargs -0 cat ) | wc -l
Here is one other shell script which displays all file names within a directory with the respective calculated lines of code
For more professional and bigger projects using pure Linux bash and command line scripting might not be the best approach. For counting huge number of programming source code and displaying various statistics concerning it, there are two other tools – SLOCCount
as well as clock (count lines of code)
Both tools, are written in Perl, so for IT managers concerned for speed of calculating projects source (if too frequent source audit is necessery) this tools might be a bit sluggish. However for most projects they should be of a great add on value, actually SLOCCount was already used for calculating the development costs of GNU / Linux and other projects of high importance for Free Software community and therefore it is proven it works well with ENORMOUS software source line code calculations written in programming languages of heterogenous origin.
sloccount and cloc packages are available in default Debian and Ubuntu Linux repositories, so if you're a Debilian user like me you're in luck:::
server:~# apt-cache search cloc$

cloc - statistics utility to count lines of code

server:~# apt-cache search sloccount$

sloccount - programs for counting physical source lines of code (SLOC)
Well that's all folks, Cheers en happy counting 😉
Tags: Auto, blabla, code, cron, curiousity, cyr, directory level, Draft, expression, file, file names, header php, index, info, information, level, mail php, middle, number, opml, personal use, php, programmers, project, project evaluation, project managment, quot, rdf, script, show, SLOCCount, software, software project, something, source code, source file, source lines, statistical information, system administrator, totalThe, website server, Wordpress, wp
Posted in Business Management, Programming, System Administration | 2 Comments »
Tuesday, April 5th, 2011 For a number of time I’ve been planning to change my blog comments placement. Until this very day however I’ve kept the default wordpress theme’s Comments button placement.
I realize the default Comments button placement is a bit hard to see and not that much intuitive for the user that enters my blog for a first time.
My first guess was that there might be somewhere a wordpress plugin which will allow me to adjust my comments button placement.
After some research online and a realization that probably there is no such plugin existing yet. I’ve forced myself to tune it up myself.
It was clear to me that in order to change the it will be necessery to edit the WordPress templates files. I’m not a designer and when I hear about templates I usually get scared, however I took the time to take a look at the default wordpress template and find out actually that template modifications is actually rather easier than I thought.
My previous idea was that in order to edit templates you have to be some kind of CSS and HTML guru (which I’m not). Nevertheless it seems that in order to play and adjust in a good way the templates you don’t need ot be a pro.
Even an uneducated fool like myself can easily do almost everything he thinks of throughout few lines of code in the wp templates.
To get back to the major topic thanks God after a bit of review and reading of wordpress.org documentation and some user forums. I’ve figured out that in order to change my Comments placement you need to modify the file:
- blog/wp-content/themes/default/index.php
In index.php find the line starting with:
You will notice within this opened paragraph the php code:
<?php the_tags('Tags: ', ', ', '

'); ?> Posted in <?php the_category(', ') ?>

| <?php edit_post_link('Edit', '', ' | '); ?>

<?php comments_popup_link('No Comments »', '1 Comment »', '% Comments »'); ?>
This is the actual default theme php code that makes the wordpress Comments or No Comments that maes the comments appear on the blog.
Now I’ve decided to let this be as it is but add one more Comment button to wordpress on a different location that is more appealing to my blog visitors
After quick evaluation I’ve determined that probably the best location that the Comments button should have is right after the end of the post text
If you think my idea for button placement is appropriate, to set this location for the Comments button, you will have to find the follwoing code in index.php:
<div class="entry">

<?php the_content('Read the rest of this entry »'); ?>

</div>
Right after the end of this code place the following code:
<?php comments_popup_link('No Comments »', '1 Comment »', '% Comments »'); ?>

</div>
Tags: amp, Auto, blog, Button, button placement, code lt, Comment, content themes, CSS, default theme, Draft, everything, file, fool, god, guess, guru, HTML, idea, index, kind, line, link, location, lt, nbsp, necessery, online, order, org, paragraph, php, php code, place, placement, plugin, quot, reading, realization, right, template, text, textIf, time, topic, way, Wordpress, wordpress plugin, wordpress templates
Posted in Various, Web and CMS, Wordpress | 1 Comment »
Thursday, April 7th, 2011 I’ve recently realized that the Easy Adsenser plugin which I used to place google adsense advertisements on my blog, is probably stealing some portion of my clicks.
There were some fraud reports on wordpress.org by people who have found out the author of Easy Adsenser rips clicks, by showing sometimes his own ad code even if the plugin is configured to not grant any clicks as a donation to the plugin author.
I don’t know how true this story is and I don’t have the time to observe the whole plugin code to say for sure if the rumors about clicks stealing are true.
However as I’m paying my internet access (that guarantees) by blog to stay online with some adsense advertisements and the adsense revenues are either equal to my internet tax or a bit higher (depending on the month), it’s quite unpleasent to hear someone is stealing from the ads clicks which still generate very low revenue.
Thus I took the time to read some blog posts online which gave me some hints on how can I directly place the google adsense advertisement code into the theme template files
My goal was to place one google adsense ad to appear right after the title of each article and one to appear as a vertical bar in the end of my sidebar.
In this article in short I’ll explain how I achieved this banner placement via the default wordpress template which obviously I use on my blog.
Let’s start:
1. Add adsense to the index page of the blog
Edit your blog/wp-content/themes/default/index.php file
Therein find the code:
<div id="content" class="narrowcolumn" role="main">
and right after this line put the following php code:
<?php

$postnum = 1;

$showadsense1 = 1;

?>
This code is necessery to assure the adsense code only appears on the first blog post from the blog index page
2. Find the code:
<small><?php the_time('F jS, Y') ?> <!-- by
Immediately after the code place the php code:
<?php if ($postnum == $showadsense1) {

echo '<div class="adsense" style="float:right;margin:12px;">;paste here your adsense code ...</div>';

} ?>
<?php $postnum++; ?>
Now with this changes, 1 adsense advertisements should start appearing right after your first and only on your blog post, next step is to place manually one more vertical adsense banner.
2. Place adsense vertical bannre in wordpress blog sidebar
Login with admin user to wordpress and navigate to:
Appearance -> Widgets
Among the available widgets you will notice the widget called Text click over: Add to add this widget to the list of widgets to appear on your blog sidebar.
Afterwards look up over the Sidebar list of widgets find the newly added Text widget and click over Edit to modify it’s content.
Further on put a Title for the widget or choose to leave the title field as blank if you don’t want a name to appear.
On the next textbox just paste your adsense code and you’re done. A simple refresh of your wordpress blog index page should show you a vertical banner with your adsense code.
! Note that if you have recently issued the adsense code it will take about 10-20 minutes until the banner starts showing up.
Until now wordpress is configured to show adsense adverts on the blog main page, as a next step we need to place the same adsense adverts to appear whether a single blog post is reviewed (opened).
Place an adsense advertisements to single posts opened
For that purpose it’s necessery to edit the file single.php it’s again located in blog/wp-content/themes/default
Once again you will first need to find the code:
if (have_posts())
Put the code after the end of the line on a new line:
<?php

// below code is for adsense

$postnum = 1;

$showadsense1 = 1;

?>
Next lookup in the file for the code:
<h2><?php the_title(); ?></h2>
On a new line after it place:
<?php if ($postnum == $showadsense1) { echo '<div class="adsense" style="float:right;margin:12px;"><script type="text/javascript"> place here your adsense code </div>';

} ?>
<?php $postnum++; ?>
That’s all now the adsense advertisements will be also showing on the single blog posts reviews found via some search engine (google, yahoo etc.).
Hope this article will be helpful to somebody, if so drop me a thanks line in comments 😉
Tags: adsense, advertisement, advertisements, banner placement, blog, class, code, code lt, content themes, div id, file, filesMy, fraud, fraud reports, goal, google, google adsense, index, index page, internet access, internet tax, js, margin, necessery, page, page posts, php, place, plugin, plugin code, quot, right, role, sidebar, someone, start 1, story, template, time, unpleasent, vertical bar, wordpress blog
Posted in SEO, System Administration, Web and CMS, Wordpress | 2 Comments »
Thursday, December 8th, 2011 
I’m realizing the more I’m converting to a fully functional GUI user, the less I’m doing coding or any interesting stuff…
I remembered of the old glorious times, when I was full time console user and got a memory on a nifty trick I was so used to back in the day.
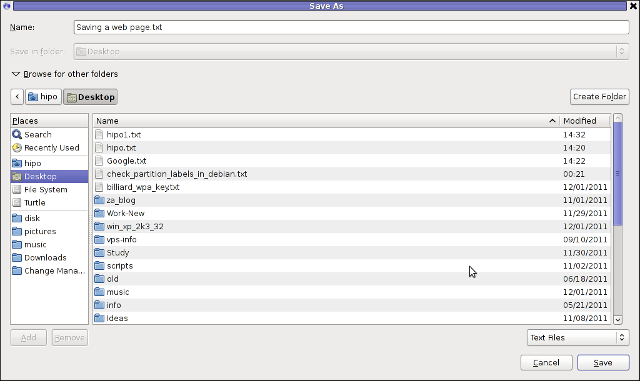
Back then I was quite often writing shell scripts which were fetching (html) webpages and converting the html content into a plain TEXT (TXT) files
In order to fetch a page back in the days I used lynx – (a very simple UNIX text browser, which by the way lacks support for any CSS or Javascipt) in combination with html2text – (an advanced HTML-to-text converter).
Let’s say I wanted to fetch a my personal home page https://www.pc-freak.net/, I did that via the command:
$ lynx -source https://www.pc-freak.net/ | html2text > pcfreak_page.txt
The content from www.pc-freak.net got spit by lynx as an html source and passed html2pdf wchich saves it in plain text file pcfreak_page.txt
The bit more advanced elinks – (lynx-like alternative character mode WWW browser) provides better support for HTML and even some CSS and Javascript so to properly save the content of many pages in plain html file its better to use it instead of lynx, the way to produce .txt using elinks files is identical, e.g.:
$ elinks -source https://www.pc-freak.net/blog/ | html2text > pcfreak_blog_page.txt
By the way back in the days I was used more to links , than the superior elinks , nowdays I have both of the text browsers installed and testing to fetch an html like in the upper example and pipe to html2text produced garbaged output.
Here is the time to tell its not even necessery to have a text browser installed in order to fetch a webpage and convert it to a plain text TXT!. wget file downloading tools supports source dump as well, for all those who did not (yet) tried it and want to test it:
$ wget -qO- https://www.pc-freak.net | html2text
Anyways of course, some pages convertion of text inside HTML tags would not properly get saved with neither lynx or elinks cause some texts might be embedded in some elinks or lynx unsupported CSS or JavaScript. In those cases the GUI browser is useful. You can use any browser like Firefox, Epiphany or Opera ‘s File -> Save As (Text Files) embedded functionality, below is a screenshot showing an html page which I’m about to save as a plain Text File in Mozilla Firefox:
Besides being handy in conjunction with text browsers, html2text is also handy for converting .html pages already existing on the computer’s hard drive to a plain (.TXT) text format.
One might wonder, why would ever one would like to do that?? Well I personally prefer reading plain text documents instead of htmls 😉
Converting an html files already existing on hard drive with html2text is done with cmd:
$ html2text index.html >index.txt
To convert a whole directory full of .html (documentation) or whatever files to plain text .TXT , cd the directory with HTMLs and issue the one liner bash loop command:
$ cd html/

html$ for i in $(echo *.html); do html2text $i > $(echo $i | sed -e 's#.html#.txt#g'); done
Now lay off your back and enjoy reading the dox like in the good old hacker days when .TXT files were fashionable 😉
Tags: advanced html, character mode, command lynx, content, convertion, course, CSS, drive, file, freak, full time, glorious times, gnu linux, html pages, html source, HTML-to-text, html2text, index, interesting stuff, javascipt, Javascript, Lynx, necessery, nifty trick, page, page txt, pcfreak, PDF, personal home page, Shell, shell scripts, spit, support, terminal, text, text browser, text converter, time, trick, TXT, unix text, wget
Posted in Everyday Life, FreeBSD, Linux, Linux and FreeBSD Desktop, Various | 1 Comment »
Monday, April 19th, 2010 1. First it’s necessery to have the mrtg debian package installed.
If it’s not installed then we have to install it:
debian-server:~# apt-get install mrtg
2. Second download the qmailmrtg source binary
To download the latest current source release of qmailmrtg execute:
debian-server:~# wget http://www.inter7.com/qmailmrtg7/qmailmrtg7-4.2.tar.gz
It’s a pity qmailmrtg is not available for download via debian repositories.
3. Third download the qmail.mrtg.cfg configuration file
debian-server~# wget https://www.pc-freak.net/files/qmail.mrtg.cfg
Now you have to put the file somewhere, usually it’s best to put it in the /etc/ directory.
Make sure the file is existing in /etc/qmail.mrtg.cfg
4. Untar compile and install qmailmrtg binary
debian-server:~# tar -xzvvf qmailmrtg7-4.2.tar.gz

...

debian-server:~# make && make install
strip qmailmrtg7
cp qmailmrtg7 /usr/local/bin
rm -rf *.o qmailmrtg7 checkq core
cc checkq.c -o checkq
./checkq
cc -s -O qmailmrtg7.c -o qmailmrtg7
qmailmrtg7.c: In function ‘main’:
qmailmrtg7.c:69: warning: incompatible implicit declaration of
built-in function ‘exit’
qmailmrtg7.c:93: warning: incompatible implicit declaration of
built-in function ‘exit’
qmailmrtg7.c:131: warning: incompatible implicit declaration of
built-in function ‘exit’
qmailmrtg7.c:137: warning: incompatible implicit declaration of
built-in function ‘exit’
5. Set proper file permissions according to the user you indent to execute qmailmrtg as
I personally execute it as root user, if you intend to do so as well set a permissions to
/etc/qmail.mrtg.cfg of 700.
In order to do that issue the command:
debian-server:~# chmod 700 /etc/qmail.mrtg.cfg
6. You will now need to modify the qmail.mrtg.cfg according to your needs
There you have to set a proper location where the qmailmrtg shall generate it’s html data files.
I use the /var/www/qmailmrtg qmailmrtg log file location. If you will do so as wellyou have to create the directory.
7. Create qmailmrtg html log files directory
debian-server:~# mkdir /var/log/qmailmrtg
8. Now all left is to set a proper cron line to periodically invoke qmailmrtg in order to generate qmail activity statistics.
Before we add the desired root’s crontab instructions we have to open the crontab for edit, using the command.
debian-server:~# crontab -u root -e
I personally use and recommend the following line as a line to be added to root’s crontab.
0-55/5 * * * * env LANG=C /usr/bin/mrtg /etc/qmail.mrtg.cfg > /dev/null
9. Copy index.html from qmailmrtg source directory to /var/log/qmailmrtg
debian-server:/usr/local/src/qmailmrtg7-4.2# cp -rpf index.html /var/log/qmailmrtg
10. Last step is to make sure Apache’s configuration contains lines that will enable you to access the qmail activity statistics.
The quickest way to do that in Debian running Apache 2.2 is to edit /etc/apache2/apache2.conf and add a directory Alias as follows
Alias /qmailmrtg/ "/var/www/qmailmrtg/"
Now after Apache restart
/etc/init.d/apache2 restart
You should be now able to access the qmail mrtg qmail log statistics through your Apache’s default configured host.
For instance, assuming your default configured Apache host is domain.com. You’ll be able to reach the qmailmrtg statistics through an url like:
http://domain.com/qmailmrtg/
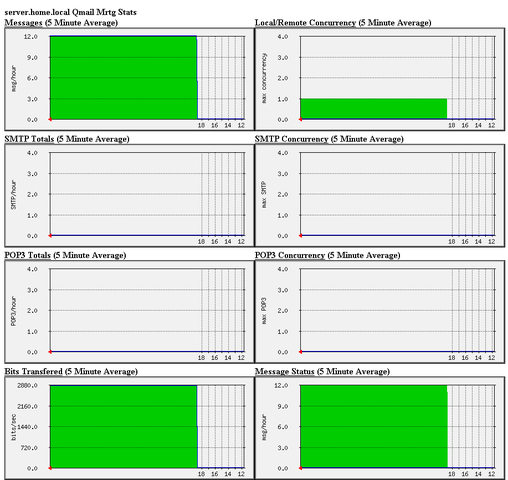
After I verified and ensured myself qmail mrtg is working correctly after all the above explained steps partook I wasn’t happy with some headlines in the index.html and the html tile of qmailmrtg,
so as a last step I manually edited the /var/www/qmailmrtg/index.html to attune it to my likings.
Here is a screenshot of the qmailmrtg web statistics in action.
Tags: amp, checkq, configuration file, cron, current source, debian package, debian repositories, declaration, default, download, exit, file, file permissions, freak, function, graph, host, html data, implicit declaration, indent, index, Installing qmailmrtg (qmail graph statistics on qmail activity) on Debian Lenny, loc, location, log, mrtg, necessery, package, proper location, rf, root, root user, Set, source release, statistics, strip, untar, wget
Posted in System Administration | 6 Comments »


How to change default Comments and No Comments location in WordPress in wordpress default theme
Tuesday, April 5th, 2011For a number of time I’ve been planning to change my blog comments placement. Until this very day however I’ve kept the default wordpress theme’s Comments button placement.
I realize the default Comments button placement is a bit hard to see and not that much intuitive for the user that enters my blog for a first time.
My first guess was that there might be somewhere a wordpress plugin which will allow me to adjust my comments button placement.
After some research online and a realization that probably there is no such plugin existing yet. I’ve forced myself to tune it up myself.
It was clear to me that in order to change the it will be necessery to edit the WordPress templates files. I’m not a designer and when I hear about templates I usually get scared, however I took the time to take a look at the default wordpress template and find out actually that template modifications is actually rather easier than I thought.
My previous idea was that in order to edit templates you have to be some kind of CSS and HTML guru (which I’m not). Nevertheless it seems that in order to play and adjust in a good way the templates you don’t need ot be a pro.
Even an uneducated fool like myself can easily do almost everything he thinks of throughout few lines of code in the wp templates.
To get back to the major topic thanks God after a bit of review and reading of wordpress.org documentation and some user forums. I’ve figured out that in order to change my Comments placement you need to modify the file:
In index.php find the line starting with:
You will notice within this opened paragraph the php code:
<?php the_tags('Tags: ', ', ', ''); ?> Posted in <?php the_category(', ') ?>
| <?php edit_post_link('Edit', '', ' | '); ?>
<?php comments_popup_link('No Comments »', '1 Comment »', '% Comments »'); ?>
This is the actual default theme php code that makes the wordpress Comments or No Comments that maes the comments appear on the blog.
Now I’ve decided to let this be as it is but add one more Comment button to wordpress on a different location that is more appealing to my blog visitors
After quick evaluation I’ve determined that probably the best location that the Comments button should have is right after the end of the post text
If you think my idea for button placement is appropriate, to set this location for the Comments button, you will have to find the follwoing code in index.php:
<div class="entry"><?php the_content('Read the rest of this entry »'); ?>
</div>
Right after the end of this code place the following code:
<?php comments_popup_link('No Comments »', '1 Comment »', '% Comments »'); ?></div>
Tags: amp, Auto, blog, Button, button placement, code lt, Comment, content themes, CSS, default theme, Draft, everything, file, fool, god, guess, guru, HTML, idea, index, kind, line, link, location, lt, nbsp, necessery, online, order, org, paragraph, php, php code, place, placement, plugin, quot, reading, realization, right, template, text, textIf, time, topic, way, Wordpress, wordpress plugin, wordpress templates
Posted in Various, Web and CMS, Wordpress | 1 Comment »