Archive for the ‘FreeBSD’ Category

Fixing Shellshock new critical remote bash shell exploitable vulnerability on Debian / Ubuntu / CentOS / RHEL / Fedora / OpenSuSE and Slackware

Friday, October 10th, 2014

Bash-ShellShock-remote-exploitable-Vulnerability-affecting-Linux-Mac-OSX-and-BSD-fixing-shellshock-bash-vulnerability-debian-redhat-fedora-centos-ubuntu-slackware-and-opensuse
If you still haven’t heard about the ShellShock Bash (Bourne Again) shell remote exploit vulnerability and you admin some Linux server, you will definitely have to read seriously about it. ShellShock Bash Vulnerabily has become public on Sept 24 and is described in details here.

The vulnerability allows remote malicious attacker to execute arbitrary code under certain conditions, by passing strings of code following environment variable assignments. Affected are most of bash versions starting with bash 1.14 to bash 4.3.
Even if you have patched there are some reports, there are other bash shell flaws in the way bash handles shell variables, so probably in the coming month there will be even more patches to follow.

Affected bash flaw OS-es are Linux, Mac OS and BSDs;

• Some DHCP clients

• OpenSSL servers that use ForceCommand capability in (Webserver config)

• Apache Webservers that use CGi Scripts through mod_cgi and mod_cgid as well as cgis written in bash or launching bash subshells

• Network exposed services that use bash somehow

Even though there is patch there are futher reports claiming patch ineffective from both Google developers and RedHat devs, they say there are other flaws in how batch handles variables which lead to same remote code execution.

There are a couple of online testing tools already to test whether your website or certain script from a website is vulnerable to bash remote code executions, one of the few online remote bash vulnerability scanner is here and here. Also a good usable resource to test whether your webserver is vulnerable to ShellShock remote attack is found on ShellShocker.Net.

As there are plenty of non-standard custom written scripts probably online and there is not too much publicity about the problem and most admins are lazy the vulnerability will stay unpatched for a really long time and we’re about to see more and more exploit tools circulating in the script kiddies irc botnets.

Fixing bash Shellcode remote vulnerability on Debian 5.0 Lenny.

Follow the article suggesting how to fix the remote exploitable bash following few steps on older unsupported Debian 4.0 / 3.0 (Potato) etc. – here.

Fixing the bash shellcode vulnerability on Debian 6.0 Squeeze. For those who never heard since April 2014, there is a A Debian LTS (Long Term Support) repository. To fix in Debian 6.0 use the LTS package repository, like described in following article.

If you have issues patching your Debian Wheezy 6.0 Linux bash, it might be because you already have a newer installed version of bash and apt-get is refusing to overwrite it with an older version which is provided by Debian LTS repos. The quickest and surest way to fix it is to do literally the following:


vim /etc/apt/sources.list

Paste inside to use the following LTS repositories:

deb http://http.debian.net/debian/ squeeze main contrib non-free
deb-src http://http.debian.net/debian/ squeeze main contrib non-free
deb http://security.debian.org/ squeeze/updates main contrib non-free
deb-src http://security.debian.org/ squeeze/updates main contrib non-free
deb http://http.debian.net/debian squeeze-lts main contrib non-free
deb-src http://http.debian.net/debian squeeze-lts main contrib non-free

Further on to check the available installable deb package versions with apt-get, issue:


apt-cache showpkg bash
...
...
Provides:
4.1-3+deb6u2 -
4.1-3 -
Reverse Provides:

As you see there are two installable versions of bash one from default Debian 6.0 repos 4.1-3 and the second one 4.1-3+deb6u2, another way to check the possible alternative installable versions when more than one version of a package is available is with:


apt-cache policy bash
...
*** 4.1-3+deb6u2 0
500 http://http.debian.net/debian/ squeeze-lts/main amd64 Packages
100 /var/lib/dpkg/status
4.1-3 0
500 http://http.debian.net/debian/ squeeze/main amd64 Packages

Then to install the LTS bash version on Debian 6.0 run:


apt-get install bash=4.1-3+deb6u2

Patching Ubuntu Linux supported version against shellcode bash vulnerability:
A security notice addressing Bash vulnerability in Ubuntus is in Ubuntu Security Notice (USN) here
USNs are a way Ubuntu discloses packages affected by a security issues, thus Ubuntu users should try to keep frequently an eye on Ubuntu Security Notices

apt-get update
apt-get install bash

Patching Bash Shellcode vulnerability on EOL (End of Life) versions of Ubuntu:

mkdir -p /usr/local/src/dist && cd /usr/local/src/dist
wget http://ftpmirror.gnu.org/bash/bash-4.3.tar.gz.sig
wget http://ftpmirror.gnu.org/bash/bash-4.3.tar.gz
wget http://tiswww.case.edu/php/chet/gpgkey.asc
gpg --import gpgkey.asc
gpg --verify bash-4.3.tar.gz.sig
cd ..
tar xzvf dist/bash-4.3.tar.gz
cd bash-4.3
mkdir patches && cd patches
wget -r --no-parent --accept "bash43-*" -nH -nd
ftp.heanet.ie/mirrors/gnu/bash/bash-4.3-patches/ # Use a local mirror
echo *sig | xargs -n 1 gpg --verify --quiet # see note 2

cd ..
echo patches/bash43-0?? | xargs -n 1 patch -p0 -i # see note 3 below

./configure --prefix=/usr --bindir=/bin
--docdir=/usr/share/doc/bash-4.3
--without-bash-malloc
--with-installed-readline

make
make test && make install

To solve bash vuln in recent Slackware Linux:

slackpkg update
slackpkg upgrade bash

For old Slacks, either download a patched version of bash or download the source for current installed package and apply the respective patch for the shellcode vulnerability.
There is also a GitHub project “ShellShock” Proof of Concept code demonstrating – https://github.com/mubix/shellshocker-pocs
There are also non-confirmed speculations for bash vulnerability bug to impact also:

Speculations:(Non-confirmed possibly vulnerable common server services):

• XMPP(ejabberd)

• Mailman

• MySQL

• NFS

• Bind9

• Procmail

• Exim

• Juniper Google Search

• Cisco Gear

• CUPS

• Postfix

• Qmail

Fixing ShellShock bash vulnerability on supported versions of CentOS, Redhat, Fedora

In supported versions of CentOS where EOL has not reached:

yum –y install bash

In Redhat, Fedoras recent releases to patch:

yum update bash

To upgrade the bash vulnerability in OpenSUSE:

zipper patch –cve=CVE-2014-7187

Shellcode is worser vulnerability than recent SSL severe vulnerability Hearbleed. According to Redhat and other sources this new bash vulnerability is already actively exploited in the wild and probably even worms are crawling the net stealing passwords, data and building IRC botnets for remote control and UDP flooding.

Monitoring multi core / (multiple CPUs) servers with top, tload and on Linux

Thursday, March 17th, 2011

The default GNU / Linux top command does allow to see statistics on servers and systems with multiple CPUs.
This is quite beneficial especially on Linux systems which are not equipped with htop which does show statistics to the multiple-core system load.

To examine the multiple CPUs statistics with the default top command available on every Linux system and part of the procps/proc file system utilities

1. Start top:

linux:~# top

When the top system load statistics screen starts up refreshing,

2. press simply 1
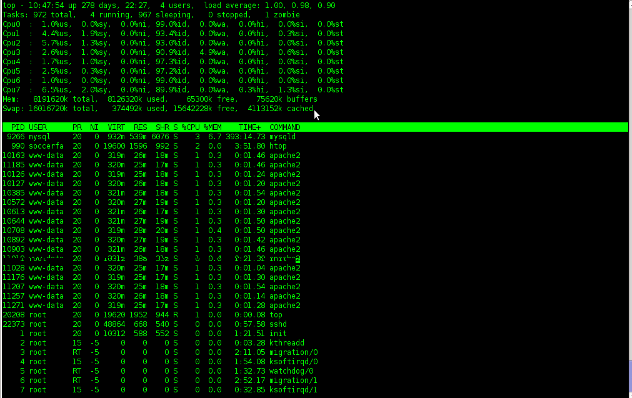
You will notice all your system cpus to show up in the top head:

8 cpu top screen statistics on Linux

As I have started talking about top, a very useful way to use top to track processes which are causing a system high loads is:

linux:~# top -b -i

This command will run top in batch mode interactively and will show you statistics about the most crucial processes which does cause a server load, look over the output and you will get an idea about what is causing you server troubles.
Moreover if you’re a Linux console freak as me you will also probably want to take a look at tload

tload command is a part of the procps – /proc file system utilities and as you can read in the tload manual tload – graphic representation of system load average

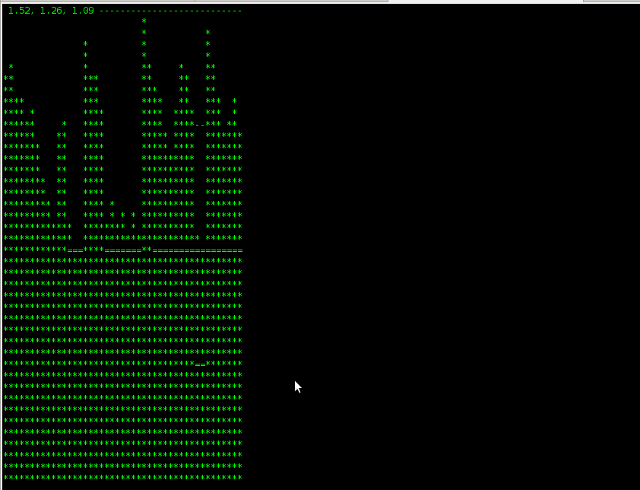
Here is a picture to give you an idea on the console output of tload :

tload console/terminal system load statistics on Linux screenshot

Another tool that you might find very usefel is slabtop it’s again a part of the procps linux package.
slabtop – displays a listing of the top caches sorted by one of the listed sort criteria., in most of the cases the slabtop kernel cache monitoring tool won’t be necessary for the regular administrator, however on some servers it might help up to the administrator to resolve performance issues which are caused by the kernel as a bottleneck.
slabtop is also used as a tool by kernel developers to write and debug the Linux kernel.

Monitoring MySQL server queries and debunning performance (slow query) issues with native MySQL commands and with mtop, mytop

Thursday, May 10th, 2012

If you're a Linux server administrator running MySQL server, you need to troubleshoot performance and bottleneck issues with the SQL database every now and then. In this article, I will pinpoint few methods to debug basic issues with MySQL database servers.

1. Troubleshooting MySQL database queries with native SQL commands

a)One way to debug errors and get general statistics is by logging in with mysql cli and check the mysql server status:

# mysql -u root -p
mysql> SHOW STATUS;
+-----------------------------------+------------+
| Variable_name | Value |
+-----------------------------------+------------+
| Aborted_clients | 1132 |
| Aborted_connects | 58 |
| Binlog_cache_disk_use | 185 |
| Binlog_cache_use | 2542 |
| Bytes_received | 115 |
.....
.....
| Com_xa_start | 0 |
| Compression | OFF |
| Connections | 150000 |
| Created_tmp_disk_tables | 0 |
| Created_tmp_files | 221 |
| Created_tmp_tables | 1 |
| Delayed_errors | 0 |
| Delayed_insert_threads | 0 |
| Delayed_writes | 0 |
| Flush_commands | 1 |
.....
.....
| Handler_write | 132 |
| Innodb_page_size | 16384 |
| Innodb_pages_created | 6204 |
| Innodb_pages_read | 8859 |
| Innodb_pages_written | 21931 |
.....
.....
| Slave_running | OFF |
| Slow_launch_threads | 0 |
| Slow_queries | 0 |
| Sort_merge_passes | 0 |
| Sort_range | 0 |
| Sort_rows | 0 |
| Sort_scan | 0 |
| Table_locks_immediate | 4065218 |
| Table_locks_waited | 196 |
| Tc_log_max_pages_used | 0 |
| Tc_log_page_size | 0 |
| Tc_log_page_waits | 0 |
| Threads_cached | 51 |
| Threads_connected | 1 |
| Threads_created | 52 |
| Threads_running | 1 |
| Uptime | 334856 |
+-----------------------------------+------------+
225 rows in set (0.00 sec)

SHOW STATUS; command gives plenty of useful info, however it is not showing the exact list of queries currently processed by the SQL server. Therefore sometimes it is exactly a stucked (slow queries) execution, you need to debug in order to fix a lagging SQL. One way to track this slow queries is via enabling mysql slow-query.log. Anyways enabling the slow-query requires a MySQL server restart and some critical productive database servers are not so easy to restart and the SQL slow queries have to be tracked "on the fly" so to say.
Therefore, to check the exact (slow) queries processed by the SQL server (without restarting it), do
 

mysql> SHOW processlist;
+——+——+—————+——+———+——+————–+——————————————————————————————————+
| Id | User | Host | db | Command | Time | State | Info |
+——+——+—————+——+———+——+————–+——————————————————————————————————+
| 609 | root | localhost | blog | Sleep | 5 | | NULL |
| 1258 | root | localhost | NULL | Sleep | 85 | | NULL |
| 1308 | root | localhost | NULL | Query | 0 | NULL | show processlist |
| 1310 | blog | pcfreak:64033 | blog | Query | 0 | Sending data | SELECT comment_author, comment_author_url, comment_content, comment_post_ID, comment_ID, comment_aut |
+——+——+—————+——+———+——+————–+——————————————————————————————————+
4 rows in set (0.00 sec)
mysql>

SHOW processlist gives a good view on what is happening inside the SQL.

To get more complete information on SQL query threads use the full extra option:

mysql> SHOW full processlist;

This gives pretty full info on running threads, but unfortunately it is annoying to re-run the command again and again – constantly to press UP Arrow + Enter keys.

Hence it is useful to get the same command output, refresh periodically every few seconds. This is possible by running it through the watch command:

debian:~# watch "'show processlist' | mysql -u root -p'secret_password'"

watch will run SHOW processlist every 2 secs (this is default watch refresh time, for other timing use watch -n 1, watch -n 10 etc. etc.

The produced output will be similar to:

Every 2.0s: echo 'show processlist' | mysql -u root -p'secret_password' Thu May 10 17:24:19 2012

Id User Host db Command Time State Info
609 root localhost blog Sleep 3 NULL1258 root localhost NULL Sleep 649 NULL1542 blog pcfreak:64981 blog Query 0 Copying to tmp table \
SELECT p.ID, p.post_title, p.post_content,p.post_excerpt, p.pos
t_date, p.comment_count, count(t_r.o
1543 root localhost NULL Query 0 NULL show processlist

Though this "hack" is one of the possible ways to get some interactivity on what is happening inside SQL server databases and tables table. for administering hundred or thousand SQL servers running dozens of queries per second – monitor their behaviour few times aday using mytop or mtop is times easier.

Though, the names of the two tools are quite similar and I used to think both tools are one and the same, actually they're not but both are suitable for monitoring sql database execution in real time.

As a sys admin, I've used mytop and mtop, on almost each Linux server with MySQL server installed.
Both tools has helped me many times in debugging oddities with sql servers. Therefore my personal view is mytop and mtop should be along with the Linux sysadmin most useful command tools outfit, still I'm sure many administrators still haven't heard about this nice goodies.

1. Installing mytop on Debian, Ubuntu and other deb based GNU / Linux-es

mytop is available for easy install on Debian and across all debian / ubuntu and deb derivative distributions via apt.

Here is info obtained with apt-cache show

debian:~# apt-cache show mytop|grep -i description -A 3
Description: top like query monitor for MySQL
Mytop is a console-based tool for monitoring queries and the performance
of MySQL. It supports version 3.22.x, 3.23.x, 4.x and 5.x servers.
It's written in Perl and support connections using TCP/IP and UNIX sockets.

Installing the tool is done with the trivial:

debian:~# apt-get --yes install mytop
....

mtop used to be available for apt-get-ting in Debian Lenny and prior Debian releases but in Squeeze onwards, only mytop is included (probably due to some licensing incompitabilities with mtop??).

For those curious on how mtop / mytop works – both are perl scripts written to periodically connects to the SQL server and run commands similar to SHOW FULL PROCESSLIST;. Then, the output is parsed and displayed to the user.

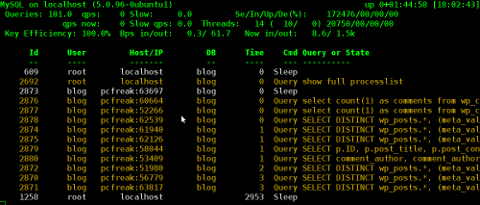
Here how mytop running, looks like:

MyTOP showing queries running on Ubuntu 8.04 Linux - Debugging interactively top like MySQL

2. Installing mytop on RHEL and CentOS

By default in RHEL and CentOS and probably other RedHat based Linux-es, there is neither mtop nor mytop available in package repositories. Hence installing the tools on those is only available from 3rd parties. As of time of writting an rpm builds for RHEL and CentOS, as well as (universal rpm distros) src.rpm package is available on http://pkgs.repoforge.org/mytop/. For the sake of preservation – if in future those RPMs disappear, I made a mirror of mytop rpm's here

Mytop rpm builds depend on a package perl(Term::ReadKey), my attempt to install it on CentOS 5.6, returned following err:

[root@cenots ~]# rpm -ivh mytop-1.4-2.el5.rf.noarch.rpm
warning: mytop-1.4-2.el5.rf.noarch.rpm: Header V3 DSA signature: NOKEY, key ID 6b8d79e6
error: Failed dependencies:
perl(Term::ReadKey) is needed by mytop-1.4-2.el5.rf.noarch

The perl(Term::ReadKey package is not available in CentOS 5.6 and (probably other centos releases default repositories so I had to google perl(Term::ReadKey) I found it on http://rpm.pbone.net/ package repository, the exact url to the rpm dependency as of time of writting this post is:

ftp://ftp.pbone.net/mirror/yum.trixbox.org/centos/5/old/perl-Term-ReadKey-2.30-2.rf.i386.rpm

Quickest, way to install it is:

[root@centos ~]# rpm -ivh ftp://ftp.pbone.net/mirror/yum.trixbox.org/centos/5/old/perl-Term-ReadKey-2.30-2.rf.i386.rpmRetrieving ftp://ftp.pbone.net/mirror/yum.trixbox.org/centos/5/old/perl-Term-ReadKey-2.30-2.rf.i386.rpmPreparing... ########################################### [100%]
1:perl-Term-ReadKey ########################################### [100%]

This time mytop, install went fine:

[root@centos ~]# rpm -ivh mytop-1.4-2.el5.rf.noarch.rpm
warning: mytop-1.4-2.el5.rf.noarch.rpm: Header V3 DSA signature: NOKEY, key ID 6b8d79e6
Preparing... ########################################### [100%]
1:mytop ########################################### [100%]

To use it further, it is the usual syntax:

mytop -u username -p 'secret_password' -d database

CentOS Linux MyTOP MySQL query benchmark screenshot - vpopmail query

3. Installing mytop and mtop on FreeBSD and other BSDs

To debug the running SQL queries in a MySQL server running on FreeBSD, one could use both mytop and mtop – both are installable via ports:

a) To install mtop exec:

freebsd# cd /usr/ports/sysutils/mtop
freebsd# make install clean
....

b) To install mytop exec:

freebsd# cd /usr/ports/databases/mytop
freebsd# make install clean
....

I personally prefer to use mtop on FreeBSD, because once run it runs prompts the user to interactively type in the user/pass

freebsd# mtop

Then mtop prompts the user with "interactive" dialog screen to type in user and pass:

Mtop interactive type in username and password screenshot on FreeBSD 7.2

It is pretty annoying, same mtop like syntax don't show user/pass prompt:

freebsd# mytop
Cannot connect to MySQL server. Please check the:

* database you specified "test" (default is "test")
* username you specified "root" (default is "root")
* password you specified "" (default is "")
* hostname you specified "localhost" (default is "localhost")
* port you specified "3306" (default is 3306)
* socket you specified "" (default is "")
The options my be specified on the command-line or in a ~/.mytop
config file. See the manual (perldoc mytop) for details.
Here's the exact error from DBI. It might help you debug:
Unknown database 'test'

The correct syntax to run mytop instead is:

freebsd# mytop -u root -p 'secret_password' -d 'blog'

Or the longer more descriptive:

freebsd# mytop --user root --pass 'secret_password' --database 'blog'

By the way if you take a look at mytop's manual you will notice a tiny error in documentation, where the three options –user, –pass and –database are wrongly said to be used as -user, -pass, -database:

freebsd# mytop -user root -pass 'secret_password' -database 'blog'
Cannot connect to MySQL server. Please check the:

* database you specified "atabase" (default is "test")
* username you specified "ser" (default is "root")
* password you specified "ass" (default is "")
* hostname you specified "localhost" (default is "localhost")
* port you specified "3306" (default is 3306)
* socket you specified "" (default is "")a
...
Access denied for user 'ser'@'localhost' (using password: YES)

Actually it is interesting mytop, precededed historically mtop.
mtop was later written (probably based on mytop), to run on FreeBSD OS by a famous MySQL (IT) spec — Jeremy Zawodny .
Anyone who has to do frequent MySQL administration tasks, should already heard Zawodny's name.
For those who haven't, Jeremy used to be a head database administrators and developer in Yahoo! Inc. some few years ago.
His website contains plenty of interesting thoughts and writtings on MySQL server and database management
 

How to create ssh tunnels / ssh tunneling on Linux and FreeBSD with openssh

Saturday, November 26th, 2011

ssh-tunnels-port-forwarding-windows-linux-bypassing-firewall-diagram
SSH tunneling
allows to send and receive traffic using a dedicated port. Using an ssh traffic can have many reasons one most common usage reason is to protect the traffic from a host to a remote server or to access port numbers which are by other means blocked by firewall, e.g.: (get around firewall filtering)
SSH tunneling works only with TCP traffic. The way to make ssh tunnel is with cmds:

host:/root# ssh -L localhost:deshost:destport username@remote-server.net
host:/root# ssh -R restport:desthost:localport username@remote-server.net
host:/root# ssh -X username@remote-server.net

This command will make ssh to bind a port on localhost of the host host:/root# machine to the host desthost:destport (destination host : destinationport). Important to say deshost is the host destination visible from the remote-server.net therefore if the connection is originating from remote-server.net this means desthost will be localhost.
Mutiple ssh tunnels to multiple ports using the above example commands is possible. Here is one example of ssh tunneling
Let’s say its necessery to access an FTP port (21) and an http port (80), listening on remote-server.net In that case desthost will be localhost , we can use locally the port (8080) insetad of 80, so it will be no necessery to make the ssh tunnel with root (admin privileges). After the ssh session gets opened both services will be accessible on the local ports.

host:/home/user$ ssh -L 21:localhost:21 -L 8080:localhost:80 user@remote-server.net

That’s all enjoy 😉

FreeBSD 10.0 RELEASE is out pkg_add FreeBSD default package manager to be substituted with pkg

Thursday, January 23rd, 2014

freebsd 10 is out logo pkg add to be removed - freebsd big news pkg_add to be substituted by another package manager

New latest version of FreeBSD 10.0-RELEASE is out this. FBSD 10  is the latest stable release of 10 branch. The biggest change in FBSD 10 is removal of long time used pkg_add and its substitute with the newer and more advanced pkg. For BSD users who don't know pkg  stiill check out handbook on pkgng

Key highlights of FreeBSD 10 as taken from FreeBSD-10.0-RELEASE announcement;
 

  • GCC is no longer installed by default on architectures where clang(1) is the default compiler.

  • Unbound has been imported to the base system as the local caching DNS resolver.

  • BIND has been removed from the base system.

  • make(1) has been replaced with bmake(1), obtained from the NetBSD Project.

  • pkg(7) is now the default package management utility.

  • pkg_add(1), pkg_delete(1), and related tools have been removed.

  • Major enhancements in virtualization, including the addition of bhyve(8), virtio(4), and native paravirtualized drivers providing support for FreeBSD as a guest operating system on Microsoft Hyper-V.

  • TRIM support for Solid State Drives has been added to ZFS.

  • Support for the high-performance LZ4 compression algorithm has been added to ZFS.

    There is a big news for Raspberry Pi lovers as from FreeBSD 10 there is an official support for Raspberry Pi
    Happy new release. Cheers to testers 🙂

New FreeBSD version is out – Hello FreeBSD 9.2

Tuesday, October 1st, 2013

new version of FreeBSD is out FreeBSD 9.2

FreeBSD 9.2 is out today. There are mostly improvements in FreeBSD's ZFS. As usual BSD packages are updated with new ones. This version of BSD does not include anything revolutionary. Below are all the major changes in the distro. A list of all new introduced supports in that release as usual is in BSD's release notes

To all BSD users – Happy new BSD release 🙂

Tracking multiple log files in real time in Linux console / terminal (MultiTail)

Monday, July 29th, 2013

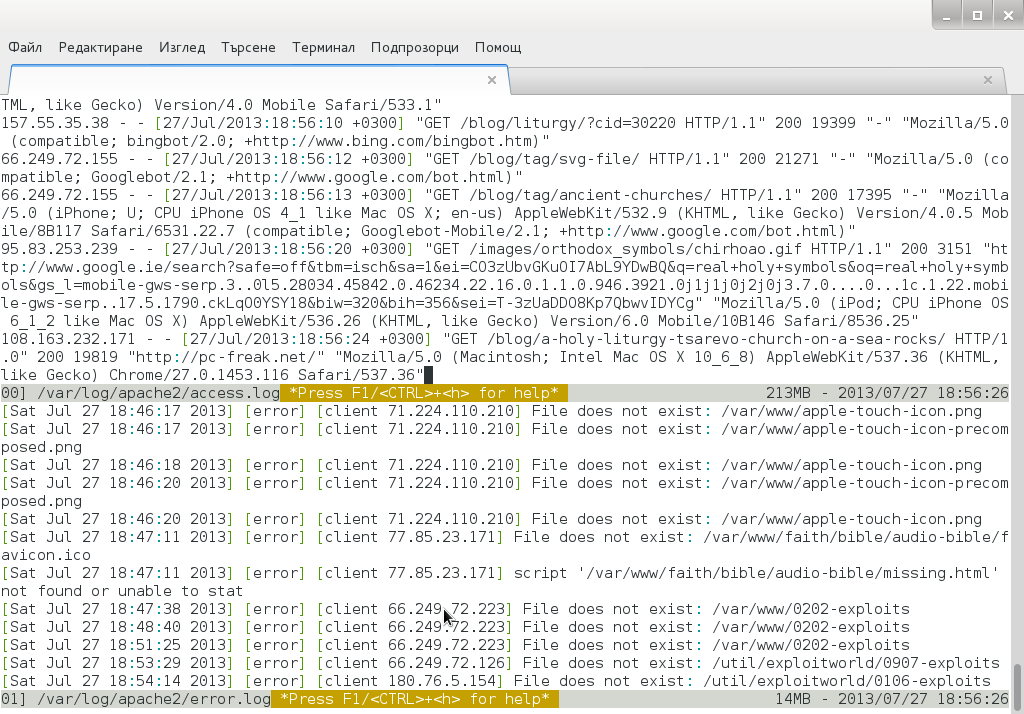
Multitail multiple tail Debian GNU Linux viewing Apache access and error log in shared screen
Whether you have to administer Apache, Nginx or Lighttpd, or whatever other kind of daemon which interactively logs user requests or errors you probably already know well of tail command (tail -f /var/log/apache2/access.log) is something Webserver Linux admin can't live without. Sometimes however you have number of Virtualhost (domains) each configured to log site activity in separate log file. One solution to the problem is to use GNU Screen (screen – terminal emulator) to launch multiple screen session and launch separate tail -f /var/log/apache2/domain1/access.log , tail -f /var/log/apache2/domain2/access.log etc. This however is a bit of hack and except configuring screen to show multiple windows on one Virtual Terminal (tty or vty in gnome), you can't really see output simultaneously in one separated window.

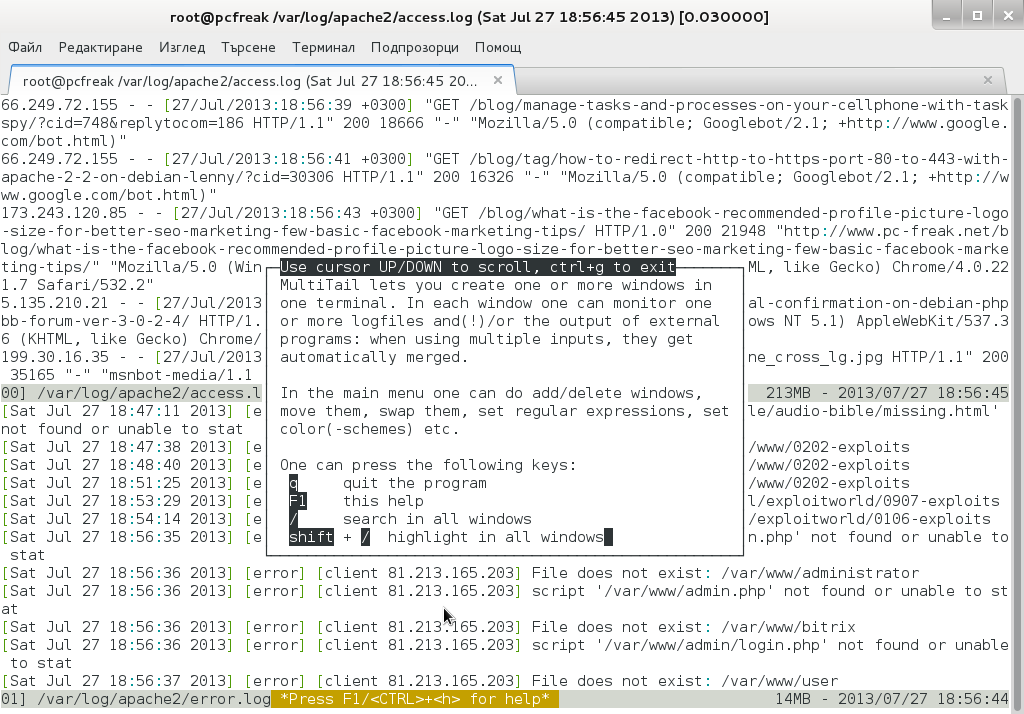
Here is where multitail comes handy. MultiTail is tool to visualize in real time log records output of multiple logs (tails) in one shared terminal Window. MultiTail is written to use ncurses library used by a bunch of other useful tools like Midnight Command so output is colorful and very nice looking.

Here is MultiTail package description on Debian Linux:

linux:~# apt-cache show multitail|grep -i description -A 1
Description-en: view multiple logfiles windowed on console
 multitail lets you view one or multiple files like the original tail

Description-md5: 5e2f688efb214b063bdc418a705860a1
Tag: interface::text-mode, role::program, scope::utility, uitoolkit::ncurses,
root@noah:/home/hipo# apt-cache show multitail|grep -i description -A 1
Description-en: view multiple logfiles windowed on console
 multitail lets you view one or multiple files like the original tail

Description-md5: 5e2f688efb214b063bdc418a705860a1
Tag: interface::text-mode, role::program, scope::utility, uitoolkit::ncurses,
 

Multiple Tail is available across most Linux distributions to install on Debian / Ubuntu / Mint etc. Linux:

debian:~# apt-get install --yes multitail
...

On recent Fedora / RHEL / CentOS etc. RPM based Linuces to install:

[root@centos ~]# yum -y install multitail
...

On FreeBSD multitail is available to install from ports:

freebsd# cd /usr/ports/sysutils/multitail
freebsd# make install clean
...

Once installed to display records in multiple files lets say Apache domain name access.log and error.log

debian:~# multitail -f /var/log/apache2/access.log /var/log/apache2/error.log

It has very extensive help invoked by simply pressing h while running

multtail-viewing-in-gnome-shared-screen-debian-2-log-files-screenshot

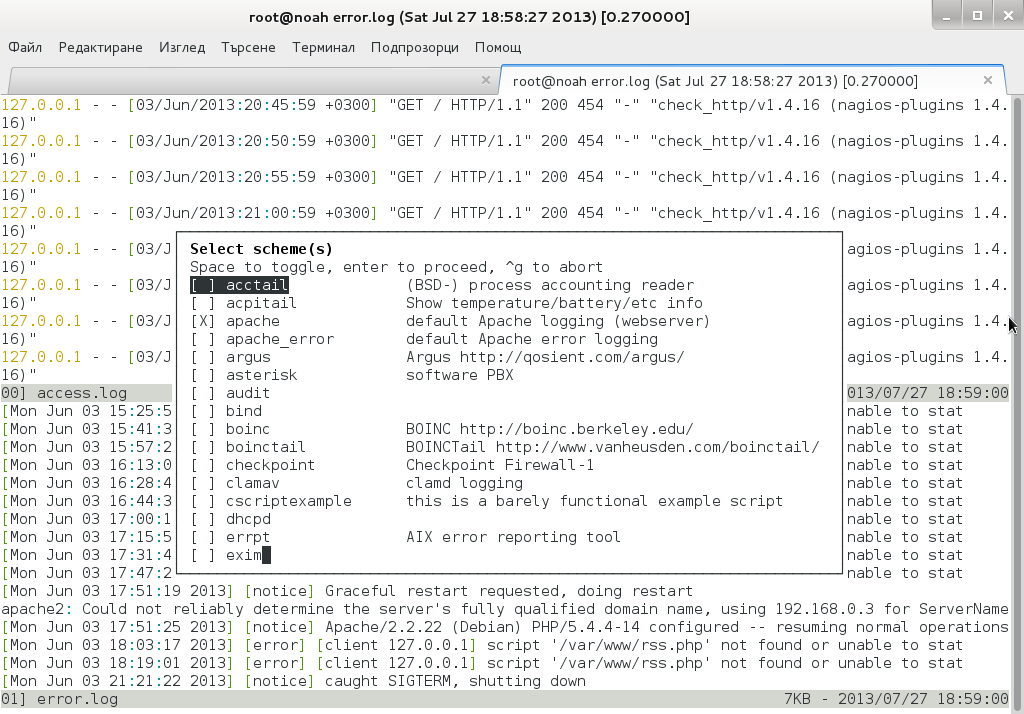
Even better multitail is written to already have integrated color schemes for most popular Linux services log files

multitail multiple tail debian gnu linux logformat different color schemes screenshot
List of supported MulLog Color schemes as of time of writting article is:

acctail, acpitail, apache, apache_error, argus, asterisk, audit, bind, boinc, boinctail ,checkpoint, clamav, cscriptexample, dhcpd, errrpt, exim, httping, ii, inn, kerberos, lambamoo, liniptfw, log4j, mailscanner, motion, mpstat, mysql, nagtail, netscapeldap, netstat, nttpcache, ntpd, oracle, p0f, portsentry, postfix, pptpd, procmail, qmt-clamd, qmt-send, qmt-smtpd, qmt-sophie, qmt-spamassassin, rsstail, samba, sendmail, smartd, snort spamassassin, squid, ssh, strace, syslog, tcpdump, vmstat, vnetbr, websphere, wtmptail

To tell it what kind of log Color scheme to use from cmd line use:

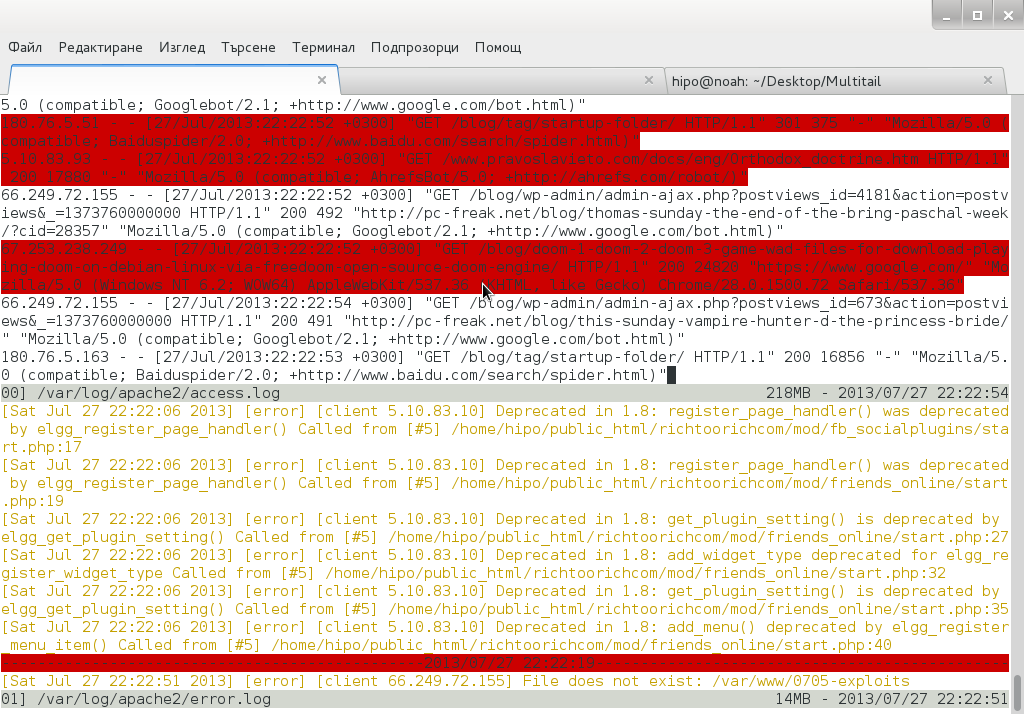
debian:~# multitail -Csapache /var/log/apache2/access.log /var/log/apache2/error.log

multiple tail with Apache highlight on Debian Linux screenshot

Useful feature is to run command display in separate Windows while still following log output, i.e.:

[root@centos:~]# multitail /var/log/httpd.log -l "netstat -nat"
...

Multitail can also merge output from files in one Window, while in second window some other log or command output is displayed. To merge output from Apache access.log and error.log:

debian:~# multitail /var/log/apache2/access.log -I /var/log/apache2/error.log

When merging two log files output to show in one Window it is useful to display each file output in different color for the sake of readability

For example:
 

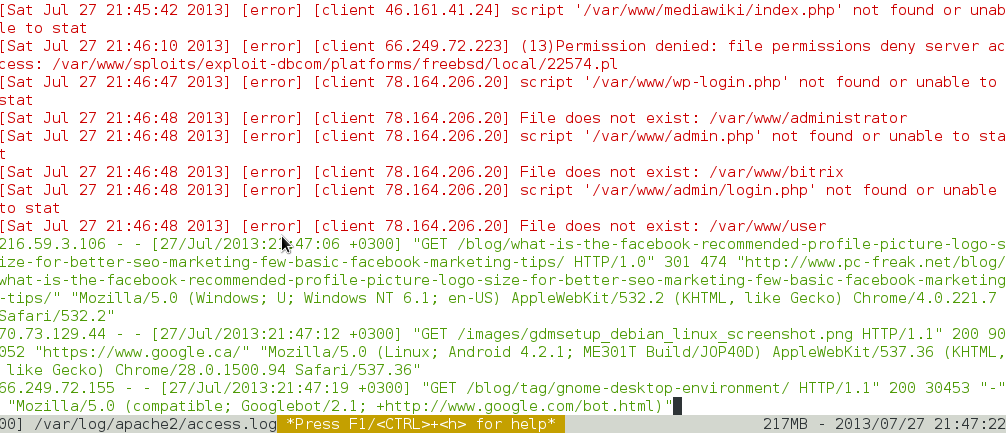
debian:~# multitail -ci green /var/log/apache/access.log -ci red -I /var/log/apache/error.log

multitail merged Apache access and error log on Debian Linux

To display output from 3 log files in 3 separate shared Windows in console use:

linux:~# multitail -s 2 /var/log/syslog /var/log/apache2/access.log /var/log/apache2/error.log

For some more useful examples, check out MultiTail's official page examples
There is plenty of other useful things to do with multitail, for more RTFM 🙂

Tracking I/O hard disk server bottlenecks with iostat on GNU / Linux and FreeBSD

Tuesday, March 27th, 2012

Hard disk overhead tracking on Linux and FreeBSD with iostat

I've earlier wrote an article How to find which processes are causing hard disk i/o overhead on Linux there I explained very rawly few tools which can be used to benchmark hard disk read / write operations. My prior article accent was on iotop and dstat and it just mentioned of iostat. Therefore I've wrote this short article in attempt to explain a bit more thoroughfully on how iostat can be used to track problems with excessive server I/O read/writes.

Here is the command man page description;
iostatReport Central Processing Unit (CPU) statistics and input/output statistics for devices, partitions and network filesystems

I will further proceed with few words on how iostat can be installed on various Linux distros, then point at few most common scenarious of use and a short explanation on the meaning of each of the command outputs.

1. Installing iostat on Linux

iostat is a swiss army knife of finding a server hard disk bottlenecks. Though it is a must have tool in the admin outfut, most of Linux distributions will not have iostat installed by default.
To have it on your server, you will need to install sysstat package:

a) On Debian / Ubuntu and other Debian GNU / Linux derivatives to install sysstat:

debian:~# apt-get --yes install sysstat

b) On Fedora, CentOS, RHEL etc. install is with yum:

[root@centos ~]# yum -y install sysstat

c) On Slackware Linux sysstat package which contains iostat is installed by default. 

d) In FreeBSD, there is no need for installation of any external package as iostat is part of the BSD world (bundle commands).
I should mention bsd iostat and Linux's iostat commands are not the same and hence there use to track down hard disk bottlenecks differs a bit, however the general logic of use is very similar as with most tools in BSD and Linux.

2. Checking a server hard disk for i/o disk bottlenecks on G* / Linux

Once having the sysstat installed on G* / Linux systems, the iostat command will be added in /usr/bin/iostat
a) To check what is the hard disk read writes per second (in megabytes) use:

debian:~# /usr/bin/iostat -m
Linux 2.6.32-5-amd64 (debian) 03/27/2012 _x86_64_ (8 CPU)
avg-cpu: %user %nice %system %iowait %steal %idle
15.34 0.36 2.76 2.66 0.00 78.88
Device: tps MB_read/s MB_wrtn/s MB_read MB_wrtn
sda 63.89 0.48 8.20 6730223 115541235
sdb 64.12 0.44 8.23 6244683 116039483
md0 2118.70 0.22 8.19 3041643 115528074

In the above output the server, where I issue the command is using sda and sdb configured in software RAID 1 array visible in the output as (md0)

The output of iostat should already be easily to read, for anyone who didn't used the tool here is a few lines explanation of the columns:

The %user 15.34 meaning is that 15.34 out of 100% possible i/o load is generad by system level read/write operations.
%nice – >Show the percentage of CPU utilization that occurred while executing at the user level with nice priority.
%iowait – just like the top command idle it shows the idle time when the system didn't have an outstanding disk I/O requests.
%steal – show percentage in time spent in time wait of CPU or virtual CPUs to service another virtual processor (high numbers of disk is sure sign for i/o problem).
%idle – almost the same as meaning to %iowait
tps – HDD transactions per second
MB_read/s (column) – shows the actual Disk reads in Mbytes at the time of issuing iostat
MB_wrtn/s – displays the writes p/s at the time of iostat invocation
MB_read – shows the hard disk read operations in megabytes, since the server boot 'till moment of invocation of iostat
MB_wrtn – gives the number of Megabytes written on HDD since the last server boot filesystem mount

The reason why the Read / Write values for sda and sdb are similar in this example output is because my disks are configured in software RAID1 (mirror)

The above iostat output reveals in my specific case the server is experiencing mostly Disk writes (observable in the high MB_wrtn/s 8.19 md0 in the above sample output).

It also reveals, the I/O reads experienced on that server hard disk are mostly generated as a system (user level load) – see (%user 15.34 and md0 2118.70).

For all those not familiar with system also called user / level load, this is all kind of load which is generated by running programs on the server – (any kind of load not generated by the Linux kernel or loaded kernel modules).

b) To periodically keep an eye on HDD i/o operations with iostat, there are two ways:

– Use watch in conjunction with iostat;

[root@centos ~]# watch "/usr/bin/iostat -m"
Every 2.0s: iostat -m Tue Mar 27 11:00:30 2012
Linux 2.6.32-5-amd64 (centos) 03/27/2012 _x86_64_ (8 CPU)
avg-cpu: %user %nice %system %iowait %steal %idle
15.34 0.36 2.76 2.66 0.00 78.88
Device: tps MB_read/s MB_wrtn/s MB_read MB_wrtn
sda 63.89 0.48 8.20 6730255 115574152
sdb 64.12 0.44 8.23 6244718 116072400
md0 2118.94 0.22 8.20 3041710 115560990
Device: tps MB_read/s MB_wrtn/s MB_read MB_wrtn
sda 55.00 0.01 25.75 0 51
sdb 52.50 0.00 24.75 0 49
md0 34661.00 0.01 135.38 0 270

Even though watch use and -d might appear like identical, they're not watch does refresh the screen, executing instruction similar to the clear command which clears screen on every 2 seconds, so the output looks like the top command refresh, while passing the -d 2 will output the iostat command output on every 2 secs in a row so all the data is visualized on the screen. Hence -d 2 in cases, where more thorough debug is necessery is better. However for a quick routine view watch + iostat is great too.

c) Outputting extra information for HDD input/output operations;

root@debian:~# iostat -x
Linux 2.6.32-5-amd64 (debian) 03/27/2012 _x86_64_ (8 CPU)
avg-cpu: %user %nice %system %iowait %steal %idle
15.34 0.36 2.76 2.66 0.00 78.88
Device: rrqm/s wrqm/s r/s w/s rsec/s wsec/s avgrq-sz avgqu-sz await svctm %util
sda 4.22 2047.33 12.01 51.88 977.44 16785.96 278.03 0.28 4.35 3.87 24.72
sdb 3.80 2047.61 11.97 52.15 906.93 16858.32 277.05 0.03 5.25 3.87 24.84
md0 0.00 0.00 20.72 2098.28 441.75 16784.05 8.13 0.00 0.00 0.00 0.00

This command will output extended useful Hard Disk info like;
r/s – number of read requests issued per second
w/s – number of write requests issued per second
rsec/s – numbers of sector reads per second
b>wsec/s – number of sectors wrote per second
etc. etc.

Most of ppl will never need to use this, but it is good to know it exists.

3. Tracking read / write (i/o) hard disk bottlenecks on FreeBSD

BSD's iostat is a bit different in terms of output and arguments.

a) Here is most basic use:

freebsd# /usr/sbin/iostat
tty ad0 cpu
tin tout KB/t tps MB/s us ni sy in id
1 561 45.18 44 1.95 14 0 5 0 82

b) Periodic watch of hdd i/o operations;

freebsd# iostat -c 10
tty ad0 cpu
tin tout KB/t tps MB/s us ni sy in id
1 562 45.19 44 1.95 14 0 5 0 82
0 307 51.96 113 5.73 44 0 24 0 32
0 234 58.12 98 5.56 16 0 7 0 77
0 43 0.00 0 0.00 1 0 0 0 99
0 485 0.00 0 0.00 2 0 0 0 98
0 43 0.00 0 0.00 0 0 1 0 99
0 43 0.00 0 0.00 0 0 0 0 100
...

As you see in the output, there is information like in the columns tty, tin, tout which is a bit hard to comprehend.
Thanksfully the tool has an option to print out only more essential i/o information:

freebsd# iostat -d -c 10
ad0
KB/t tps MB/s
45.19 44 1.95
58.12 97 5.52
54.81 108 5.78
0.00 0 0.00
0.00 0 0.00
0.00 0 0.00
20.48 25 0.50

The output info is quite self-explanatory.

Displaying a number of iostat values for hard disk reads can be also achieved by omitting -c option with:

freebsd# iostat -d 1 10
...

Tracking a specific hard disk partiotion with iostat is done with:

freebsd# iostat -n /dev/ad0s1a
tty cpu
tin tout us ni sy in id
1 577 14 0 5 0 81
c) Getting Hard disk read/write information with gstat

gstat is a FreeBSD tool to print statistics for GEOM disks. Its default behaviour is to refresh the screen in a similar fashion like top command, so its great for people who would like to periodically check all attached system hard disk and storage devices:

freebsd# gstat
dT: 1.002s w: 1.000s
L(q) ops/s r/s kBps ms/r w/s kBps ms/w %busy Name
0 10 0 0 0.0 10 260 2.6 15.6| ad0
0 10 0 0 0.0 10 260 2.6 11.4| ad0s1
0 10 0 0 0.0 10 260 2.8 12.5| ad0s1a
0 0 0 0 0.0 0 0 0.0 20.0| ad0s1b
0 0 0 0 0.0 0 0 0.0 0.0| ad0s1c
0 0 0 0 0.0 0 0 0.0 0.0| ad0s1d
0 0 0 0 0.0 0 0 0.0 0.0| ad0s1e
0 0 0 0 0.0 0 0 0.0 0.0| acd0

It even has colors if your tty supports colors 🙂

Another useful tool in debugging the culprit of excessive hdd I/O operations is procstat command:

Here is a sample procstat run to track (httpd) one of my processes imposing i/o hdd load:

freebsd# procstat -f 50404
PID COMM FD T V FLAGS REF OFFSET PRO NAME
50404 httpd cwd v d -------- - - - /
50404 httpd root v d -------- - - - /
50404 httpd 0 v c r------- 56 0 - -
50404 httpd 1 v c -w------ 56 0 - -
50404 httpd 2 v r -wa----- 56 75581 - /var/log/httpd-error.log
50404 httpd 3 s - rw------ 105 0 TCP ::.80 ::.0
50404 httpd 4 p - rw---n-- 56 0 - -
50404 httpd 5 p - rw------ 56 0 - -
50404 httpd 6 v r -wa----- 56 25161132 - /var/log/httpd-access.log
50404 httpd 7 v r rw------ 56 0 - /tmp/apr8QUOUW
50404 httpd 8 v r -w------ 56 0 - /var/run/accept.lock.49588
50404 httpd 9 v r -w------ 1 0 - /var/run/accept.lock.49588
50404 httpd 10 v r -w------ 1 0 - /tmp/apr8QUOUW
50404 httpd 11 ? - -------- 2 0 - -

Btw fstat is sometimes helpful in identifying the number of open files and trying to estimate which ones are putting the hdd load.
Hope this info helps someone. If you know better ways to track hdd excessive loads on Linux / BSD pls share 'em pls.
 

FreeBSD Happy Birthday – FreeBSD OS turns 20 years old

Monday, June 24th, 2013

Happy Birrthday Freebsd / FreeBSD becomes 20 years old - Classic logo bsd avatar beastie mascot

On 19th of June FreeBSD had its 20 birthday! Its great joy for us the FreeBSD geeks 🙂
This is a bit outdated but as I'm a long years FreeBSD user I found myself obliged to mention the good news.

FreeBSD project was officially introduced for first time under the new name by David Greenman, Jordan Hubbard and Rod Grimes as fork of BSD (Berkley Software Distrbution 4.3).

Even more and less known is that big chunks of FreeBSD (kernel and userland) code are running on the shiny Mac OS X.

Below is mail which made up the name FreeBSD 🙂
 

To: interim@bsd.coe.montana.edu (Interim 0.1.5)
Subject: Re: “386BSD” trademark (fwd)
From: David Greenman <davidg@implode.rain.com>
Date: Sat, 19 Jun 93 17:26:02 -0700

> Okay folks.. taking new name suggestions.. we have:
>
> BSDFree86 – Rod, who is going with Jordans improved NON BSDI name..
> Free86BSD – Jordan, Rod likes this one two…
> – (F86BSD for short)
>
> vvvvvvvvvvvvvvvvvvvvvvvvvvvvvvvvvvvvvvvvvvvvvvvvvvvvvvvvv
>                v                                                                     v
>                v          This is the hat to drop yours in!       v
>                v                                                                     v
>                vvvvvvvvvvvvvvvvvvvvvvvvvvvvvvvvvvvvvvvvv

How about just simply “FreeBSD”? No confusion, no fuss, seems like a good compromise to me. 🙂

-DG

FreeBSD Berkley Software Distrubution OS new logo happy birthday FreeBSD

Now 20 years after, FreeBSD itself had numerous forks very much in tradition of Free Software – most notable ones are of course BSD for desktop DragonFly BSD and PC-BSD.
As part of FreeBSD evolution nowadays FreeBSD kernel is ported for Debian Linux, i.e.:

debian:~# apt-cache show kfreebsd-source-8.1|grep -i description -A 2

Description: source code for kernel of FreeBSD 8.1 with Debian patches

 This package provides the source code for kernel of FreeBSD 8.1, base of

 a GNU/kFreeBSD system.

Description: source code for kernel of FreeBSD 8.1 with Debian patches

 This package provides the source code for kernel of FreeBSD 8.1, base of

 a GNU/kFreeBSD system.


 and can be run onas substitute for Linux kernel on most GNU / Linux distributions 
 

FreeBSD has unquestionably played key role over the last 20 yrs for development of Hacker Culture of Freedom and Free Software.

 Congrats and cheers to all FreeBSD users! 🙂  

How to fix postfix mail server error ‘relay access denied’ on FreeBSD

Wednesday, January 30th, 2013

If you're running a newly configured Postfix SMTP server and you get in /var/log/maillog errors like:

Relay access denied

i.e. in log whenever you try to deliver a mail to the mail server you get something like:

Jan 29 10:05:04 600h postfix/smtpd[4624]: NOQUEUE: reject: RCPT from mxtb-pws3.mxtoolbox.com[64.20.227.133]: 554 5.7.1 <test@example.com>: Relay access denied; from=<supertool@mxtoolbox.com> to=<test@example.com> proto=ESMTP helo=<please-read-policy.mxtoolbox.com>

This is to because the virtualdomain to which postfix is trying to deliver is not added among the domains for which relaying is allowed.

To fix it edit /etc/postfix/main.cf ; find line

relay_domains = $mydestination

and add all domains, for which relaying should be allowed. Let's say you have virtual domains example.com and example1.com to enable relaying, add to conf:

relay_domains = $mydestination example.com example1.com

Also whether, virtual domain names are read from a separate configured hashed .db file like /etc/postfix/virtual.db

Usually done via /etc/postfix/main.cf via vars:

virtual_mailbox_maps = hash:/etc/postfix/virtual
virtual_alias_maps = hash:/etc/postfix/virtual

Its necessery to run cmd;

postmap virtual
# ls -al /etc/postfix/virtual*
-rwxrwxrwx  1 root  wheel      45 Jan 29 05:27 /etc/postfix/virtual
-rwxrwxrwx  1 root  wheel  131072 Jan 29 10:58 /etc/postfix/virtual.db

This command re-builds virtual.db including all newly input domains in /etc/postfix/virtual

Finally to load new configs its necessary to restart postfix;

This particular Postfix is running on FreeBSD so to restart it;

# /etc/rc.d/postfix restart
....