Posts Tagged ‘server load’

Auto restart Apache on High server load (bash shell script) – Fixing Apache server temporal overload issues

Saturday, March 24th, 2012

auto-restart-apache-on-high-load-bash-shell-script-fixing-apache-temporal-overload-issues

I've written a tiny script to check and restart, Apache if the server encounters, extremely high load avarage like for instance more than (>25). Below is an example of a server reaching a very high load avarage:;

server~:# uptime
13:46:59 up 2 days, 18:54, 1 user, load average: 58.09, 59.08, 60.05
load average: 0.09, 0.08, 0.08

Sometimes high load avarage is not a problem, as the server might have a very powerful hardware. A high load numbers is not always an indicator for a serious problems. Some 16 CPU dual core (2.18 Ghz) machine with 16GB of ram could probably work normally with a high load avarage like in the example. Anyhow as most servers are not so powerful having such a high load avarage, makes the machine hardly do its job routine.

In my specific, case one of our Debian Linux servers is periodically reaching to a very high load level numbers. When this happens the Apache webserver is often incapable to serve its incoming requests and starts lagging for clients. The only work-around is to stop the Apache server for a couple of seconds (10 or 20 seconds) and then start it again once the load avarage has dropped to less than "3".

If this temporary fix is not applied on time, the server load gets increased exponentially until all the server services (ssh, ftp … whatever) stop responding normally to requests and the server completely hangs …

Often this server overloads, are occuring at night time so I'm not logged in on the server and one such unexpected overload makes the server unreachable for hours.
To get around the sudden high periodic load avarage server increase, I've written a tiny bash script to monitor, the server load avarage and initiate an Apache server stop and start with a few seconds delay in between.

#!/bin/sh
# script to check server for extremely high load and restart Apache if the condition is matched
check=`cat /proc/loadavg | sed 's/\./ /' | awk '{print $1}'`
# define max load avarage when script is triggered
max_load='25'
# log file
high_load_log='/var/log/apache_high_load_restart.log';
# location of inidex.php to overwrite with temporary message
index_php_loc='/home/site/www/index.php';
# location to Apache init script
apache_init='/etc/init.d/apache2';
#
site_maintenance_msg="Site Maintenance in progress - We will be back online in a minute";
if [ $check -gt "$max_load" ]; then>
#25 is load average on 5 minutes
cp -rpf $index_php_loc $index_php_loc.bak_ap
echo "$site_maintenance_msg" > $index_php_loc
sleep 15;
if [ $check -gt "$max_load" ]; then
$apache_init stop
sleep 5;
$apache_init restart
echo "$(date) : Apache Restart due to excessive load | $check |" >> $high_load_log;
cp -rpf $index_php_loc.bak_ap $index_php_loc
fi
fi

The idea of the script is partially based on a forum thread – Auto Restart Apache on High Loadhttp://www.webhostingtalk.com/showthread.php?t=971304Here is a link to my restart_apache_on_high_load.sh script

The script is written in a way that it makes two "if" condition check ups, to assure 100% there is a constant high load avarage and not just a temporal 5 seconds load avarage jump. Once the first if is matched, the script first tries to reduce the server load by overwritting a the index.php, index.html script of the website with a one stating the server is ongoing a maintenance operations.
Temporary stopping the index page, often reduces the load in 10 seconds of time, so the second if case is not necessery at all. Sometimes, however this first "if" condition cannot decrease enough the load and the server load continues to stay too high, then the script second if comes to play and makes apache to be completely stopped via Apache init script do 2 secs delay and launch the apache server again.

The script also logs about, the load avarage encountered, while the server was overloaded and Apache webserver was restarted, so later I can check what time the server overload occured.
To make the script periodically run, I've scheduled the script to launch every 5 minutes as a cron job with the following cron:

# restart Apache if load is higher than 25
*/5 * * * * /usr/sbin/restart_apache_on_high_load.sh >/dev/null 2>&1

I have also another system which is running FreeBSD 7_2, which is having the same overload server problems as with the Linux host.
Copying the auto restart apache on high load script on FreeBSD didn't work out of the box. So I rewrote a little chunk of the script to make it running on the FreeBSD host. Hence, if you would like to auto restart Apache or any other service on FreeBSD server get /usr/sbin/restart_apache_on_high_load_freebsd.sh my script and set it on cron on your BSD.

This script is just a temporary work around, however as its obvious that the frequency of the high overload will be rising with time and we will need to buy new server hardware to solve permanently the issues, anyways, until this happens the script does a great job 🙂

I'm aware there is also alternative way to auto restart Apache webserver on high server loads through using monit utility for monitoring services on a Unix system. However as I didn't wanted to bother to run extra services in the background I decided to rather use the up presented script.

Interesting info to know is Apache module mod_overload exists – which can be used for checking load average. Using this module once load avarage is over a certain number apache can stop in its preforked processes current serving request, I've never tested it myself so I don't know how usable it is. As of time of writting it is in early stage version 0.2.2
If someone, have tried it and is happy with it on a busy hosting servers, please share with me if it is stable enough?

Rsync slow data (bandwidth limit) transferring on productive Linux / *BSD servers to 2nd

Thursday, March 7th, 2013

If amount of Unique users on website has increased dramatically and Apache + PHP server starts to get user load higher than 50% in times of most users site activity then it is time to move to think of migrating data on more powerful Server hardware.

Moving few thousands of Gigabytes of PHP, JS, PNG, JPG images and plain text files data from a productive host to another puts an extra burden on hard disk Input / Output (I/O) operations, thus risking to put extraordinary server load and make websites on server inaccessible. The normal way I copy data on less busy servers is create  .tar.gz archive of data from one server and transfer with sftp or scp. In this situation, doing so however puts too much load on server and thus is risking to stone the server and make it inaccessible to users. A solution to problem is to use rsync instead, synchronizing data between the servers by instructing it to transfer data from one hard disk to another via network using a maximum read/write bandwidth.

rsync command argument specifying a maximum bandwidth is --bwlimit=KBPS

To transfer data between two servers specifyinga maximum transfer bandwidth of 10MB per second you have to pass 2MBytes as it is in megabytes (2*1024Kb) = 2048.

Hence to make the transfer while logged to current productive server via SSH to host server with IP XXX.XXX.XXX.XXX I used:
w:~# cd /home/sites
w:/home/sites# /usr/bin/rsync --bwlimit=2048 -avz -e ssh . root@XXX.XXX.XXX.XXX:/home/sites/

The arguments to above rsync command are clear enough (-e ssh) – tells to use ssh as data transfer protocol, (root@) – specifies to connect to second server with root user and (:/home/sites/) – tells rsync to transfer to remote server to same directory (/home/sites/) like from which copying.

Bear in mind that, in order this method to work, rsync has to be installed both on the server from which data is transferred and to second one to where data is transferred.
Since rsync is available in Linux as well as has port in FreeBSD / NetBSD / OpenBSD ports tree, same way to transfer "web data" while upgrading BSD OS host to another is possible.

How to tune MySQL Server to increase MySQL performance using mysqltuner.pl and Tuning-primer.sh

Tuesday, August 9th, 2011

MySQL Easy performance tuning with mysqltuner.pl and Tuning-primer.sh scripts

Improving MySQL performance is crucial for improving a website responce times, reduce server load and improve overall work efficiency of a mysql database server.

I’ve seen however many Linux System administrators who does belittle or completely miss the significance of tuning a newly installed MySQL server installation.
The reason behind that is probably caused by fact that many people think MySQL config variables, would not significantly improve performance and does not pay back for optimization efforts. Moreover there are a bunch of system admins who has to take care for numerous services so they don’t have time to get good knowledge to optimize MySQL servers.
Thus many admins and webmasters nowdays, think optimizations depend mostly on the side of the website programmers.
It’s also sometimes falsely believed that optimizing a MySQL server could reduce the overall server stability.

With the boom of Internet website building and internet marketing, many webmasters emerged and almost anybody with almost no knowledge on GNU/Linux or minimal or no knowledge on PHP can start his Online store, open a blog or create a website powered by some CMS like joomla.
Thus nowdays many servers even doesn’t have a hired system administrators but are managed by people whose knowledge on *Nix is almost next to zero, this is another reason why dozens of MySQL installations online are a default ones and are not taking a good advantage of the server hardware.

The incrase of website visitors leads people servers expectations for hardware also to grow, thus many companies simply buy a new hardware instead of taking the few time to investigate on how current server hardware can be utilized better.
In that manner of thought I though it will be a good idea to write this small article on Tuning mysql servers with two scripts Tuning-primer.sh and mysqltuner.pl.
The scripts are ultra easy to use and does not require only a minimal knowledge on MySQL, Linux or (*BSD *nix if sql is running on BSD).
Tuning-primer.sh and mysqltuner.pl are therefore suitable for a quick MySQL server optimizations to even people who are no computer experts.

I use this two scripts for MySQL server optimizations on almost every new configured GNU/Linux with a MySQL backend.
Use of the script comes to simply download with wget, lynx, curl or some other web client and execute it on the server host which is already running the MySQL server.

Here is an example of how simple it is to run the scripts to Optimize MySQL:

debian:~# perl mysqltuner.pl
>> MySQLTuner 1.2.0 - Major Hayden >major@mhtx.net<
>> Bug reports, feature requests, and downloads at http://mysqltuner.com/
>> Run with '--help' for additional options and output filtering

——– General Statistics ————————————————–
[–] Skipped version check for MySQLTuner script
[OK] Currently running supported MySQL version 5.1.49-3
[OK] Operating on 64-bit architecture

——– Storage Engine Statistics ——————————————-
[–] Status: +Archive -BDB -Federated +InnoDB -ISAM -NDBCluster
[–] Data in MyISAM tables: 6G (Tables: 952)
[!!] InnoDB is enabled but isn’t being used
[!!] Total fragmented tables: 12

——– Security Recommendations ——————————————-
[OK] All database users have passwords assigned

——– Performance Metrics ————————————————-
[–] Up for: 1d 2h 3m 35s (68M q [732.193 qps], 610K conn, TX: 49B, RX: 11B)
[–] Reads / Writes: 76% / 24%
[–] Total buffers: 512.0M global + 2.8M per thread (2000 max threads)
[OK] Maximum possible memory usage: 6.0G (25% of installed RAM)
[OK] Slow queries: 0% (3K/68M)
[OK] Highest usage of available connections: 7% (159/2000)
[OK] Key buffer size / total MyISAM indexes: 230.0M/1.7G
[OK] Key buffer hit rate: 97.8% (11B cached / 257M reads)
[OK] Query cache efficiency: 76.6% (46M cached / 61M selects)
[!!] Query cache prunes per day: 1822075
[OK] Sorts requiring temporary tables: 0% (1K temp sorts / 2M sorts)
[!!] Joins performed without indexes: 63635
[OK] Temporary tables created on disk: 1% (26K on disk / 2M total)
[OK] Thread cache hit rate: 99% (159 created / 610K connections)
[!!] Table cache hit rate: 4% (1K open / 43K opened)
[OK] Open file limit used: 17% (2K/16K)
[OK] Table locks acquired immediately: 99% (36M immediate / 36M locks)

——– Recommendations —————————————————–
General recommendations:
Add skip-innodb to MySQL configuration to disable InnoDB
Run OPTIMIZE TABLE to defragment tables for better performance
Enable the slow query log to troubleshoot bad queries
Increasing the query_cache size over 128M may reduce performance
Adjust your join queries to always utilize indexes
Increase table_cache gradually to avoid file descriptor limits
Variables to adjust:
query_cache_size (> 256M) [see warning above] join_buffer_size (> 256.0K, or always use indexes with joins) table_cache (> 7200)

You see there are plenty of things, the script reports, for the unexperienced most of the information can be happily skipped without need to know the cryptic output, the section of importance here is Recommendations for some clarity, I’ve made this section to show up bold.

The most imporant things from the Recommendations script output is actually the lines who give suggestions for incrase of certain variables for MySQL.In this example case this are the last three variables:
query_cache_size,
join_buffer_size and
table_cache

All of these variables are tuned from /etc/mysql/my.cnf (on Debian) and derivatives distros and from /etc/my.cnf on RHEL, CentOS, Fedora and the other RPM based Linux distributions.

On some custom server installs my.cnf is also located in /usr/local/mysql/etc/ or some other a bit more unstandard location 😉

Anyways now having the Recommendation from the script, it’s necessery to edit my.cnf and try to double the values for the suggested variables.

First, I check if all the suggested variables are existent in my config with grep , if they’re not then I’ll simply add the variable with doubled size of the suggested values.
P.S: One note here is sometimes some values which are configured, are the default value for the MySQL server and does not have a record in my.cnf

debian:~# grep -E 'query_cache_size|join_buffer_size|table_cache' /etc/mysql/my.cnf table_cache = 7200
query_cache_size = 256M
join_buffer_size = 262144

All of my variables are in the config so, now edit my.cnf and set values to:
table_cache = 14400
query_cache_size = 512M
join_buffer_size = 524288

I always, however preserve the old variable’s value, because sometimes raising the value might create problem and the MySql server might be unable to restart properly.
Thus before going with adding the new values make sure the old ones are commented with # , e.g.:
#table_cache = 7200
#query_cache_size = 256M
#join_buffer_size = 262144

I would recommend vim as editor of choice while editing my.cnf as vim completely rox 😉 If you’re not acquainted to vim use nano or mcedit or your editor of choice 😉 :

debian:~# vim /etc/mysql/my.cnf
...

Assuming that the changes are made, it’s time to restart MySQL to make sure the new values are read by the SQL server.

debian:~# /etc/init.d/mysql restart
* Stopping MySQL database server mysqld [ OK ]
* Starting MySQL database server mysqld [ OK ]
Checking for tables which need an upgrade, are corrupt or were not closed cleanly.

If mysql server fails, however to restart, make sure immediately you reverse back the changed variables to the commented values and restart once again via mysql init script to make server load.

Afterwards start adding the values one by one until find out which one is causing the mysqld to fail.

Now the second script (Tuning-primer.sh) is also really nice for MySQL performance optimizations are necessery. However it’s less portable (as it’s written in bash scripting language).
Consider running this script among different GNU/Linux distributious (especially the newer ones) might produce errors.
Tuning-primer.sh requires some minor code changes to be able to run on FreeBSD, NetBSD and OpenBSD *nices.

The way Tuning-primer.sh works is precisely like mysqltuner.pl , one runs it it gives some info about current running MySQL server and based on certain factors gives suggestions on how increasing or decresing certain my.cnf variables could reduce sql query bottlenecks, solve table locking issues as well as generally improve INSERT, UPDATE query times.

Here is an example output from tuning-primer.sh run on another server:

server:~# wget https://www.pc-freak.net/files/Tuning-primer.sh
...
server:~# sh Tuning-primer.sh
-- MYSQL PERFORMANCE TUNING PRIMER --
- By: Matthew Montgomery -

MySQL Version 5.0.51a-24+lenny5 x86_64

Uptime = 8 days 10 hrs 19 min 8 sec
Avg. qps = 179
Total Questions = 130851322
Threads Connected = 1

Server has been running for over 48hrs.
It should be safe to follow these recommendations

To find out more information on how each of these
runtime variables effects performance visit:
http://dev.mysql.com/doc/refman/5.0/en/server-system-variables.html

SLOW QUERIES
Current long_query_time = 1 sec.
You have 16498 out of 130851322 that take longer than 1 sec. to complete
The slow query log is NOT enabled.
Your long_query_time seems to be fine

MAX CONNECTIONS
Current max_connections = 2000
Current threads_connected = 1
Historic max_used_connections = 85
The number of used connections is 4% of the configured maximum.
Your max_connections variable seems to be fine.

WORKER THREADS
Current thread_cache_size = 128
Current threads_cached = 84
Current threads_per_sec = 0
Historic threads_per_sec = 0
Your thread_cache_size is fine

MEMORY USAGE
Tuning-primer.sh: line 994: let: expression expected
Max Memory Ever Allocated : 741 M
Configured Max Memory Limit : 5049 M
Total System Memory : 23640 M

KEY BUFFER
Current MyISAM index space = 1646 M
Current key_buffer_size = 476 M
Key cache miss rate is 1 / 56
Key buffer fill ratio = 90.00 %
You could increase key_buffer_size
It is safe to raise this up to 1/4 of total system memory;
assuming this is a dedicated database server.

QUERY CACHE
Query cache is enabled
Current query_cache_size = 64 M
Current query_cache_used = 38 M
Current Query cache fill ratio = 59.90 %

SORT OPERATIONS
Current sort_buffer_size = 2 M
Current record/read_rnd_buffer_size = 256.00 K
Sort buffer seems to be fine

JOINS
Current join_buffer_size = 128.00 K
You have had 111560 queries where a join could not use an index properly
You have had 91 joins without keys that check for key usage after each row
You should enable “log-queries-not-using-indexes”
Then look for non indexed joins in the slow query log.
If you are unable to optimize your queries you may want to increase your
join_buffer_size to accommodate larger joins in one pass.

TABLE CACHE
Current table_cache value = 3600 tables
You have a total of 798 tables
You have 1904 open tables.
The table_cache value seems to be fine

TEMP TABLES
Current tmp_table_size = 128 M
1% of tmp tables created were disk based
Created disk tmp tables ratio seems fine

TABLE SCANS
Current read_buffer_size = 128.00 K
Current table scan ratio = 797 : 1
read_buffer_size seems to be fine

TABLE LOCKING
Current Lock Wait ratio = 1 : 1782
You may benefit from selective use of InnoDB.

As seen from script output, there are certain variables which might be increased a bit for better SQL performance, one such variable as suggested is key_buffer_size(You could increase key_buffer_size)

Now the steps to make the tunings to my.cnf are precisely the same as with mysqltuner.pl, e.g.:
1. Preserve old config variables which will be changed by commenting them
2. Double value of current variables in my.cnf suggested by script
3. Restart Mysql server via /etc/init.d/mysql restart cmd.
4. If mysql runs fine monitor mysql performance with mtop or mytop for at least 15 mins / half an hour.

if all is fine run once again the tuning scripts to see if there are no further improvement suggestions, if there are more follow the 4 steps described procedure once again.

It’s also a good idea that these scripts are periodically re-run on the server like once per few months as changes in SQL queries amounts and types will require changes in MySQL operational variables.
The authors of these nice scripts has done great job and have saved us a tons of nerves time, downtimes and money spend on meaningless hardware. So big thanks for the awesome scripts guys 😉
Finally after hopefully succesful deployment of changes, enjoy the incresed SQL server performance 😉

How to disable ACPI (power saving) support in FreeBSD / Disable acpi on BSD kernel boot time

Tuesday, May 15th, 2012

FreeBSD disable ACPI how ACPI Basic works basic diagram

On FreeBSD the default kernel is compiled to support ACPI. Most of the modern PCs has already embedded support for ACPI power saving instructions.
Therefore a default installed FreeBSD is trying to take advantage of this at cases and is trying to save energy.
This is not too useful on servers, because saving energy could have at times a bad impact on server performance if the server is heavy loaded at times and not so loaded at other times of the day.

Besides that on servers saving energy shouldn't be the main motivator but server stability and productivity is. Therefore in my personal view on FreeBSD used on servers it is better to disable complete the ACPI in order to disable CPU fan control to change rotation speeds all the time from low to high rotation cycles and vice versa at times of low / high server load.

Another benefit of removing the ACPI support on a server is this would probably increase the CPU fan life span and possibly prevent the CPU to be severely heated at times.

Moreover, some piece of hardware might have troubles in properly supporting ACPI specifications and thus ACPI could be a reason for unexpected machine hang ups.

With all said I would recommend to anyone willing to use BSD for a server to disable the ACPI (Advanced Configuration and Power Interface), just like I did.

Here is how;

1. Quick review on how ACPI is handled on FreeBSD

acpi support is being handled on FreeBSD by a number of loadable kernel modules, here is a complete list of all the kernel modules dealins with acpi:

freebsd# cd /boot
freebsd# find . -iname '*acpi*.ko'
./kernel/acpi.ko
./kernel/acpi_aiboost.ko
./kernel/acpi_asus.ko
./kernel/acpi_fujitsu.ko
./kernel/acpi_ibm.ko
./kernel/acpi_panasonic.ko
./kernel/acpi_sony.ko
./kernel/acpi_toshiba.ko
./kernel/acpi_video.ko
./kernel/acpi_dock.ko

By default on FreeBSD, if hardware has some support for ACPI the acpi gets activated by acpi.ko kernel module. The specific type of vendors specific ACPI like IBM, ASUS, Fujitsu are controlled by the respective kernel module from the list …

Hence, to control if ACPI is loaded or not on a FreeBSD system with no need to reboot one can use kldload, kldunload module management BSD cmds.

a) Check if acpi is loaded on a BSD

freebsd# kldstatkldstat | grep -i acpi
9 1 0xc9260000 57000 acpi.ko

b) unload kernel enabled ACPI support

freebsd# kldunload acpi

c) Load acpi support (not the case with me but someone might need it, if for instance BSD is running on laptop)

freebsd# kldload acpi

2. Disabling ACPI to load on bootup on BSD

a) In /boot/loader.conf add the following variables:

hint.acpi.0.disabled="1"
hint.p4tcc.0.disabled=1
hint.acpi_throttle.0.disabled=1


b) in /boot/device.hints add:

hint.acpi.0.disabled="1"

c) in /boot/defaults/loader.conf make sure:

##############################################################
### ACPI settings ##########################################
##############################################################
acpi_dsdt_load="NO" # DSDT Overriding
acpi_dsdt_type="acpi_dsdt" # Don't change this
acpi_dsdt_name="/boot/acpi_dsdt.aml"
# Override DSDT in BIOS by this file
acpi_video_load="NO" # Load the ACPI video extension driver

d) disable ACPI thermal monitoring

It is generally a good idea to disable the ACPI thermal monitoring, as many machines hardware does not support it.

To do so in /boot/loader.conf add

debug.acpi.disabled="thermal"

If you want to learn more on on how ACPI is being handled on BDSs check out:

freebsd# man acpi

Other alternative method to permanently wipe out ACPI support is by not compiling ACPI support in the kernel.
If that's the case in /usr/obj/usr/src/sys/GENERIC make sure device acpi is commented, e.g.:

##device acpi


How to disable nginx static requests access.log logging

Monday, March 5th, 2012

NGINX logo Static Content Serving Stop logging

One of the companies, where I'm employed runs nginx as a CDN (Content Delivery Network) server.
Actually nginx, today has become like a standard for delivering tremendous amounts of static content to clients.
The nginx, server load has recently increased with the number of requests, we have much more site visitors now.
Just recently I've noticed the log files are growing to enormous sizes and in reality this log files are not used at all.
As I've used disabling of web server logging as a way to improve Apache server performance in past time, I thought of implying the same little "trick" to improve the hardware utilization on the nginx server as well.

To disable logging, I proceeded and edit the /usr/local/nginx/conf/nginx.conf file, commenting inside every occurance of:

access_log /usr/local/nginx/logs/access.log main;

to

#access_log /usr/local/nginx/logs/access.log main;

Next, to load the new nginx.conf settings I did a restart:

nginx:~# killall -9 nginx; sleep 1; /etc/init.d/nginx start

I expected, this should be enough to disable completely access.log, browser request logins. Unfortunately /usr/local/nginx/logs/access.log was still displaying growing with:

nginx:~# tail -f /usr/local/nginx/logs/access.log

After a bit thorough reading of nginx.conf config rules, I've noticed there is a config directive:

access_log off;

Therefore to succesfully disable logging I had to edit config occurance of:

access_log /usr/local/nginx/logs/access.log main

to

After a bit thorough reading of nginx.conf config rules, I've noticed there is a config directive:

access_log off;

Therefore to succesfully disable logging I had to edit config occurance of:

access_log /usr/local/nginx/logs/access.log main

to

access_log /usr/local/nginx/logs/access.log main
access_log off;

Finally to load the new settings, which thanksfully this time worked, I did nginx restart:

nginx:~# killall -9 nginx; sleep 1; /etc/init.d/nginx start

And hooray! Thanks God, now nginx logging is disabled!

As a result, as expected the load avarage on the server reduced a bit 🙂

Two wordpress plugins to accelerate wordpress opening times and decrease server load time

Thursday, September 22nd, 2011

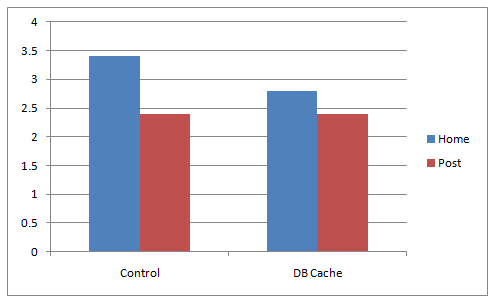
A Comparison of wordpress webpage responce with and without wp dbcache

A combination of two wordpress caching plugins (Hyper Cache and Db Cachesignificantly improves the access times of a wordpress based blogs and websites.

Installing the two websites has drastically improved my blog opening times, so in my view having the two plugins on every wordpress install out there is a must! 🙂
The plugins installation is straight forward, here is how I installed them.

1. Installing Hyper Cache on WordPress

To install Hyper Cache all I had to do is download and enable the plugin, the plugin doesn’t require any configuration. I always love it when I don’t have to bother with reading configuration options and pondering for some 20 minutes on the plugin features, so in that perspective Hyper Cache in my view is a good alternative to WordPress Super Cache

Besides that WordPress Super Cache was having issues when enabled on few wordpress based websites I manage these days. For comparison Hyper Cache worked just great on all wordpress install I tried the plugin so far.

To install all I had to do is download the plugin unzip and enable it:

a. Download and unzip it

debian:/var/www/blog# wget http://downloads.wordpress.org/plugin/hyper-cache.zip
...
debian:/var/www/blog# cd wp-content/plugins
debian:/var/www/blog/wp-content/plugins# unzip hyper-cache.zip

b. Enable Hyper Cache plugin

To enable the plugin follow to standard plugin location;

Plugins -> Inactive -> Hyper Cache (Enable)

To enable the plugin follow to standard plugin location;

Plugins -> Inactive -> Hyper Cache (Enable)


A  mirror of current version of hyper-cache.zip plugin is here 

2. Installing Wodpress Db Cache

What Db Cache, does it does caching of last queries made to MySQL for specified time, so if the query has to be refetched again from wordpress’s php frontend the queries results are fetched straight for the memory. This decreases the load towards the MySQL server and increases the webpages loading time.

As the plugin page suggests it’s way faster than other html caching-plugins like WP-Cache  or WP Super Cache

However, I think its still slower than using a combination of WP Super Cache’s alternative Hyper Cache  and  Db Cache . Combining this two could rise the webpage opening times according to some statisticonline at best cases up to 830% !! 😉 Let me proceed with how I did the install of  Db Cache .

a. Download and Install Db Cache


debian:/var/www/blog/wp-content/plugins# wget http://downloads.wordpress.org/plugin/db-cache.0.6.zip

...

debian:/var/www/blog/wp-content/plugins# unzip db-cache.0.6.zip


b. Enable the plugin 


Plugins -> Inactive -> Db Cache (Enable)


c. Make sure the permissions for Db Cache are correct

On Debian to enable Db Cache, the permissions should be changed for Apache to have a read/write permissions to plugin directory, on Debian to fix the permissions I used the commands:

debian:/var/www/blog# chown www-data:www-data wp-content

debian:/var/www/blog# chown -R www-data:www-data wp-content/plugins/db-cache

On other GNU/Linux distributions the above commands (user and group) www-data:www-data, should be set to whatever user/group Apache is running with, on Slackware this would be nobody:nobody, on CentOS and RHEL it would be apache:apache.

Finally to enable Db Cache go to

Settings -> Db Cache -> (Tick Enable) -> Save

I’ve also made a mirror of Db Cache plugin here

Enjoy the speed boost 😉

How to automatically reboot (restart) Debian GNU Lenny / Squeeze Linux on kernel panic, some general CPU overload or system crash

Monday, June 21st, 2010

If you are a system administrator, you have probably wondered at least once ohw to configure your Linux server to automatically reboot itself if it crashes, is going through a mass CPU overload, e.g. the server load average “hits the sky”.
I just learned from a nice article found here that there is a kernel variable which when enabled takes care to automatically restart a crashed server with the terrible Kernel Panic message we all know.

The variable I’m taking about is kernel.panic for instance kernel.panic = 20 would instruct your GNU Linux kernel to automatically reboot if it experiences a kernel panic system crash within a time limit of 20 seconds.

To start using the auto-reboot linux capabilities on a kernel panic occurance just set the variable to /etc/sysctl.conf

debian-server:~# echo 'kernel.panic = 20' >> /etc/sysctl.conf

Now we will also have to enable the variable to start being use on the system, so execute:

debian-server:~# sysctl -p There you go automatic system reboots on kernel panics is now on.
Now to further assure yourself the linux server you’re responsible of will automatically restart itself on a emergency situation like a system overload I suggest you check Watchdog

You might consider checking out this auto reboot tutorial which explains in simple words how watchdog is installed and configured.
On Debian installing and maintaining watchdog is really simple and comes to installing and enabling the watchdog system service, right afteryou made two changes in it’s configuration file /etc/watchdog.conf

To do so execute:

debian-server:~# apt-get install watchdog
debian-server:~# echo "file = /var/log/messages" >> /etc/watchdog.conf
debian-server:~# echo "watchdog-device = /dev/watchdog" >> /etc/watchdog.conf

Well that should be it, you might also need to load some kernel module to monitor your watchdog.
On my system the kernel modules related to watchdog are located in:

/lib/modules/2.6.26-2-amd64/kernel/drivers/watchdog/
If not then you should certainly try the software watchdog linux kernel module called softdog , to do so issue:
debian-server:~# /sbin/modprobe softdog

It’s best if you load the module while the softdog daemon is disabled.
If you consider auto loadig the softdog software watchdog kernel driver you should exec:

debian-server:~# echo 'softdog' >> /etc/modules

Finally a start of the watchdog is necessery:


debian-server:~# /etc/init.d/watchdog start
Stopping watchdog keepalive daemon....
Starting watchdog daemon....

That should be all your automatic system reboots should be now on! 🙂