Posts Tagged ‘use’

How to count number of ESTABLISHED state TCP connections to a Windows server

Wednesday, March 13th, 2024

count-netstat-established-connections-on-windows-server-howto-windows-logo-debug-network-issues-windows

Even if you have the background of a Linux system administrator, sooner or later you will have have to deal with some Windows hosts, thus i'll blog in this article shortly on how the established TCP if it happens you will have to administarte a Windows hosts or help a windows sysadmin noobie 🙂

In Linux it is pretty easy to check the number of established conenctions, because of the wonderful command wc (word count). with a simple command like:
 

$ netstat -etna |wc -l


Then you will get the number of active TCP connections to the machine and based on that you can get an idea on how busy the server is.

But what if you have to deal with lets say a Microsoft Windows 2012 /2019 / 2020 or 2022 Server, assuming you logged in as Administrator and you see the machine is quite loaded and runs multiple Native Windows Administrator common services such as IIS / Active directory Failover Clustering, Proxy server etc.
How can you identify the established number of connections via a simple command in cmd.exe?

1.Count ESTABLISHED TCP connections from Windows Command Line

Here is the answer, simply use netstat native windows command and combine it with find, like that and use the /i (ignores the case of characters when searching the string) /c (count lines containing the string) options

C:\Windows\system32>netstat -p TCP -n|  find /i "ESTABLISHED" /c
1268

Voila, here are number of established connections, only 1268 that is relatively low.
However if you manage Windows servers, and you get some kind of hang ups as part of the monitoring, it is a good idea to setup a script based on this simple command for at least Windows Task Scheduler (the equivallent of Linux's crond service) to log for Peaks in Established connections to see whether Server crashes are not related to High Rise in established connections.
Even better if company uses Zabbix / Nagios, OpenNMS or other  old legacy monitoring stuff like Joschyd even as of today 2024 used in some big of the TOP IT companies such as SAP (they were still using it about 4 years ago for their SAP HANA Cloud), you can set the script to run and do a Monitoring template or Alerting rules to draw you graphs and Trigger Alerts if your connections hits a peak, then you at least might know your Windows server is under a "Hackers" Denial of Service attack or there is something happening on the network, like Cisco Network Infrastructure Switch flappings or whatever.

Perhaps an example script you can use if you decide to implement the little nestat established connection checks Monitoring in Zabbix is the one i've writen about in the previous article "Calculate established connection from IP address with shell script and log to zabbix graphic".

2. Few Useful netstat options for the Windows system admin
 

C:\Windows\System32> netstat -bona


netstat-useful-arguments-for-the-windows-system-administrator

Cmd.exe will lists executable files, local and external IP addresses and ports, and the state in list form. You immediately see which programs have created connections or are listening so that you can find offenders quickly.

b – displays the executable involved in  creating the connection.
o – displays the owning process ID.
n – displays address and port numbers.
a – displays all connections and listening ports.

As you can see in the screenshot, by using netstat -bona you get which process has binded to which local address and the Process ID PID of it, that is pretty useful in debugging stuff.

3. Use a Third Party GUI tool to debug more interactively connection issues

If you need to keep an eye in interactive mode, sometimes if there are issues CurrPorts tool can be of a great help

currports-windows-network-connections-diagnosis-cports

CurrPorts Tool own Description

CurrPorts is network monitoring software that displays the list of all currently opened TCP/IP and UDP ports on your local computer. For each port in the list, information about the process that opened the port is also displayed, including the process name, full path of the process, version information of the process (product name, file description, and so on), the time that the process was created, and the user that created it.
In addition, CurrPorts allows you to close unwanted TCP connections, kill the process that opened the ports, and save the TCP/UDP ports information to HTML file , XML file, or to tab-delimited text file.
CurrPorts also automatically mark with pink color suspicious TCP/UDP ports owned by unidentified applications (Applications without version information and icons).

Sum it up

What we learned is how to calculate number of established TCP connections from command line, useful for scripting, how you can use netstat to display the process ID and Process name that relates to a used Local / Remote TCP connections, and how eventually you can use this to connect it to some monitoring tool to periodically report High Peaks with TCP established connections (usually an indicator of servere system issues).
 

Monitoring network traffic tools to debug network issues in console interactively on Linux

Thursday, December 14th, 2023

transport-layer-fourth-layer-data-transport-diagram


In my last article Debugging and routing network issues on Linux (common approaches), I've given some step by step methology on how to debug a network routing or unreachability issues between network hosts. As the article was mostly targetting a command line tools that can help debugging the network without much interactivity. I've decided to blog of a few other tools that might help the system administrator to debug network issues by using few a bit more interactive tools. Throughout the years of managing multitude of Linux based laptops and servers, as well as being involved in security testing and penetration in the past, these tools has always played an important role and are worthy to be well known and used by any self respecting sys admin or network security expert that has to deal with Linux and *Unix operating systems.
 

1. Debugging what is going on on a network level interactively with iptraf-ng

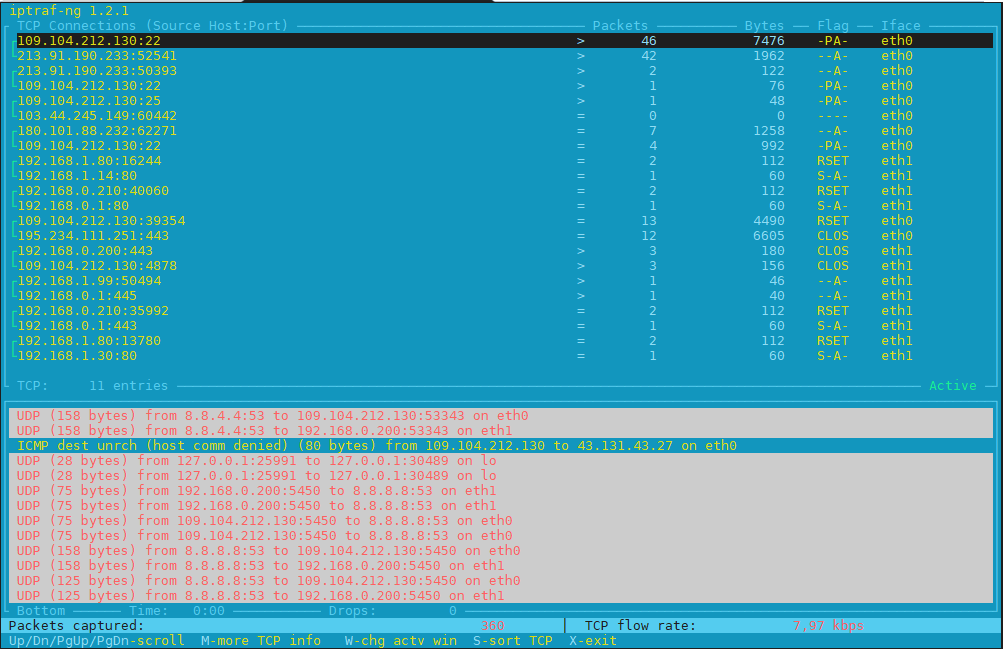
Historically iptraf and today's iptraf is also a great tool one can use to further aid the arsenal debug a network issue or Protocol problem, failure of packets or network interaction issues SYN -> ACK etc. proto interactions and check for Flag states and packets flow.

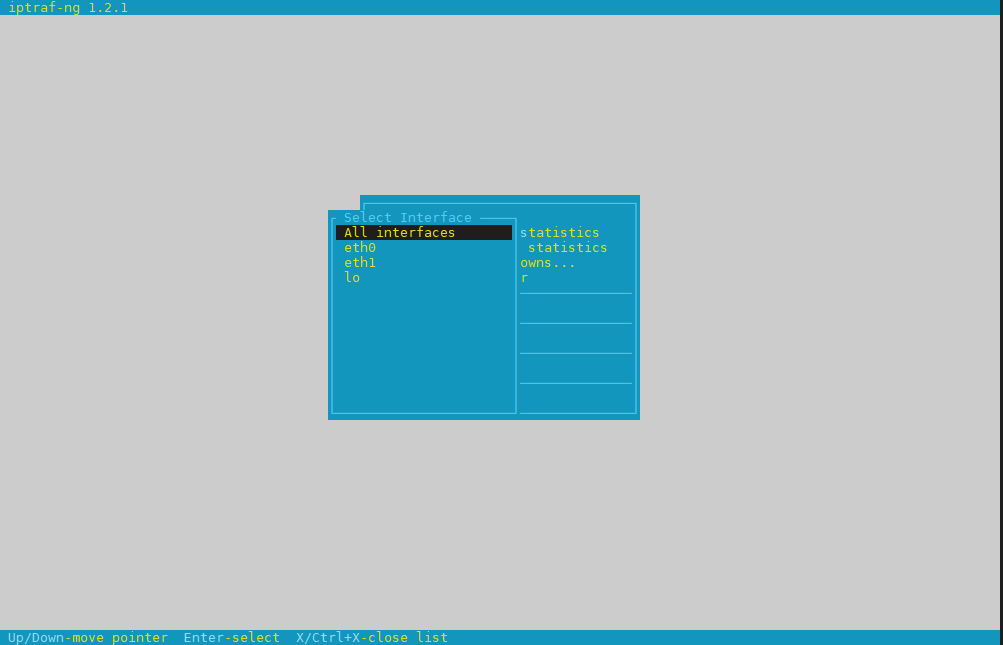
To use iptraf-ng which is a ncurses based tool just install it and launch it and select the interface you would like to debug trafic on.

To install On Debians distros

# apt install iptraf-ng –yes

# iptraf-ng


iptraf-ng-linux-select-interface-screen
 

iptraf-ng-listen-all-interfaces-check-tcp-flags-and-packets


Session-Layer-in-OSI-Model-diagram
 

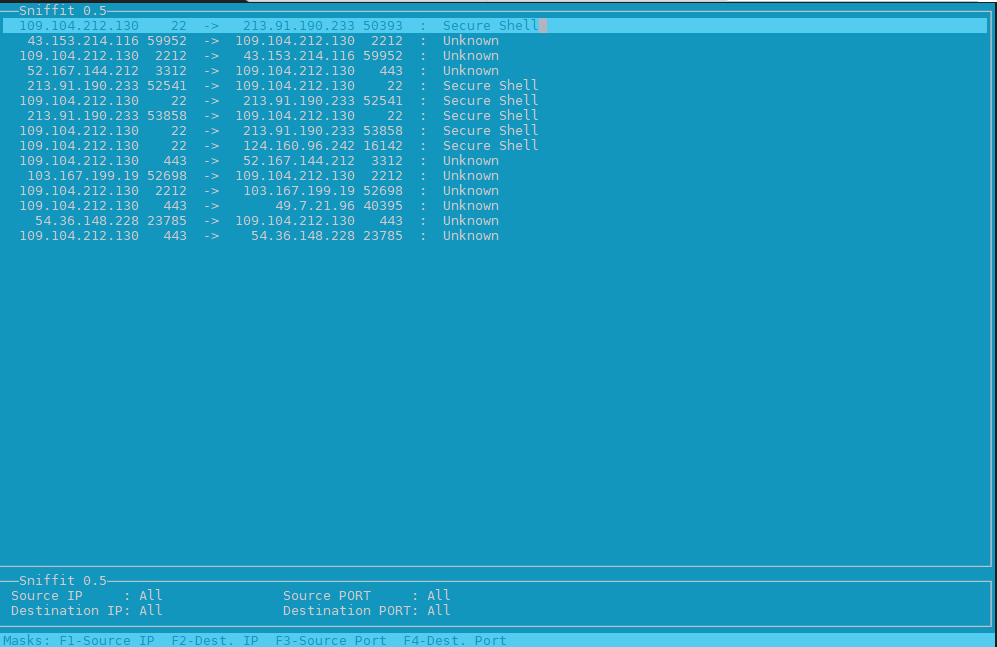
2. Use hackers old tool sniffit to monitor current ongoing traffic and read plain text messages

Those older who remember the rise of Linux to the masses, should remember sniffit was a great tool to snoop for traffic on the network.

root@pcfreak:~# apt-cache show sniffit|grep -i description -A 10 -B10
Package: sniffit
Version: 0.5-1
Installed-Size: 139
Maintainer: Joao Eriberto Mota Filho <eriberto@debian.org>
Architecture: amd64
Depends: libc6 (>= 2.14), libncurses6 (>= 6), libpcap0.8 (>= 0.9.8), libtinfo6 (>= 6)
Description-en: packet sniffer and monitoring tool
 Sniffit is a packet sniffer for TCP/UDP/ICMP packets over IPv4. It is able
 to give you a very detailed technical info on these packets, as SEQ, ACK,
 TTL, Window, etc. The packet contents also can be viewed, in different
 formats (hex or plain text, etc.).
 .
 Sniffit is based in libpcap and is useful when learning about computer
 networks and their security.
Description-md5: 973beeeaadf4c31bef683350f1346ee9
Homepage: https://github.com/resurrecting-open-source-projects/sniffit
Tag: interface::text-mode, mail::notification, role::program, scope::utility,
 uitoolkit::ncurses, use::monitor, use::scanning, works-with::mail,
 works-with::network-traffic
Section: net
Priority: optional
Filename: pool/main/s/sniffit/sniffit_0.5-1_amd64.deb
Size: 61796
MD5sum: ea4cc0bc73f9e94d5a3c1ceeaa485ee1
SHA256: 7ec76b62ab508ec55c2ef0ecea952b7d1c55120b37b28fb8bc7c86645a43c485


Sniffit is not installed by default on deb distros, so to give it a try install it

# apt install sniffit –yes
# sniffit


sniffit-linux-check-tcp-traffic-screenshot
 

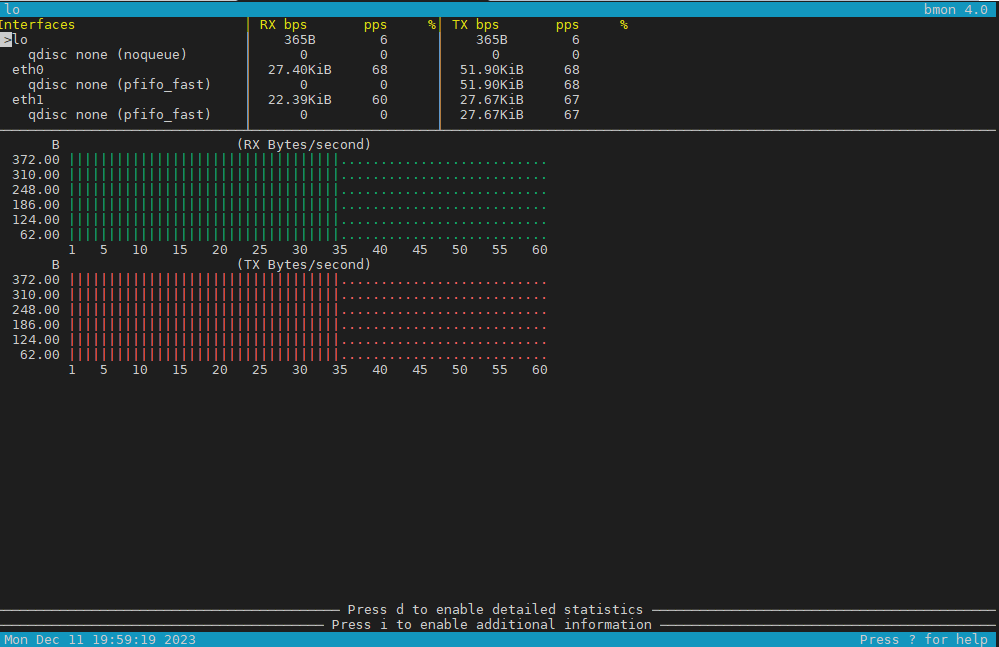
3. Use bmon to monitor bandwidth and any potential traffic losses and check qdisc pfifo
Linux network stack queues


root@pcfreak:~# apt-cache show bmon |grep -i description
Description-en: portable bandwidth monitor and rate estimator
Description-md5: 3288eb0a673978e478042369c7927d3f
root@pcfreak:~# apt-cache show bmon |grep -i description -A 10 -B10
Package: bmon
Version: 1:4.0-7
Installed-Size: 146
Maintainer: Patrick Matthäi <pmatthaei@debian.org>
Architecture: amd64
Depends: libc6 (>= 2.17), libconfuse2 (>= 3.2.1~), libncursesw6 (>= 6), libnl-3-200 (>= 3.2.7), libnl-route-3-200 (>= 3.2.7), libtinfo6 (>= 6)
Description-en: portable bandwidth monitor and rate estimator
 bmon is a commandline bandwidth monitor which supports various output
 methods including an interactive curses interface, lightweight HTML output but
 also simple ASCII output.
 .
 Statistics may be distributed over a network using multicast or unicast and
 collected at some point to generate a summary of statistics for a set of
 nodes.
Description-md5: 3288eb0a673978e478042369c7927d3f
Homepage: http://www.infradead.org/~tgr/bmon/
Tag: implemented-in::c, interface::text-mode, network::scanner,
 role::program, scope::utility, uitoolkit::ncurses, use::monitor,
 works-with::network-traffic
Section: net
Priority: optional
Filename: pool/main/b/bmon/bmon_4.0-7_amd64.deb
Size: 47348
MD5sum: c210f8317eafa22d9e3a8fb8316e0901
SHA256: 21730fc62241aee827f523dd33c458f4a5a7d4a8cf0a6e9266a3e00122d80645


root@pcfreak:~# apt install bmon –yes

root@pcfreak:~# bmon

bmon_monitor_qdisc-network-stack-bandwidth-on-linux

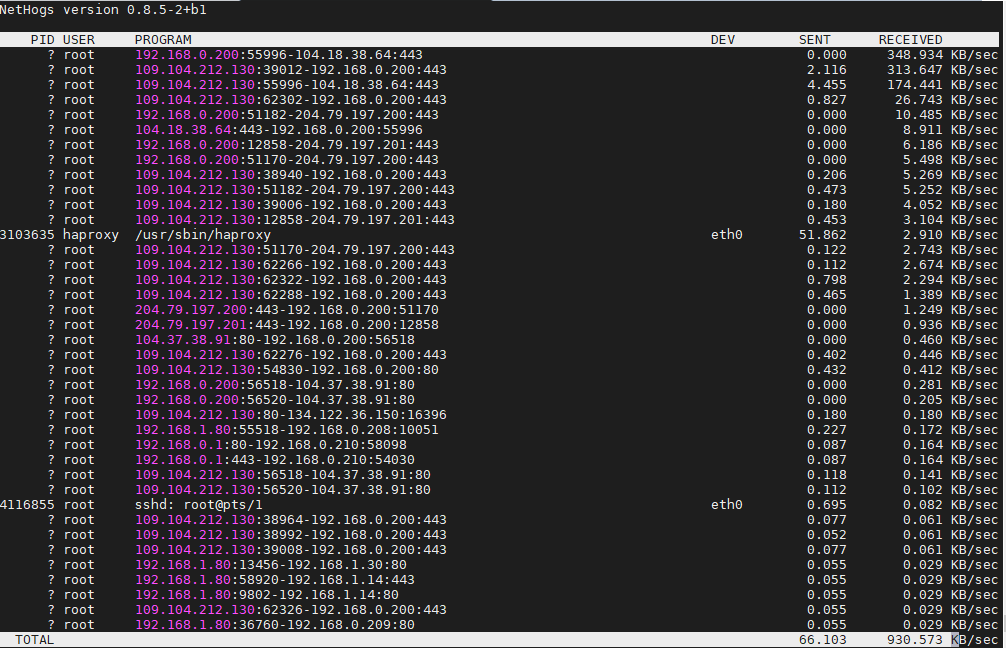
4. Use nethogs net diagnosis text interactive tool

NetHogs is a small 'net top' tool. 
Instead of breaking the traffic down per protocol or per subnet, like most tools do, it groups bandwidth by process.
 

root@pcfreak:~# apt-cache show nethogs|grep -i description -A10 -B10
Package: nethogs
Source: nethogs (0.8.5-2)
Version: 0.8.5-2+b1
Installed-Size: 79
Maintainer: Paulo Roberto Alves de Oliveira (aka kretcheu) <kretcheu@gmail.com>
Architecture: amd64
Depends: libc6 (>= 2.15), libgcc1 (>= 1:3.0), libncurses6 (>= 6), libpcap0.8 (>= 0.9.8), libstdc++6 (>= 5.2), libtinfo6 (>= 6)
Description-en: Net top tool grouping bandwidth per process
 NetHogs is a small 'net top' tool. Instead of breaking the traffic down per
 protocol or per subnet, like most tools do, it groups bandwidth by process.
 NetHogs does not rely on a special kernel module to be loaded.
Description-md5: 04c153c901ad7ca75e53e2ae32565ccd
Homepage: https://github.com/raboof/nethogs
Tag: admin::monitoring, implemented-in::c++, role::program,
 uitoolkit::ncurses, use::monitor, works-with::network-traffic
Section: net
Priority: optional
Filename: pool/main/n/nethogs/nethogs_0.8.5-2+b1_amd64.deb
Size: 30936
MD5sum: 500047d154a1fcde5f6eacaee45148e7
SHA256: 8bc69509f6a8c689bf53925ff35a5df78cf8ad76fff176add4f1530e66eba9dc

root@pcfreak:~# apt install nethogs –yes

# nethogs


nethogs-tool-screenshot-show-user-network--traffic-by-process-name-ID

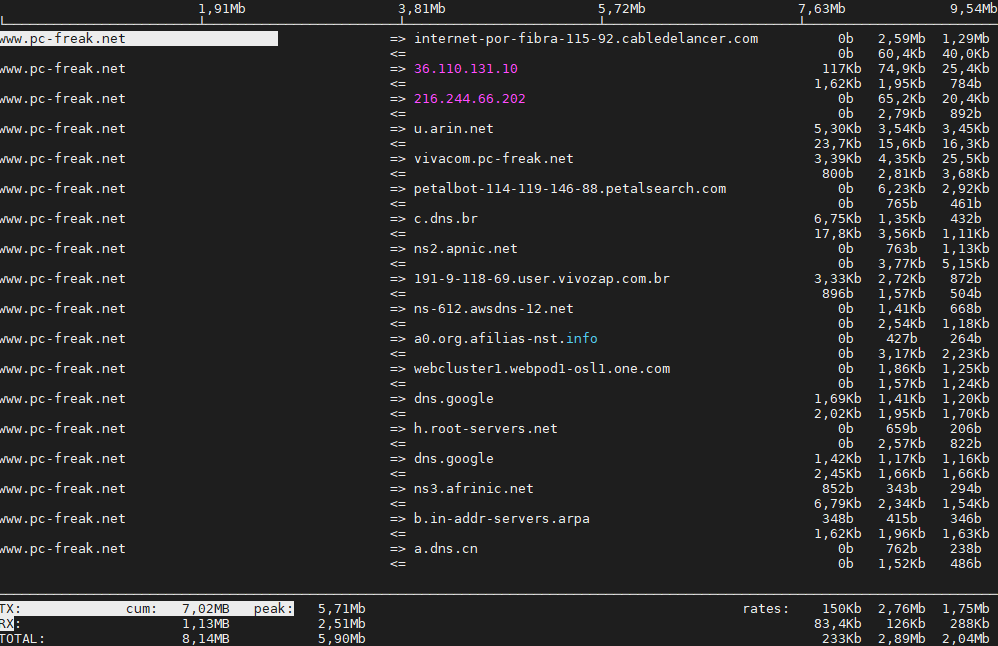
5;.Use iftop –  to display network interface usage


root@pcfreak:~# apt-cache show iftop |grep -i description -A10 -B10
Package: iftop
Version: 1.0~pre4-7
Installed-Size: 97
Maintainer: Markus Koschany <apo@debian.org>
Architecture: amd64
Depends: libc6 (>= 2.29), libncurses6 (>= 6), libpcap0.8 (>= 0.9.8), libtinfo6 (>= 6)
Description-en: displays bandwidth usage information on an network interface
 iftop does for network usage what top(1) does for CPU usage. It listens to
 network traffic on a named interface and displays a table of current bandwidth
 usage by pairs of hosts. Handy for answering the question "Why is my Internet
 link so slow?".
Description-md5: f7e93593aba6acc7b5a331b49f97466f
Homepage: http://www.ex-parrot.com/~pdw/iftop/
Tag: admin::monitoring, implemented-in::c, interface::text-mode,
 role::program, scope::utility, uitoolkit::ncurses, use::monitor,
 works-with::network-traffic
Section: net
Priority: optional
Filename: pool/main/i/iftop/iftop_1.0~pre4-7_amd64.deb
Size: 42044
MD5sum: c9bb9c591b70753880e455f8dc416e0a
SHA256: 0366a4e54f3c65b2bbed6739ae70216b0017e2b7421b416d7c1888e1f1cb98b7


root@pcfreak:~# apt install –yes iftop

iftop-interactive-network-traffic-output-linux-screenshot


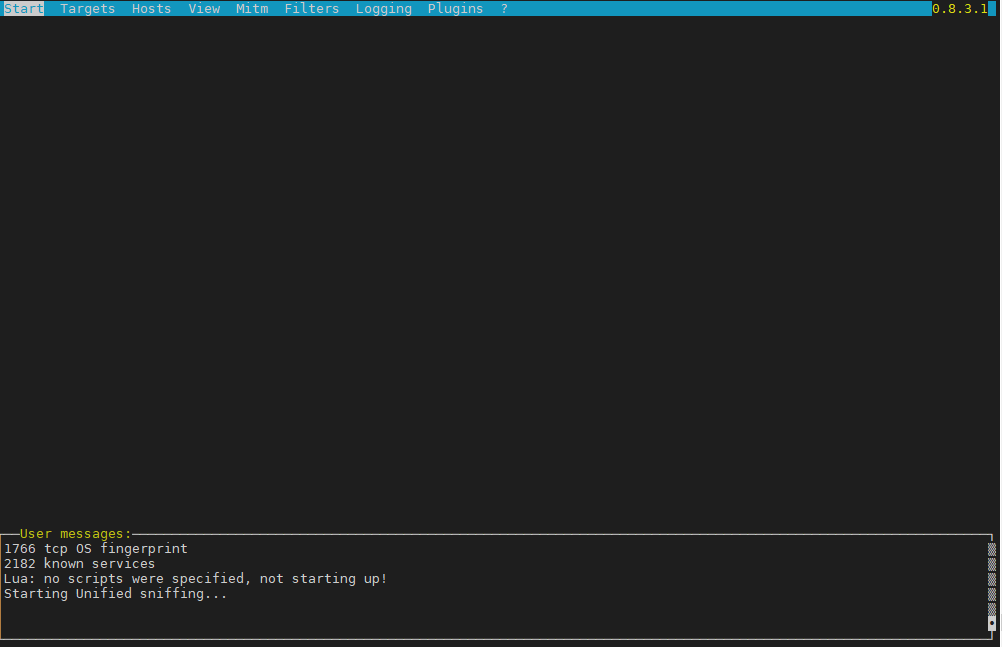
6. Ettercap (tool) to active and passive dissect network protocols for in depth network and host analysis

root@pcfreak:/var/www/images# apt-cache show ettercap-common|grep -i description -A10 -B10
Package: ettercap-common
Source: ettercap
Version: 1:0.8.3.1-3
Installed-Size: 2518
Maintainer: Debian Security Tools <team+pkg-security@tracker.debian.org>
Architecture: amd64
Depends: ethtool, geoip-database, libbsd0 (>= 0.0), libc6 (>= 2.14), libcurl4 (>= 7.16.2), libgeoip1 (>= 1.6.12), libluajit-5.1-2 (>= 2.0.4+dfsg), libnet1 (>= 1.1.6), libpcap0.8 (>= 0.9.8), libpcre3, libssl1.1 (>= 1.1.1), zlib1g (>= 1:1.1.4)
Recommends: ettercap-graphical | ettercap-text-only
Description-en: Multipurpose sniffer/interceptor/logger for switched LAN
 Ettercap supports active and passive dissection of many protocols
 (even encrypted ones) and includes many feature for network and host
 analysis.
 .
 Data injection in an established connection and filtering (substitute
 or drop a packet) on the fly is also possible, keeping the connection
 synchronized.
 .
 Many sniffing modes are implemented, for a powerful and complete
 sniffing suite. It is possible to sniff in four modes: IP Based, MAC Based,
 ARP Based (full-duplex) and PublicARP Based (half-duplex).
 .
 Ettercap also has the ability to detect a switched LAN, and to use OS
 fingerprints (active or passive) to find the geometry of the LAN.
 .
 This package contains the Common support files, configuration files,
 plugins, and documentation.  You must also install either
 ettercap-graphical or ettercap-text-only for the actual GUI-enabled
 or text-only ettercap executable, respectively.
Description-md5: f1d894b138f387661d0f40a8940fb185
Homepage: https://ettercap.github.io/ettercap/
Tag: interface::text-mode, network::scanner, role::app-data, role::program,
 uitoolkit::ncurses, use::scanning
Section: net
Priority: optional
Filename: pool/main/e/ettercap/ettercap-common_0.8.3.1-3_amd64.deb
Size: 734972
MD5sum: 403d87841f8cdd278abf20bce83cb95e
SHA256: 500aee2f07e0fae82489321097aee8a97f9f1970f6e4f8978140550db87e4ba9


root@pcfreak:/ # apt install ettercap-text-only –yes

root@pcfreak:/ # ettercap -C


ettercap-text-interface-unified-sniffing-screenshot-linux

7. iperf and netperf to measure connecitivity speed on Network LAN and between Linux server hosts

iperf and netperf are two very handy tools to measure the speed of a network and various aspects of the bandwidth. It is mostly useful when designing network infrastructure or building networks from scratch.
 

If you never used netperf in the past here is a description from man netperf

NAME
       netperf – a network performance benchmark

SYNOPSIS
       netperf [global options] — [test specific options]

DESCRIPTION
       Netperf  is  a benchmark that can be used to measure various aspects of
       networking performance.  Currently, its focus is on bulk data  transfer
       and  request/response  performance  using  either  TCP  or UDP, and the
       Berkeley Sockets interface. In addition, tests for DLPI, and  Unix  Do‐
       main Sockets, tests for IPv6 may be conditionally compiled-in.


root@freak:~# netperf
MIGRATED TCP STREAM TEST from 0.0.0.0 (0.0.0.0) port 0 AF_INET to localhost () port 0 AF_INET : demo
Recv   Send    Send
Socket Socket  Message  Elapsed
Size   Size    Size     Time     Throughput
bytes  bytes   bytes    secs.    10^6bits/sec

 87380  65536  65536    10.00    17669.96


Testing UDP network throughput using NetPerf

Change the test name from TCP_STREAM to UDP_STREAM. Let’s use 1024 (1MB) as the message size to be sent by the client.
If you receive the following error send_data: data send error: Network is unreachable (errno 101) netperf: send_omni:

send_data failed: Network is unreachable, add option -R 1 to remove the iptable rule that prohibits NetPerf UDP flow.

$ netperf -H 172.31.56.48 -t UDP_STREAM -l 300 — -R 1 -m 1024
MIGRATED UDP STREAM TEST from 0.0.0.0 (0.0.0.0) port 0 AF_INET to 172.31.56.48 () port 0 AF_INET
Socket Message Elapsed Messages
Size Size Time Okay Errors Throughput
bytes bytes secs # # 10^6bits/sec

212992 1024 300.00 9193386 0 251.04
212992 300.00 9131380 249.35

UDP Throughput in a WAN

$ netperf -H HOST -t UDP_STREAM -l 300 — -R 1 -m 1024
MIGRATED UDP STREAM TEST from (null) (0.0.0.0) port 0 AF_INET to (null) () port 0 AF_INET : histogram : spin interval
Socket Message Elapsed Messages
Size Size Time Okay Errors Throughput
bytes bytes secs # # 10^6bits/sec

9216 1024 300.01 35627791 0 972.83
212992 300.01 253099 6.91


Testing TCP throughput using iPerf


Here is a short description of iperf

NAME
       iperf – perform network throughput tests

SYNOPSIS
       iperf -s [options]

       iperf -c server [options]

       iperf -u -s [options]

       iperf -u -c server [options]

DESCRIPTION
       iperf  2  is  a tool for performing network throughput and latency mea‐
       surements. It can test using either TCP or UDP protocols.  It  supports
       both  unidirectional  and  bidirectional traffic. Multiple simultaneous
       traffic streams are also supported. Metrics are displayed to help  iso‐
       late the causes which impact performance. Setting the enhanced (-e) op‐
       tion provides all available metrics.

       The user must establish both a both a server (to discard traffic) and a
       client (to generate traffic) for a test to occur. The client and server
       typically are on different hosts or computers but need not be.


Run iPerf3 as server on the server:

$ iperf3 –server –interval 30
———————————————————–
Server listening on 5201
———————————————————–


Test TCP Throughput in Local LAN


$ iperf3 –client 172.31.56.48 –time 300 –interval 30
Connecting to host 172.31.56.48, port 5201
[ 4] local 172.31.100.5 port 44728 connected to 172.31.56.48 port 5201
[ ID] Interval Transfer Bandwidth Retr Cwnd
[ 4] 0.00-30.00 sec 1.70 GBytes 488 Mbits/sec 138 533 KBytes
[ 4] 30.00-60.00 sec 260 MBytes 72.6 Mbits/sec 19 489 KBytes
[ 4] 60.00-90.00 sec 227 MBytes 63.5 Mbits/sec 15 542 KBytes
[ 4] 90.00-120.00 sec 227 MBytes 63.3 Mbits/sec 13 559 KBytes
[ 4] 120.00-150.00 sec 228 MBytes 63.7 Mbits/sec 16 463 KBytes
[ 4] 150.00-180.00 sec 227 MBytes 63.4 Mbits/sec 13 524 KBytes
[ 4] 180.00-210.00 sec 227 MBytes 63.5 Mbits/sec 14 559 KBytes
[ 4] 210.00-240.00 sec 227 MBytes 63.5 Mbits/sec 14 437 KBytes
[ 4] 240.00-270.00 sec 228 MBytes 63.7 Mbits/sec 14 516 KBytes
[ 4] 270.00-300.00 sec 227 MBytes 63.5 Mbits/sec 14 524 KBytes
– – – – – – – – – – – – – – – – – – – – – – – – –
[ ID] Interval Transfer Bandwidth Retr
[ 4] 0.00-300.00 sec 3.73 GBytes 107 Mbits/sec 270 sender
[ 4] 0.00-300.00 sec 3.73 GBytes 107 Mbits/sec receiver

Test TCP Throughput in a WAN Network

$ iperf3 –client HOST –time 300 –interval 30
Connecting to host HOST, port 5201
[ 5] local 192.168.1.73 port 56756 connected to HOST port 5201
[ ID] Interval Transfer Bitrate
[ 5] 0.00-30.00 sec 21.2 MBytes 5.93 Mbits/sec
[ 5] 30.00-60.00 sec 27.0 MBytes 7.55 Mbits/sec
[ 5] 60.00-90.00 sec 28.6 MBytes 7.99 Mbits/sec
[ 5] 90.00-120.00 sec 28.7 MBytes 8.02 Mbits/sec
[ 5] 120.00-150.00 sec 28.5 MBytes 7.97 Mbits/sec
[ 5] 150.00-180.00 sec 28.6 MBytes 7.99 Mbits/sec
[ 5] 180.00-210.00 sec 28.4 MBytes 7.94 Mbits/sec
[ 5] 210.00-240.00 sec 28.5 MBytes 7.97 Mbits/sec
[ 5] 240.00-270.00 sec 28.6 MBytes 8.00 Mbits/sec
[ 5] 270.00-300.00 sec 27.9 MBytes 7.81 Mbits/sec
– – – – – – – – – – – – – – – – – – – – – – – – –
[ ID] Interval Transfer Bitrate
[ 5] 0.00-300.00 sec 276 MBytes 7.72 Mbits/sec sender
[ 5] 0.00-300.00 sec 276 MBytes 7.71 Mbits/sec receiver


$ iperf3 –client 172.31.56.48 –interval 30 -u -b 100MB
Accepted connection from 172.31.100.5, port 39444
[ 5] local 172.31.56.48 port 5201 connected to 172.31.100.5 port 36436
[ ID] Interval Transfer Bandwidth Jitter Lost/Total Datagrams
[ 5] 0.00-30.00 sec 354 MBytes 98.9 Mbits/sec 0.052 ms 330/41774 (0.79%)
[ 5] 30.00-60.00 sec 355 MBytes 99.2 Mbits/sec 0.047 ms 355/41903 (0.85%)
[ 5] 60.00-90.00 sec 354 MBytes 98.9 Mbits/sec 0.048 ms 446/41905 (1.1%)
[ 5] 90.00-120.00 sec 355 MBytes 99.4 Mbits/sec 0.045 ms 261/41902 (0.62%)
[ 5] 120.00-150.00 sec 354 MBytes 99.1 Mbits/sec 0.048 ms 401/41908 (0.96%)
[ 5] 150.00-180.00 sec 353 MBytes 98.7 Mbits/sec 0.047 ms 530/41902 (1.3%)
[ 5] 180.00-210.00 sec 353 MBytes 98.8 Mbits/sec 0.059 ms 496/41904 (1.2%)
[ 5] 210.00-240.00 sec 354 MBytes 99.0 Mbits/sec 0.052 ms 407/41904 (0.97%)
[ 5] 240.00-270.00 sec 351 MBytes 98.3 Mbits/sec 0.059 ms 725/41903 (1.7%)
[ 5] 270.00-300.00 sec 354 MBytes 99.1 Mbits/sec 0.043 ms 393/41908 (0.94%)
– – – – – – – – – – – – – – – – – – – – – – – – –
[ ID] Interval Transfer Bandwidth Jitter Lost/Total Datagrams
[ 5] 0.00-300.04 sec 3.45 GBytes 98.94 Mbits/sec 0.043 ms 4344/418913 (1%)

UDP Throughput in a WAN

$ iperf3 –client HOST –time 300 -u -b 7.7MB
Accepted connection from 45.29.190.145, port 60634
[ 5] local 172.31.56.48 port 5201 connected to 45.29.190.145 port 52586
[ ID] Interval Transfer Bandwidth Jitter Lost/Total Datagrams
[ 5] 0.00-30.00 sec 27.4 MBytes 7.67 Mbits/sec 0.438 ms 64/19902 (0.32%)
[ 5] 30.00-60.00 sec 27.5 MBytes 7.69 Mbits/sec 0.446 ms 35/19940 (0.18%)
[ 5] 60.00-90.00 sec 27.5 MBytes 7.68 Mbits/sec 0.384 ms 39/19925 (0.2%)
[ 5] 90.00-120.00 sec 27.5 MBytes 7.68 Mbits/sec 0.528 ms 70/19950 (0.35%)
[ 5] 120.00-150.00 sec 27.4 MBytes 7.67 Mbits/sec 0.460 ms 51/19924 (0.26%)
[ 5] 150.00-180.00 sec 27.5 MBytes 7.69 Mbits/sec 0.485 ms 37/19948 (0.19%)
[ 5] 180.00-210.00 sec 27.5 MBytes 7.68 Mbits/sec 0.572 ms 49/19941 (0.25%)
[ 5] 210.00-240.00 sec 26.8 MBytes 7.50 Mbits/sec 0.800 ms 443/19856 (2.2%)
[ 5] 240.00-270.00 sec 27.4 MBytes 7.66 Mbits/sec 0.570 ms 172/20009 (0.86%)
[ 5] 270.00-300.00 sec 25.3 MBytes 7.07 Mbits/sec 0.423 ms 1562/19867 (7.9%)
– – – – – – – – – – – – – – – – – – – – – – – – –
[ ID] Interval Transfer Bandwidth Jitter Lost/Total Datagrams
[ 5] 0.00-300.00 sec 272 MBytes 7.60 Mbits/sec 0.423 ms 2522/199284 (1.3%)
[SUM] 0.0-300.2 sec 31 datagrams received out-of-order


Sum it up what learned


Debugging network issues and snooping on a Local LAN (DMZ) network on a server or home LAN is useful  to debug for various network issues and more importantly track and know abou tsecurity threads such as plain text passowd communication via insecure protocols a failure of proper communication between Linux network nodes at times, or simply to get a better idea on what kind of network is your new purchased dedicated server living in .It can help you also strenghten your security and close up any possible security holes, or even help you start thinking like a security intruder (cracker / hacker) would do. In this article we went through few of my favourite tools I use for many years quite often. These tools are just part of the tons of useful *Unix free tools available to do a network debug. Tools mentioned up are worthy to install on every server you have to administratrate or even your home desktop PCs, these are iptraf, sniffit, iftop, bmon, nethogs, nmon, ettercap, iperf and netperf.
 If you have some other useful tools used on Linux sys admin tasks please share, I'll be glad to know it and put them in my arsenal of used tools.

Enjoy ! 🙂

Analyze disk space usage in Linux / BSD with du / find and filelight /qdirstat / baobab GUI disk usage analyzers to check what takes up your disk space on Unix like OSes

Friday, April 21st, 2023

linux-how-to-find-out-what-files-and-directories-has-occupied-all-your-disk-space-partition-from-console-and-GUI_du-find-filelight-baobab-qdirstat-duff-linux-450x450

If you're a Desktop Linux or BSD UNIX user and your hard disk / external SSD / flash drive etc. space starts to be misteriously disapper due to whatever reaseon such as a crashing applications producing rapidly log error / warning messages leading quickly to filling up the disk or out of a sudden you have some Disk space lost without knowing what kind of data filled up the disk or you're downloading some big sized bittorrent files forgotten in your bittorrent client or complete mirroring a large website and you suddenly get the result of root directory ( / ) getting fully or nearly filled up, then you definitely would want to check out what has disk activity has eaten up your disk space and leaing to OS and Aplication slow responsiveness.

For the Linux regular *nix user finding out what is filling the disk is a trivial task with with find / du -hsc * but as people have different habits to use find and du I'll show you the most common ways I use this two command line tools to identify disk space low issues for the sake of comparison.
Others who have better easier ways to do it are very welcome to share it with me in the comments.
 

1. Finding large files on hard disk with find Linux command tool
 

host:~# find /home -type f -printf "%s\t%p\n" | sort -n | tail -10
2100000000    /home/hipo/Downloads/MameUIfx incl. ROMs/MameUIfx incl. ROMs-6.bin
2100000000    /home/hipo/Downloads/MameUIfx incl. ROMs/MameUIfx incl. ROMs-7.bin
2100000000    /home/hipo/Downloads/MameUIfx incl. ROMs/MameUIfx incl. ROMs-8.bin
2100000000    /home/hipo/Downloads/MameUIfx incl. ROMs/MameUIfx incl. ROMs-9.bin
2815424080    /home/hipo/.thunderbird/h3dasfii.default\
/ImapMail/imap.gmail.com/INBOX
2925584895    /home/hipo/Documents/.git/\
objects/pack/pack-8590b069cad26ac0af7560fb42b51fa9bfe41050.pack
4336918067    /home/hipo/Games/Mames_4GB-compilation-best-arcade-games-of-your-14_04_2021.tar.gz
6109003776    /home/hipo/VirtualBox VMs/CentOS/CentOS.vdi
23599251456    /home/hipo/VirtualBox VMs/Windows 7/Windows 7.vdi
33913044992    /home/hipo/VirtualBox VMs/Windows 10/Windows 10.vdi

I use less rarely find on Desktops and more when I have to do some kind of data usage analysis on servers, of course for my Linux home computer and any other Linux desktop machines, or just a small incomprehensive analysis du cmd is much more appropriate to use.


2. Finding large files Megabyte occupying space files sorted in Megabytes and Gigas with du
 

  • Check main 10 files sorted in megabytes that are hanging in a directory

pcfkreak:~# du -hsc /home/hipo/*|grep 'M\s'|sort -rn|head -n 10
956M    /home/hipo/last_dump1.sql
711M    /home/hipo/hipod
571M    /home/hipo/from-thinkpad_r61
453M    /home/hipo/ultimate-edition-themes
432M    /home/hipo/metasploit-framework
355M    /home/hipo/output-upgrade.txt
333M    /home/hipo/Плот
209M    /home/hipo/Work-New.tar.gz
98M    /home/hipo/DOOM64
90M    /home/hipo/mp3

  • Get 10 top larges files in Gigabytes that are space hungry and eating up your space

pcfkreak:~# du -hsc /home/hipo/*|grep 'G\s'|sort -rn|head -n 10
156G    total
60G    /home/hipo/VirtualBox VMs
37G    /home/hipo/Downloads
18G    /home/hipo/Desktop
11G    /home/hipo/Games
7.4G    /home/hipo/ownCloud
7.1G    /home/hipo/Документи
4.6G    /home/hipo/music
2.9G    /home/hipo/root
2.8G    /home/hipo/Documents


If you want to still work on the console terminal but you don't want to type too much you can use ncdu (ncurses) text tool, install it with

# apt install –yes ncdu


https://www.pc-freak.net/images/ncdu-gnu-linux-debian-screenshot.png

 For the most lazy ones or complete Linux newbies that doesn't want to spend time typing / learing or using text commands or softwares you can also check what has eaten up your full disk space with GUI tools as well.

There are at least 3 tools to use to check in Graphical Interface what has occupied your disk space on Linux / BSD, I'm aware of:

3. Filelight GUI disk usage analysis Linux tool

For those using KDE or preferring a shiny GUI interface that will capture the eye, perhaps filelight would be the option of choice tool to get analysis sum of your directory sturctures and file use on the laptop or desktop *unix OS.

unix-desktop:~# apt-cache show filelight|grep -i description-en -A 7
Description-en: show where your diskspace is being used
 Filelight allows you to understand your disk usage by graphically
 representing your filesystem as a set of concentric, segmented rings.
 .
 It is like a pie-chart, but the segments nest, allowing you to see both
 which directories take up all your space, and which directories
 and files inside those directories are the real culprits.
Description-md5: 397ff9a469e07a772f22460c66b66875


To use it simply go ahead and install it with apt or yum / dnf or whatever Linux package manager your distro uses:

unix-desktop:~# apt-get install –yes filelight

filelight-show-where-disk-space-is-being-used-graphically-tool-linux

4. GNOME DIsk Usage Analyzer Baobab GUI tool

For those being a GNOME / Mate / Budgie / Cinnamon Graphical interface users baobab shold be the program to use as it uses the famous LibGD library.

unix-desktop:~# apt-cache show baobab|grep -i description-en -A10
Description-en: GNOME disk usage analyzer
 Disk Usage Analyzer is a graphical, menu-driven application to analyse
 disk usage in a GNOME environment. It can easily scan either the whole
 filesystem tree, or a specific user-requested directory branch (local or
 remote).
 .
 It also auto-detects in real-time any changes made to your home
 directory as far as any mounted/unmounted device. Disk Usage Analyzer
 also provides a full graphical treemap window for each selected folder.
Description-md5: 5f6072b89ebb1dc83433fa7658814dc6
Homepage: https://wiki.gnome.org/Apps/Baobab


gnome-disk-analyzer-baobab-tool-screenshot-of-hard-disk-directory-locations-sorted-by-size

5. Qdirstat graphical application to show where your disk space has gone on Linux

Qdirstat is perhaps well known tool to track disk space issues on Linux desktop hosts, known by the hardcore KDE / LXDE / LXQT / DDE GUI interface / environment lovers and as a KDE tool uses the infamous Qt library. I personally don't like it and don't put it on machines I use because I never use kde and don't want to waste my disk space with additional libraries such as the QT Library which historically was not totally free in terms of licensing and even now is in both free and non free licensing GPL / LGPL and QT Commercial Licensing license.

unix-desktop:~# apt-cache show qdirstat|grep -i description-en -A10
Description-en: Qt-based directory statistics
 QDirStat is a graphical application to show where your disk space has gone and
 to help you to clean it up.
 .
 QDirStat has a number of new features compared to KDirStat. To name a few:
  * Multi-selection in both the tree and the treemap.
  * Unlimited number of user-defined cleanup actions.
  * Properly show errors of cleanup actions (and their output, if desired).
  * File categories (MIME types) and their treemap color are now configurable.
  * Exclude rules for directories are easily configurable.
  * Desktop-agnostic; no longer relies on KDE or any other specific desktop.


qdirstat-linux-screenshot-show-what-directory-uses-most-hard-disk-space

That shiny fuzed graphics is actually a repsesantation of all directories the bigger and if one scrolls on the colorful gamma a text with directory and size or file will appear. Though the graphical represantation is really c00l to me it is a bit unreadable, thus I prefer and recommend the other two GUI tools filelight or baobab instead.

6. Finding duplicate files on Linux system with duff command tool

Talking about big unknown left-over files on your hard drives, it is appropriate to mention one tool here that is a console one but very useful to anyone willing to get rid of old duplicate files that are hanging around on the disk. Sometimes such copies are produced while copying large amount of files from place to place or simply by mistake while copying Photo / Video files from your Smart Phone to Linux desktop etc. 

This is where the duff command line utility might be super beneficial for you.

unix-desktop:~# apt-cache show duff|grep -i description-en -A3
Description-en: Duplicate file finder
 Duff is a command-line utility for identifying duplicates in a given set of
 files.  It attempts to be usably fast and uses the SHA family of message
 digests as a part of the comparisons.

Using duff tool is very straight forward to see all the duplicate files hanging in a directory lets say your home folder.

unix-desktop:~#  duff -rP /home/hipo

/home/hipo/music/var/Quake II Soundtrack – Kill Ratio.mp3
/home/hipo/mp3/Quake II Soundtrack – Kill Ratio.mp3
2 files in cluster 44 (7913472 bytes, digest 98f38be49e2ffcbf90927f9357b3e24a81d5a649)
/home/hipo/music/var/HYPODIL_01-Scakauec.mp3
/home/hipo/mp3/HYPODIL_01-Scakauec.mp3
2 files in cluster 45 (2807808 bytes, digest ce9067ce1f132fc096a5044845c7fac73e99c0ed)
/home/hipo/music/var/Quake II Suondtrack – March Of The Stoggs.mp3
/home/hipo/mp3/Quake II Suondtrack – March Of The Stoggs.mp3
2 files in cluster 46 (3506176 bytes, digest efcc401b4ebda9b0b2367aceb8e334c8ba1a357d)
/home/hipo/music/var/Quake II Suondtrack – Quad Machine.mp3
/home/hipo/mp3/Quake II Suondtrack – Quad Machine.mp3
2 files in cluster 47 (7917568 bytes, digest 0905c1d790654016c2ecf2949f78d47a870c3822)
/home/hipo/music/var/Cyberpunk Group – Futureshock!.mp3
/home/hipo/mp3/Cyberpunk Group – Futureshock!.mp3

-r (Recursively search into all specified directories.)

P (Don't follow any symbolic links.  This overrides any previous -H or -L option.  This is the default.  Note that this only applies to directories, as sym‐
             bolic links to files are never followed.)

7. Deleting duplicate files with duff

If you're absolutely sure you know what you're doing and you have a backup in case if something messes up during duplicate teletions, to get rid of lets say any duplicate Picture files found by duff run sommething like:

# duff -e0 -r /home/hipo/Pictures/ | xargs -0 rm

!!! Please note that using duff is for those who absolutely know what they're doing and have their data recent data. Deleting the wrong data by mistake with the tool might put you in the first grade and you'll be the only one to blame  🙂 !!!

Wrap it Up

Filling up the disk with unknown large files is a task to resolve that happens often. For the unlazy on Linux / BSD / Mac OS and other UNIX like OS-es the easiest way is to use find or du with some one liner command. For the lazy Windows addicted Graphical users filelightqdirstat or baobab GUI disk usage analysis tools are there.
If you have a lot of files and many of thems are duplicates you can use duff to check them out and remove all unneded duplicates and save space. 
Hope this article, was helpful for someone.
That's all folks, enjoy your data profilactics, if you know any other good easy command or GUI tools or hints for drive disk space profilactics please share.

Switching from PasswordSafe to Keepass database, migrating .psafe3 to .kdbx format howto

Thursday, February 23rd, 2023

passwordsafe-to-keepass-migration-logo

I have been using PasswordSafe for many years within my job location as system administrator on the Windows computers I do use as dumb hosts to administrate remotely via ssh servers, develop code in bash / perl or just store different SysAdmin management tools and interfaces passwords. The reason behind was simply that I come out from a Linux background as I've used for daily Sysadmin job for many years GNU / Linux and there I always prefer GNOME (gnome GTK interface) in favour of KDE's (QT Library), and whence I came to work for the "Evil" Windows oriented world of corporations  for the sake of Outlook use and Office 365 as well as Citrix accessibility i've become forced by the circumstances to use Windows. 
Hence for a PasswordManager for Windows back in the years, I preferred the simplicity of interface of PasswordSafe instead of Keepass which always reminded me of the nasty KDE.
PasswordSafe is really cool and a handy program and it works well, but recetnly when I had to store many many passwords and easily navigate through each of it I realized, by observing colleagues, that KeePass as of time of writting this article is much more Powerful and easy to use, as I can see all records of a searched passwords on a Single screen, instead of scrolling like crazy with PasswordSafe through the passowrds.

I didn’t really feel like cutting and pasting every field for all my passwords (plus I started experiencing some PasswordSafe copy / paste passwords issues – maybe not related to PasswordSafe itself so this was the turning point I decided to migrate to Keepass.

For that, started looking at the import export functions for each program. 

After a quick search, I found few articles online explaining on how the migration of PasswordSafe to KeePass can be easily handled as the versions of Keepass and Password safe are moving all the time, of course usually some of the guides to be found online are never competely upto date, so I had to slightly modify one of the articles and come up with this one 🙂 .
 

  •  My PasswordSafe program that keeps my account password records and notes is version is
    V 3.59 built on May 28 2022 and is running on my Windows 10 OS 64 bit release
  • The installed KeePass version to where I have migrated the Pwsafe password database Successfully is 2.48 64 Bit
     
  1. Use the Password Safe function to export to XML file Format
    (File -> Export To -> XML Format )


    pwsafe.screenshot-export-password-psafe3
     

  2. Import the text file into KeePass
    (File->Import From-> Password Safe XML file)


    import-file-data-keepass-screenshot

This process worked quite fine. All of the passwords were imported .
Despite the importing (expected small glitches – please recheck that all was imported fine, before joy), the process is quicker than copy/pasting every field for each entry.

For those of you who are more worried about security than I am, you know this is a very insecure method to transfer passwords. For others, you may wish to export the (unencrypted) text file to a Veracrypt – that is a Truecypt fork (as nowadays obsolete unmaintaned and probably insecury) – a Free Open-Source On-The-Fly Disk Encryption Software to prepare  Veracrypt  partition and / or use Eraser on the text file once you’re finished with it or use another of the free Veracrypt open-source (free software) alternatives such DiskCryptor or even the proprietary Windows BitLocker / CipherShed / Axcrypt or some other encryption alternative software for Windows XP / 2000 / 7 10 that is out there.

NB! Please  don’t do this on a public computer or a PC that you don't administrate.
You never know who might find your passwords or might be sniffing on your OS, as today there are so many devices that perhaps are hacked and listening and collecting password datas  🙂

That's it now I enjoy my KeePass but I'm thankful to PasswordSafe developers, who have easified my password management Virtual life for years 🙂
Any hints on how you migrated PasswordSafe to Keepass are mostly welcome. Also will be nice to hear of hard-core PasswordSafe hints or plugins that can power-up the password storage, maybe I can get convinced back to return back to PasswordSafe 🙂
 

iSH, the best free SSH / Telnet client for iOS iPhone, iPad equivallent of MobaXterm and fully functional Alpine Linux emulator

Wednesday, February 8th, 2023

ish-linux-terminal-emulator-for-iphone-ipad-ios-logo-screenshoticon

Since few months I've switched my old BLU r1 HD Phone (a great old low budget phone for its price) to a friend's iPhone 10 ( X ) who gifted it for me. Coming from Android world, everyone who has experience with it is a pain in the ass as some of the Apps, which are into Google's play store does not have the same equivalent into Apple's install Package manager tool AppStore. Some of the crucial tools which I was interested as a freshly new migrated user from Android to iPhone was to have a decent SSH / Telnet client and Terminal, with which I can easily connect to my Linux servers both home and work. 

As Android Phone user, to connect and manage my SSH sessions I used most often some of the most popular Connectbot / SSHDroid / JuiceSSH.
On Android I've usually installed all of these tools but most frequently used Connectbot, which quickly become my favourite SSH client for Android over time.

The reasons why I really loved Connectbot and used it on Android OS in short:

  • It is Completely free
  • Ad-free
  • Open-source (too bad not Free software but still step better)
  • Copy and paste text between Applications
  • Customizable interface (i.e. font size, keyboard layout, SSH auth agent, etc.)


connectbot-android-ssh-remote-connect-client-screenshot

I've seen some people used and preferred Termius but never myself really liked this client, as it was including some Advertisements or for don't remember why reason.
Switching to iOS mobile operating system, of course was quite a shock especially the moment I found out the standard loved SSH Remote Client programs are used are not available or have only a paid version. Thus it took me quite a while of a research and googling until I found some decent stuff.

termius-ssh-telnet-client-ios-screenshot

Tried for a time with Termius as well but again, its Ads and lack of some functionality pissed me off, so I've moved on to Shelly.

shelly-iphone-ssh-telnet-client-ios-screenshot

Shelly is really not a bad tool but has limitation over the SSH sessions you can add and other limitations, which can only be unlocked with an "Upgrade", to its paid version, thus I decided after few weeks of attempts to make it my remote server management mobile tool for iPhone, I've dropped it off as well.

Then I found the Blink Shell App – Blink Shell is a professional, desktop grade terminal for iOS. As overall the tool is really great and is easy to use but again to have it used in its full power you need the paid version and until you pay for it every now and then you got interruption of your shell for some really annoying ads.
Thus even though I used it for a times this few tools with whom basicly you can do basic remote ssh / telnet session operations eventually,  started looking for a better SSH Client Free alternative for iPhone Users.

Then came a friend at home for a dinner my dear friend Milen (Static) and he show me iOS.
The moment I saw this tool I totally loved it, for its simplicity and its resemblance to a classical TTY Physical old Linux console I used back in the days and its ability to resemble easily any improved functionaltiy through simple screen (multiple session management) command tool or tmux.

Wait, what's iSH ? And why it is the Best SSH / Telnet client to manage your servers remotely on iOS Mobiles (iPhone and IPads) ? 

iSH is a project to get a Linux shell environment running locally on your iOS device, using a usermode x86 emulator.


In other wors iSH is Linux emulator with busybox and a package ports for many of the standard Linux tools you get by simple apt-get / yum or if I have to compare you get via the MobaXterm's advanced apt-cyg (Cygwin packages) tool capabilities.

Once iSH is installed it comes with pre-installed apk command line package management tool, with which you can install stuff like openssh-client / screen / tmux / mc (midnight commander) etc. apk, is an apt like command like tool which uses as a basis for installing its packages Alpine Linux repositories.
Alpine Linux is perhaps little known as it is not one of these main stream disributions, such as Fedora or Ubuntu, but for those more concerned about security  Alpine Linux is well known as it is a security-oriented, lightweight Linux distribution based on musl libc and busybox. What makes the Linux even more attractive and perhaps the reason why the iSH developers decided to use it as a basis for their iSH emulator is it being actively developed and its tightened security makes it a good compliment to the quite closed and security focused mobile platform iOS.

iSH is available straight from AppStore , so to use it install it and run it (it is really a great news that iOS does not require iphone to be jailbreak – ed, and it is an ordinary installable software straight from AppStore):
iSH, already comes with some of the standard programs you would expect in a Linux environment such as Vi, wget, zip / unzip, and tar.
However to fit it better for my use over ssh and improve its capabilities, as well as support and use multiple Virtual windows ssh, just like you do on a Linux xterm
run from ish shell: 

# apk add openssh-client
# apk add screen
# apk add vim
# apk add mc


ish-screenshot-terminal3-linux-emulator-iphone-alpine

ish-screenshot-terminal2-linux-emulator-iphone-alpine

ish-screenshot-terminal1-linux-emulator-iphone-alpine-linux

I also like to have a Midnight Commander and VIM Text editor installed out of the box to be able to move around in Ncurses interface through my iPhone.

ish-iphone-keyboard-key-shortcuts

Note that, just like most GNU / Linux distributions, iOS shell will run a normal bash shell.
From there on to use iSH as my default SSH client and enable my just installed GNU screen some Windowing beauty for readability whence I use the screen with multiple ssh logins to different servers as well make the screen Virtual consoles to have ability for scroll back and scroll up of console text to work, I do set up the following .screenrc inside my /home/iPhoneuser

The .screenrc to setup on the iSH to easify your work with screen is as follows:
 

# An alternative hardstatus to display a bar at the bottom listing the
# windownames and highlighting the current windowname in blue. (This is only
# enabled if there is no hardstatus setting for your terminal)
hardstatus on
hardstatus alwayslastline
hardstatus string "%{.bW}%-w%{.rW}%n %t%{-}%+w %=%{..G} %H %{..Y} %m/%d %C%a "
# Enable scrolling fix the annoying screen scrolling problem
termcapinfo xterm* ti@:te@
# Scroll up
bindkey -d "^[[5S" eval copy "stuff 5\025"
bindkey -m "^[[5S" stuff 5\025

# Scroll down
bindkey -d "^[[5T" eval copy "stuff 5\004"
bindkey -m "^[[5T" stuff 5\004

# Scroll up more
bindkey -d "^[[25S" eval copy "stuff \025"
bindkey -m "^[[25S" stuff \025

# Scroll down more
bindkey -d "^[[25T" eval copy "stuff \004"
bindkey -m "^[[25T" stuff \004

You can download the same .screenrc file from here straight with wget from the console:

# wget https://www.pc-freak.net/files/.screenrc


Run GNU screen manager


 # screen

You will end up with a screen session, to open a new session for Virtual Terminal use virtual keyboard from ISH and Press

CTRL + A + C

To open other Virtual Windows inside screen just press CTRL + A + C as many times as you need it, each session will appear ina small window on the down corner as you can see in screenshot

ish-terminal-with-screen-multiple-virtual-terminals-screenshot-iphone-ios

To move across the Screen unnamed 3 Virtual Windows 0 ash 1 ash and 2 ash use the Virtual keyboard

for next WIndow use key combination:
 

CTRL + A + N (where + is just to indicate you have to press them once after another and not actually press the + 🙂 )


For Previous Window use:

CTRL + A + P

Or use CTRL + A and type 

:number 3 (where number is the number of window)

The available iSH commands without adding any further packages which are part of the busybox install are as follows:

Available /bin/ directory commands:

arch  ash  base64  bbconfig  busybox  cat  chgrp  chmod  chown  conspy  cp  date  dd  df  dmesg  dnsdomainname  dumpkmap  echo  ed  egrep  false  fatattr  fdflush  fgrep  fsync  getopt  grep  gunzip  gzip  hostname  ionice  iostat  ipcalc  kbd_mode  kill  link  linux32  linux64  ln  login  ls  lzop  makemime  mkdir  mknod  mktemp  more  mount  mountpoint  mpstat  mv  netstat  nice  pidof  ping  ping6  pipe_progress  printenv  ps  pwd  reformime  rev  rm  rmdir  run-parts  sed  setpriv  setserial  sh  sleep  stty  su  sync  tar  touch  true  umount  uname  usleep  watch  zcat  


Available /usr/bin/ commands:    

awk  basename  beep  blkdiscard  bunzip2  bzcat  bzip2  cal  chvt  cksum  clear  cmp  comm  cpio  crontab  cryptpw  cut  dc  deallocvt  diff  dirname  dos2unix  du  dumpleases  eject  env  expand  expr  factor  fallocate  find  flock  fold  free  fuser  getconf  getent  groups  hd  head  hexdump  hostid  iconv  id  install  ipcrm  ipcs  killall  ldd  less  logger  lsof  lsusb  lzcat  lzma  lzopcat  md5sum  mesg  microcom  mkfifo  mkpasswd  nc  nl  nmeter  nohup  nproc  nsenter  nslookup  od  passwd  paste  patch  pgrep  pkill  pmap  printf  pscan  pstree  pwdx  readlink  realpath  renice  reset  resize  scanelf  seq  setkeycodes  setsid  sha1sum  sha256sum  sha3sum  sha512sum  showkey  shred  shuf  smemcap  sort  split  ssl_client  strings  sum  tac  tail  tee  test  time  timeout  top  tr  traceroute  traceroute6  truncate  tty  ttysize  udhcpc6  unexpand  uniq  unix2dos  unlink  unlzma  unlzop  unshare  unxz  unzip  uptime  uudecode  uuencode  vi  vlock  volname  wc  wget  which  whoami  whois  xargs  xxd  xzcat  yes  


If you're a maniac developer you can even use iSH, to do some programs development with vim with Python / Perl or PHP as these are available from the Alpine repositories and installable via a simple apk add packagename for security experts nmap and some security tools are also available but unfortunately not everything is still working as this project is in active development and iOS has some security limitations if OS is not ROOTED 🙂

Hence some of the packages you can install via apk manager will be failing actually.
There is a list of What works and what doesn't still on iSH on the project github wiki check it out here.

There is much more funny stuff you can do with it, and actually my quick research on how people use iSH on their phones lead me to some Videos talking about iOS and Ethical hacking etc, but I'll stop here as I dont have the time to dig deeper to it. 
If you know or have some good use of iSH or some other goody you are using as a hack please share in comments.

Enjoy ! 🙂

How to install Viber client on Debian GNU / Linux / Ubuntu / Mint in 2022 and enable Bulgarian language cyrillic phonetic keyboard

Tuesday, October 4th, 2022

How to install Viber client on Debian GNU / Linux / Ubuntu / Mint in 2022 and enable Bulgarian language cyrillic phonetic keyboard

how-to-install-and-use-viber-on-gnu-linux-desktop-viber-logo-tux-for-audio-video-communication-with-nonfree-world

So far I've always used Viber on my mobile phone earlier on my Blu H1 HD and now after my dear friend Nomen give me his old iPhone X, i have switched to the iOS version which i find still a bit strangely looking.
Using Viber on the phone and stretching for the Phone all day long is really annoying especially if you work in the field of Information technology like me as System Administrator programmer. Thus having a copy of Viber on your Linux desktop that is next to you is a must.
Viber is proprietary software on M$ Windows its installation is a piece of cake, you install confirm that you want to use it on a secondary device by scanning the QR and opening the URL with your phone and you're ready to Chat and Viber Call with your friends or colleagues

As often on Linux, it is a bit more complicated as the developers of Viber, perhaps did not put too much effort to port it to Linux or did not have much knowledge of how Linux is organized or they simply did not have the time to put for enough testing, and hence installing the Viber on Linux does not straight supported the Bulgarian traditional cyrillic. I've done some small experimentation and installed Viber on Linux both as inidividual package from their official Linux .deb package as well as of a custom build flatpak. In this small article, i'll put it down how i completed that as well as how managed to workaround the language layout problems with a simple setxkbmap cmd.

How to install Viber client on Debian GNU / Linux / Ubuntu / Mint in 2022 and enable Bulgarian language cyrillic phonetic

1.Install and use Viber as a standard Desktop user Linux application

Download latest Debian AMD64 .deb binary from official Viber website inside some dir with Opera / Chrome / Firefox browser and store it in:

hipo@jericho: ~$ cd /usr/local/src

Alternatively you can run the above wget command, but this is not the recommended way since you might end up with Viber Linux version that is older.

hipo@jericho: ~$ sudo wget http://download.cdn.viber.com/cdn/desktop/Linux/viber.deb
hipo@jericho: ~$ su – root

1.2. Resolve the required Viber .deb package dependecies

To resolve the required dependencies of viber.deb package, easiest way is to use gdebi-core # apt-cache show gdebi-core|grep Description-en -A4 Description-en: simple tool to install deb files  gdebi lets you install local deb packages resolving and installing  its dependencies. apt does the same, but only for remote (http, ftp)  located packages. # apt-get install gdebi-core … # apt-get install -f ./viber

1.3. Setting the default language for Viber to support non-latin languages like Cyrillic

I'm Bulgarian and I use the Phonetic Traidional BG keyboard that is UTF8 compatible but cyrillic and non latin. However Viber developers seems to not put much effort and resolve that the Bulgarian Phonetic Traditional keyboard added in my Mate Desktop Environment to work out of the box with Viber on Linux. So as usual in Linux you need a hack ! The hack consists of using setxkbmap to set supported keyboard layouts for Viber US,BG and Traditional Phonetic. This can be done with above command:

setxkbmap -layout 'us,bg' -variant ' ,phonetic' -option 'grp:lalt_lshift_toggle'

To run it everytime together with the Viber binary executable that is stored in location /opt/viber/Viber as prepared by the package developer by install and post-install scripts in the viber.deb, prepared also a 3 liner tine script:

# cat start_viber.sh
#!/bin/bash
cd /opt/viber; setxkbmap -layout 'us,bg' -variant ' ,phonetic' -option 'grp:lalt_lshift_toggle'
./Viber


viber-appearance-menu-screenshot-linux


2. Install Viber in separated isolated sandbox from wider system

Second way if you don't trust a priorietary third party binary of Viber (and don't want for Viber to be able to possibly read data of your login GNOME / KDE user, e.g. not be spied by KGB 🙂

For those curious why i'm saying that Viber is mostly used mainly in the ex Soviet Union and in the countries that used to be Soviet satellite ones for one or another reason and though being developed in Israel some of its development in the past was done in Belarus as far as I remember one of the main 3 members (Ukraine, Belarus and Russia) that took the decision to dissolve the USSR 🙂

Talking about privacy if you're really concerned about privacy the best practice is not to use neither WhatApp nor Viber at all on any OS, but this is hard as usually most people are already "educated" to use one of the two. 
For the enthusiasts however I do recommend just to use the Viber / WhatsApp free GPLed software alternative for Vital communication that you don't want to have been listened to by the China / USA / Russia etc. 
Such a good free software alternative is Jitsy and it has both a Web interface that can be used very easily straight inside a browser or you could install a desktop version for PC / iOS and Android and more.
An interesting and proud fact to mention about Jitsy is that its main development that led the project to the state it is now is being done by a buddy Bulgarian ! Good Job man ! 🙂

If you want to give jitsy a try in web with a friend just clik over my pc-freak home lab machine has installed usable version on meet.pc-freak.net

In the same way people in most countries with American and English free world use the WhatsApp which is a another free spy and self analysis software offered by America most likely collecting your chat data and info about you in the (US Central Intelligence Agency) CIA databases. But enough blant so to minimize a bit the security risks of having the binary run directly as a process you can use a containerization like docker to run it inside and isolate from the rest of your Linux desktop. flatpak is a tool developed exactly for that.


hipo@jeremiah:/opt/viber$ apt-cache show flatpak|grep -i Description-en -A 13

Description-en: Application deployment framework for desktop apps
 Flatpak installs, manages and runs sandboxed desktop application bundles.
 Application bundles run partially isolated from the wider system, using
 containerization techniques such as namespaces to prevent direct access
 to system resources. Resources from outside the sandbox can be accessed
 via "portal" services, which are responsible for access control; for
 example, the Documents portal displays an "Open" dialog outside the
 sandbox, then allows the application to access only the selected file.
 .
 Each application uses a specified "runtime", or set of libraries, which is
 available as /usr inside its sandbox. This can be used to run application
 bundles with multiple, potentially incompatible sets of dependencies within
 the same desktop environment.

Having Viber installed on Linux inside a container with flatpak is as simple as to adding, repository and installing the flatpak package
already bundled and stored inside flathub repository, e.g.:
 

2.1. Install flatpak 

# sudo apt install flatpak


flatpak-viber-installation-linux-screenshot
 

2.2. Add flathub install repository

flatpak is pretty much like dockerhub, it contains images of containered sandbox copies of software, the main advantage of flatpak is its portability, scalability and security.
Of course if you're a complete security freak you can prepare yourself an own set of Viber and add it to flathub and use instead of the original one 🙂
 

# sudo flatpak remote-add –if-not-exists flathub https://flathub.org/repo/flathub.flatpakrepo

2.3. Install Flatpak-ed Viber 

#sudo flatpak install flathub com.viber.Viber


Reboot the PC and to test Viber will run containerized normally issue below flapak start command:

# /usr/bin/flatpak run –branch=stable –arch=x86_64 –command=viber com.viber.Viber


Viber-inside-flatpak-sandbox-on-debian-linux-screenshot-running

! NOTE !  The Linux version of Viber is missing Backups options, exclusively the Settings -> Account -> Viber backup menus is missing, but the good news is that if you're using the Viber client
as a secondary device message client, on first login you'll be offered to Synchronize your Viber data with your 1st Active device (usually your Smart Phone). Just click on it and allow the synchronization from your phone and in a while the Contacts and message history should be on the Linux Viber client.

That's it Enjoy your Viber Sound and Video on Linux ! 🙂

Log rsyslog script incoming tagged string message to separate external file to prevent /var/log/message from string flood

Wednesday, December 22nd, 2021

rsyslog_logo-log-external-tag-scripped-messages-to-external-file-linux-howto

If you're using some external bash script to log messages via rsyslogd to some of the multiple rsyslog understood data tubes (called in rsyslog language facility levels) and you want Rsyslog to move message string to external log file, then you had the same task as me few days ago.

For example you have a bash shell script that is writting a message to rsyslog daemon to some of the predefined facility levels be it:
 

kern,user,cron, auth etc. or some local

and your logged script data ends under the wrong file location /var/log/messages , /var/log/secure , var/log/cron etc. However  you need to log everything coming from that service to a separate file based on the localX (fac. level) the usual way to do it is via some config like, as you would usually do it with rsyslog variables as:
 

local1.info                                            /var/log/custom-log.log

# Don't log private authentication messages!
*.info;mail.none;authpriv.none;cron.none;local0.none;local1.none        /var/log/messages


Note the local1.none is instructing the rsyslog not to log anything from local1 facility towards /var/log/message. 
But what if this due to some weirdness in configuration of rsyslog on the server or even due to some weird misconfiguration in

/etc/systemd/journald.conf such as:

[Journal]
Storage=persistent
RateLimitInterval=0s
RateLimitBurst=0
SystemMaxUse=128M
SystemMaxFileSize=32M
MaxRetentionSec=1month
MaxFileSec=1week
ForwardToSyslog=yes
SplitFiles=none

Due to that config and especially the FowardToSyslog=yes, the messages sent via the logger tool to local1 still end up inside /var/log/messages, not nice huh ..

The result out of that is anything being sent with a predefined TAGGED string via the whatever.sh script which uses the logger command  (if you never use it check man logger) to enter message into rsyslog with cmd like:
 

# logger -p local1.info -t TAG_STRING

# logger -p local2.warn test
# tail -2 /var/log/messages
Dec 22 18:58:23 pcfreak rsyslogd: — MARK —
Dec 22 19:07:12 pcfreak hipo: test


was nevertheless logged to /var/log/message.
Of course /var/log/message becomes so overfilled with "junk" shell script data not related to real basic Operating system adminsitration, so this prevented any critical or important messages that usually should come under /var/log/message / /var/log/syslog to be lost among the big quantities of other tagged tata reaching the log.

After many attempts to resolve the issue by modifying /etc/rsyslog.conf as well as the messed /etc/systemd/journald.conf (which by the way was generated with this strange values with an OS install time automation ansible stuff). It took me a while until I found the solution on how to tell rsyslog to log the tagged message strings into an external separate file. From my 20 minutes of research online I have seen multitudes of people in different Linux OS versions to experience the same or similar issues due to whatever, thus this triggered me to write this small article on the solution to rsyslog.

The solution turned to be pretty easy but requires some further digging into rsyslog, Redhat's basic configuration on rsyslog documentation is a very nice reading for starters, in my case I've used one of the Propery-based compare-operations variable contains used to select my tagged message string.
 

1. Add msg contains compare-operations to output log file and discard the messages

[root@centos bin]# vi /etc/rsyslog.conf

# config to log everything logged to rsyslog to a separate file
:msg, contains, "tag_string:/"         /var/log/custom-script-log.log
:msg, contains, "tag_string:/"    ~

Substitute quoted tag_string:/ to whatever your tag is and mind that it is better this config is better to be placed somewhere near the beginning of /etc/rsyslog.conf and touch the file /var/log/custom-script-log.log and give it some decent permissions such as 755, i.e.
 

1.1 Discarding a message


The tilda sign –  

as placed to the end of the msg, contains is the actual one to tell the string to be discarded so it did not end in /var/log/messages.

Alternative rsyslog config to do discard the unwanted message once you have it logged is with the
rawmsg variable, like so:


# config to log everything logged to rsyslog to a separate file
:msg, contains, "tag_string:/"         /var/log/custom-script-log.log
:rawmsg, isequal, "tag_string:/" stop

Other way to stop logging immediately after log is written to custom file across some older versions of rsyslog is via the &stop

:msg, contains, "tag_string:/"         /var/log/custom-script-log.log
& stop

I don't know about other versions but Unfortunately the &stop does not work on RHEL 7.9 with installed rpm package rsyslog-8.24.0-57.el7_9.1.x86_64.

1.2 More with property based filters basic exclusion of string 

Property based filters can do much more, you can for example, do regular expression based matches of strings coming to rsyslog and forward to somewhere.

To select syslog messages which do not contain any mention of the words fatal and error with any or no text between them (for example, fatal lib error), type:

:msg, !regex, "fatal .* error"


2. Create file where tagged data should be logged and set proper permissions
 

[root@centos bin]# touch /var/log/custom-script-log.log
[root@centos bin]# chmod 755 /var/log/custom-script-log.log


3. Test rsyslogd configuration for errors and reload rsyslog

[root@centos ]# rsyslogd -N1
rsyslogd: version 8.24.0-57.el7_9.1, config validation run (level 1), master config /etc/rsyslog.conf
rsyslogd: End of config validation run. Bye.

[root@centos ]# systemctl restart rsyslog
[root@centos ]#  systemctl status rsyslog 
● rsyslog.service – System Logging Service
   Loaded: loaded (/usr/lib/systemd/system/rsyslog.service; enabled; vendor preset: enabled)
   Active: active (running) since Wed 2021-12-22 13:40:11 CET; 3h 5min ago
     Docs: man:rsyslogd(8)
           http://www.rsyslog.com/doc/
 Main PID: 108600 (rsyslogd)
   CGroup: /system.slice/rsyslog.service
           └─108600 /usr/sbin/rsyslogd -n


4. Property-based compare-operations supported by rsyslog table
 

Compare-operation Description
contains Checks whether the provided string matches any part of the text provided by the property. To perform case-insensitive comparisons, use  contains_i .
isequal Compares the provided string against all of the text provided by the property. These two values must be exactly equal to match.
startswith Checks whether the provided string is found exactly at the beginning of the text provided by the property. To perform case-insensitive comparisons, use  startswith_i .
regex Compares the provided POSIX BRE (Basic Regular Expression) against the text provided by the property.
ereregex Compares the provided POSIX ERE (Extended Regular Expression) regular expression against the text provided by the property.
isempty Checks if the property is empty. The value is discarded. This is especially useful when working with normalized data, where some fields may be populated based on normalization result.


5. Rsyslog understanding Facility levels

Here is a list of facility levels that can be used.

Note: The mapping between Facility Number and Keyword is not uniform over different operating systems and different syslog implementations, so among separate Linuxes there might be diference in the naming and numbering.

Facility Number Keyword Facility Description
0 kern kernel messages
1 user user-level messages
2 mail mail system
3 daemon system daemons
4 auth security/authorization messages
5 syslog messages generated internally by syslogd
6 lpr line printer subsystem
7 news network news subsystem
8 uucp UUCP subsystem
9   clock daemon
10 authpriv security/authorization messages
11 ftp FTP daemon
12 NTP subsystem
13 log audit
14 log alert
15 cron clock daemon
16 local0 local use 0 (local0)
17 local1 local use 1 (local1)
18 local2 local use 2 (local2)
19 local3 local use 3 (local3)
20 local4 local use 4 (local4)
21 local5 local use 5 (local5)
22 local6 local use 6 (local6)
23 local7 local use 7 (local7)


6. rsyslog Severity levels (sublevels) accepted by facility level

As defined in RFC 5424, there are eight severity levels as of year 2021:

Code Severity Keyword Description General Description
0 Emergency emerg (panic) System is unusable. A "panic" condition usually affecting multiple apps/servers/sites. At this level it would usually notify all tech staff on call.
1 Alert alert Action must be taken immediately. Should be corrected immediately, therefore notify staff who can fix the problem. An example would be the loss of a primary ISP connection.
2 Critical crit Critical conditions. Should be corrected immediately, but indicates failure in a primary system, an example is a loss of a backup ISP connection.
3 Error err (error) Error conditions. Non-urgent failures, these should be relayed to developers or admins; each item must be resolved within a given time.
4 Warning warning (warn) Warning conditions. Warning messages, not an error, but indication that an error will occur if action is not taken, e.g. file system 85% full – each item must be resolved within a given time.
5 Notice notice Normal but significant condition. Events that are unusual but not error conditions – might be summarized in an email to developers or admins to spot potential problems – no immediate action required.
6 Informational info Informational messages. Normal operational messages – may be harvested for reporting, measuring throughput, etc. – no action required.
7 Debug debug Debug-level messages. Info useful to developers for debugging the application, not useful during operations.


7. Sample well tuned configuration using severity and facility levels and immark, imuxsock, impstats
 

Below is sample config using severity and facility levels
 

# Don't log private authentication messages!
*.info;mail.none;authpriv.none;cron.none;local0.none;local1.none        /var/log/messages


Note the local0.none; local1.none tells rsyslog to not log from that facility level to /var/log/messages.

If you need a complete set of rsyslog configuration fine tuned to have a proper logging with increased queues and included configuration for loggint to remote log aggegator service as well as other measures to prevent the system disk from being filled in case if something goes wild with a logging service leading to a repeatedly messages you might always contact me and I can help 🙂
 Other from that sysadmins might benefit from a sample set of configuration prepared with the Automated rsyslog config builder  or use some fine tuned config  for rsyslog-8.24.0-57.el7_9.1.x86_64 on Redhat 7.9 (Maipo)   rsyslog_config_redhat-2021.tar.gz.

To sum it up rsyslog though looks simple and not an important thing to pre

Zabbix rkhunter monitoring check if rootkits trojans and viruses or suspicious OS activities are detected

Wednesday, December 8th, 2021

monitor-rkhunter-with-zabbix-zabbix-rkhunter-check-logo

If you're using rkhunter to monitor for malicious activities, a binary changes, rootkits, viruses, malware, suspicious stuff and other famous security breach possible or actual issues, perhaps you have configured your machines to report to some Email.
But what if you want to have a scheduled rkhunter running on the machine and you don't want to count too much on email alerting (especially because email alerting) makes possible for emails to be tracked by sysadmin pretty late?

We have been in those situation and in this case me and my dear colleague Georgi Stoyanov developed a small rkhunter Zabbix userparameter check to track and Alert if any traces of "Warning"''s are mateched in the traditional rkhunter log file /var/log/rkhunter/rkhunter.log

To set it up and use it is pretty use you will need to have a recent version of zabbix-agent installed on the machine and connected to a Zabbix server, in my case this is:

[root@centos ~]# rpm -qa |grep -i zabbix-agent
zabbix-agent-4.0.7-1.el7.x86_64

 placed inside /etc/zabbix/zabbix_agentd.d/userparameter_rkhunter_warning_check.conf

[root@centos /etc/zabbix/zabbix_agentd.d ]# cat userparameter_rkhunter_warning_check.conf
# userparameter script to check if any Warning is inside /var/log/rkhunter/rkhunter.log and if found to trigger Zabbix alert
UserParameter=rkhunter.warning, (TODAY=$(date |awk '{ print $1" "$2" "$3 }'); if [ $(cat /var/log/rkhunter/rkhunter.log | awk “/$TODAY/,EOF” | /bin/grep -i ‘\[ Warning \]’ | /usr/bin/wc -l) != ‘0’ ]; then echo 1; else echo 0; fi)
UserParameter=rkhunter.suspected,(/bin/grep -i 'Suspect files: ' /var/log/rkhunter/rkhunter.log|tail -n 1| awk '{ print $4 }')
UserParameter=rkhunter.rootkits,(/bin/grep -i 'Possible rootkits: ' /var/log/rkhunter/rkhunter.log|tail -n 1| awk '{ print $4 }')


2. Prepare Rkhunter Template, Triggers and Items


In Zabbix Server that you access from web control interface, you will have to prepare a new template called lets say Rkhunter with the necessery Triggers and Items


2.1 Create Rkhunter Items
 

On Zabbix Server side, uou will have to configure 3 Items for the 3 configured userparameter above script keys, like so:

rkhunter-items-zabbix-screenshot.png

  • rkhunter.suspected Item configuration


rkhunter-suspected-files

  • rkhunter.warning Zabbix Item config

rkhunter-warning-found-check-zabbix

  • rkhunter.rootkits Zabbix Item config


    rkhunter-zabbix-possible-rootkits-item1

    2.2 Create Triggers
     

You need to have an overall of 3 triggers like in below shot:

zabbix-rkhunter-all-triggers-screenshot
 

  • rkhunter.rootkits Trigger config

rkhunter-rootkits-trigger-zabbix1

  • rkhunter.suspected Trigger cfg

rkhunter-suspected-trigger-zabbix1

  • rkhunter warning Trigger cfg

rkhunter-warning-trigger1

3. Reload zabbix-agent and test the keys


It is necessery to reload zabbix agent for the new userparameter to start to be sent to remote zabbix server (through a proxy if you have one configured).

[root@centos ~]# systemctl restart zabbix-agent


To make the zabbix-agent send the keys to the server you can use zabbix_sender to have the test tool you will have to have installed (zabbix-sender) on the server.

To trigger a manualTest if you happen to have some problems with the key which shouldn''t be the case you can sent a value to the respectve key with below command:

[root@centos ~ ]# zabbix_sender -vv -c "/etc/zabbix/zabbix_agentd.conf" -k "khunter.warning" -o "1"


Check on Zabbix Server the sent value is received, for any oddities as usual check what is inside  /var/log/zabbix/zabbix_agentd.log for any errors or warnings.

KVM Virtual Machine RHEL 8.3 Linux install on Redhat 8.3 Linux Hypervisor with custom tailored kickstart.cfg

Friday, January 22nd, 2021

kvm_virtualization-logo-redhat-8.3-install-howto-with-kickstart

If you don't have tried it yet Redhat and CentOS and other RPM based Linux operationg systems that use anaconda installer is generating a kickstart file after being installed under /root/{anaconda-ks.cfg,initial-setup- ks.cfg,original-ks.cfg} immediately after the OS installation completes. Using this Kickstart file template you can automate installation of Redhat installation with exactly the same configuration as many times as you like by directly loading your /root/original-ks.cfg file in RHEL installer.

Here is the official description of Kickstart files from Redhat:

"The Red Hat Enterprise Linux installation process automatically writes a Kickstart file that contains the settings for the installed system. This file is always saved as /root/anaconda-ks.cfg. You may use this file to repeat the installation with identical settings, or modify copies to specify settings for other systems."


Kickstart files contain answers to all questions normally asked by the text / graphical installation program, such as what time zone you want the system to use, how the drives should be partitioned, or which packages should be installed. Providing a prepared Kickstart file when the installation begins therefore allows you to perform the installation automatically, without need for any intervention from the user. This is especially useful when deploying Redhat based distro (RHEL / CentOS / Fedora …) on a large number of systems at once and in general pretty useful if you're into the field of so called "DevOps" system administration and you need to provision a certain set of OS to a multitude of physical servers or create or recreate easily virtual machines with a certain set of configuration.
 

1. Create /vmprivate storage directory where Virtual machines will reside

First step on the Hypervisor host which will hold the future created virtual machines is to create location where it will be created:

[root@redhat ~]#  lvcreate –size 140G –name vmprivate vg00
[root@redhat ~]#  mkfs.ext4 -j -b 4096 /dev/mapper/vg00-vmprivate
[root@redhat ~]# mount /dev/mapper/vg00-vmprivate /vmprivate

To view what is the situation with Logical Volumes and  VG group names:

[root@redhat ~]# vgdisplay -v|grep -i vmprivate -A7 -B7
  Segments               1
  Allocation             inherit
  Read ahead sectors     auto
  – currently set to     8192
  Block device           253:0


  — Logical volume —
  LV Path                /dev/vg00/vmprivate
  LV Name                vmprivate
  VG Name                vg00
  LV UUID                VVUgsf-FXq2-TsMJ-QPLw-7lGb-Dq5m-3J9XJJ
  LV Write Access        read/write
  LV Creation host, time main.hostname.com, 2021-01-20 17:26:11 +0100
  LV Status              available
  # open                 1
  LV Size                150.00 GiB


Note that you'll need to have the size physically available on a SAS / SSD Hard Drive physically connected to Hypervisor Host.

To make the changes Virtual Machines storage location directory permanently mounted add to /etc/fstab

/dev/mapper/vg00-vmprivate  /vmprivate              ext4    defaults,nodev,nosuid 1 2

[root@redhat ~]# echo '/dev/mapper/vg00-vmprivate  /vmprivate              ext4    defaults,nodev,nosuid 1 2' >> /etc/fstab


2. Second we need to install the following set of RPM packages on the Hypervisor Hardware host

[root@redhat ~]# yum install qemu-kvm qemu-img libvirt virt-install libvirt-client virt-manager libguestfs-tools virt-install virt-top -y

3. Enable libvirtd on the host

[root@redhat ~]#  lsmod | grep -i kvm
[root@redhat ~]#  systemctl enable libvirtd

4. Configure network bridging br0 interface on Hypervisor


In /etc/sysconfig/network-scripts/ifcfg-eth0 you need to include:

NM_CONTROLED=NO

Next use nmcli redhat configurator to create the bridge (you can use ip command instead) but since the tool is the redhat way to do it lets do it their way ..

[root@redhat ~]# nmcli connection delete eno3
[root@redhat ~]# nmcli connection add type bridge autoconnect yes con-name br0 ifname br0
[root@redhat ~]# nmcli connection modify br0 ipv4.addresses 10.80.51.16/26 ipv4.method manual
[root@redhat ~]# nmcli connection modify br0 ipv4.gateway 10.80.51.1
[root@redhat ~]# nmcli connection modify br0 ipv4.dns 172.20.88.2
[root@redhat ~]# nmcli connection add type bridge-slave autoconnect yes con-name eno3 ifname eno3 master br0
[root@redhat ~]# nmcli connection up br0

5. Prepare a working kickstart.cfg file for VM


Below is a sample kickstart file I've used to build a working fully functional Virtual Machine with Red Hat Enterprise Linux 8.3 (Ootpa) .

#version=RHEL8
#install
# Run the Setup Agent on first boot
firstboot --enable
ignoredisk --only-use=vda
# Use network installation
#url --url=http://hostname.com/rhel/8/BaseOS
##url --url=http://171.23.8.65/rhel/8/os/BaseOS
# Use text mode install
text
#graphical
# System language
#lang en_US.UTF-8
keyboard --vckeymap=us --xlayouts='us'
# Keyboard layouts
##keyboard us
lang en_US.UTF-8
# Root password
rootpw $6$gTiUCif4$YdKxeewgwYCLS4uRc/XOeKSitvDJNHFycxWVHi.RYGkgKctTMCAiY2TErua5Yh7flw2lUijooOClQQhlbstZ81 --iscrypted
# network-stuff
# place ip=your_VM_IP, netmask, gateway, nameserver hostname 
network --bootproto=static --ip=10.80.21.19 --netmask=255.255.255.192 --gateway=10.80.21.1 --nameserver=172.30.85.2 --device=eth0 --noipv6 --hostname=FQDN.VMhost.com --onboot=yes
# if you need just localhost initially configured uncomment and comment above
##network В --device=lo --hostname=localhost.localdomain
# System authorization information
authconfig --enableshadow --passalgo=sha512 --enablefingerprint
# skipx
skipx
# Firewall configuration
firewall --disabled
# System timezone
timezone Europe/Berlin
# Clear the Master Boot Record
##zerombr
# Repositories
## Add RPM repositories from KS file if necessery
#repo --name=appstream --baseurl=http://hostname.com/rhel/8/AppStream
#repo --name=baseos --baseurl=http://hostname.com/rhel/8/BaseOS
#repo --name=inst.stage2 --baseurl=http://hostname.com ff=/dev/vg0/vmprivate
##repo --name=rhsm-baseos В  В --baseurl=http://172.54.8.65/rhel/8/rhsm/x86_64/BaseOS/
##repo --name=rhsm-appstream --baseurl=http://172.54.8.65/rhel/8/rhsm/x86_64/AppStream/
##repo --name=os-baseos В  В  В --baseurl=http://172.54.9.65/rhel/8/os/BaseOS/
##repo --name=os-appstream В  --baseurl=http://172.54.8.65/rhel/8/os/AppStream/
#repo --name=inst.stage2 --baseurl=http://172.54.8.65/rhel/8/BaseOS
# Disk partitioning information set proper disk sizing
##bootloader --location=mbr --boot-drive=vda
bootloader --append=" crashkernel=auto tsc=reliable divider=10 plymouth.enable=0 console=ttyS0 " --location=mbr --boot-drive=vda
# partition plan
zerombr
clearpart --all --drives=vda --initlabel
part /boot --size=1024 --fstype=ext4 --asprimary
part swap --size=1024
part pv.01 --size=30000 --grow --ondisk=vda
##part pv.0 --size=80000 --fstype=lvmpv
#part pv.0 --size=61440 --fstype=lvmpv
volgroup s pv.01
logvol / --vgname=s --size=15360 --name=root --fstype=ext4
logvol /var/cache/ --vgname=s --size=5120 --name=cache --fstype=ext4 --fsoptions="defaults,nodev,nosuid"
logvol /var/log --vgname=s --size=7680 --name=log --fstype=ext4 --fsoptions="defaults,nodev,noexec,nosuid"
logvol /tmp --vgname=s --size=5120 --name=tmp --fstype=ext4 --fsoptions="defaults,nodev,nosuid"
logvol /home --vgname=s --size=5120 --name=home --fstype=ext4 --fsoptions="defaults,nodev,nosuid"
logvol /opt --vgname=s --size=2048 --name=opt --fstype=ext4 --fsoptions="defaults,nodev,nosuid"
logvol /var/log/audit --vgname=s --size=3072 --name=audit --fstype=ext4 --fsoptions="defaults,nodev,nosuid"
logvol /var/spool --vgname=s --size=2048 --name=spool --fstype=ext4 --fsoptions="defaults,nodev,nosuid"
logvol /var --vgname=s --size=7680 --name=var --fstype=ext4 --fsoptions="defaults,nodev,nosuid"
# SELinux configuration
selinux --disabled
# Installation logging level
logging --level=debug
# reboot automatically
reboot
###
%packages
@standard
python3
pam_ssh_agent_auth
-nmap-ncat
#-plymouth
#-bpftool
-cockpit
#-cryptsetup
-usbutils
#-kmod-kvdo
#-ledmon
#-libstoragemgmt
#-lvm2
#-mdadm
-rsync
#-smartmontools
-sos
-subscription-manager-cockpit
# Tune Linux vm.dirty_background_bytes (IMAGE-439)
# The following tuning causes dirty data to begin to be background flushed at
# 100 Mbytes, so that it writes earlier and more often to avoid a large build
# up and improving overall throughput.
echo "vm.dirty_background_bytes=100000000" >> /etc/sysctl.conf
# Disable kdump
systemctl disable kdump.service
%end

Important note to make here is the MD5 set root password string in (rootpw) line this string can be generated with openssl or mkpasswd commands :

Method 1: use openssl cmd to generate (md5, sha256, sha512) encrypted pass string

[root@redhat ~]# openssl passwd -6 -salt xyz test
$6$xyz$rjarwc/BNZWcH6B31aAXWo1942.i7rCX5AT/oxALL5gCznYVGKh6nycQVZiHDVbnbu0BsQyPfBgqYveKcCgOE0

Note: passing -1 will generate an MD5 password, -5 a SHA256 encryption and -6 SHA512 encrypted string (logically recommended for better security)

Method 2: (md5, sha256, sha512)

[root@redhat ~]# mkpasswd –method=SHA-512 –stdin

The option –method accepts md5, sha-256 and sha-512
Theoretically there is also a kickstart file generator web interface on Redhat's site here however I never used it myself but instead use above kickstart.cfg
 

6. Install the new VM with virt-install cmd


Roll the new preconfigured VM based on above ks template file use some kind of one liner command line  like below:
 

[root@redhat ~]# virt-install -n RHEL8_3-VirtualMachine –description "CentOS 8.3 Virtual Machine" –os-type=Linux –os-variant=rhel8.3 –ram=8192 –vcpus=8 –location=/vmprivate/rhel-server-8.3-x86_64-dvd.iso –disk path=/vmprivate/RHEL8_3-VirtualMachine.img,bus=virtio,size=70 –graphics none –initrd-inject=/root/kickstart.cfg –extra-args "console=ttyS0 ks=file:/kickstart.cfg"

7. Use a tiny shell script to automate VM creation


For some clarity and better automation in case you plan to repeat VM creation you can prepare a tiny bash shell script:
 

#!/bin/sh
KS_FILE='kickstart.cfg';
VM_NAME='RHEL8_3-VirtualMachine';
VM_DESCR='CentOS 8.3 Virtual Machine';
RAM='8192';
CPUS='8';
# size is in Gigabytes
VM_IMG_SIZE='140';
ISO_LOCATION='/vmprivate/rhel-server-8.3-x86_64-dvd.iso';
VM_IMG_FILE_LOC='/vmprivate/RHEL8_3-VirtualMachine.img';

virt-install -n "$VMNAME" –description "$VM_DESCR" –os-type=Linux –os-variant=rhel8.3 –ram=8192 –vcpus=8 –location="$ISO_LOCATION" –disk path=$VM_IMG_FILE,bus=virtio,size=$IMG_VM_SIZE –graphics none –initrd-inject=/root/$KS_FILE –extra-args "console=ttyS0 ks=file:/$KS_FILE"


A copy of virt-install.sh script can be downloaded here

Wait for the installation to finish it should be visualized and if all installation is smooth you should get a login prompt use the password generated with openssl tool and test to login, then disconnect from the machine by pressing CTRL + ] and try to login via TTY with

[root@redhat ~]# virst list –all
 Id   Name        State
—————————
 2    
RHEL8_3-VirtualMachine   running

[root@redhat ~]#  virsh console RHEL8_3-VirtualMachine


redhat8-login-prompt

One last thing I recommend you check the official documentation on Kickstart2 from CentOS official website

In case if you later need to destroy the VM and the respective created Image file you can do it with:
 

[root@redhat ~]#  virsh destroy RHEL8_3-VirtualMachine
[root@redhat ~]#  virsh undefine RHEL8_3-VirtualMachine

Don't forget to celebreate the success and give this nice article a credit by sharing this nice tutorial with a friend or by placing a link to it from your blog 🙂


Enjoy !

How to move transfer binary files encoded with base64 on Linux with Copy Paste of text ASCII encoded string

Monday, October 25th, 2021

base64-encode-decode-binary-files-to-transfer-between-servers-base64-artistic-logo

If you have to work on servers in a protected environments that are accessed via multiple VPNs, Jump hosts or Web Citrix and you have no mean to copy binary files to your computer or from your computer because you have all kind of FTP / SFTP or whatever Data Copy clients disabled on remote jump host side or CITRIX server and you still are looking for a way to copy files between your PC and the Remote server Side.
Or for example if you have 2 or more servers that are in a special Demilitarized Network Zones ( DMZ ) and the machines does not have SFTP / FTP / WebServer or other kind of copy protocol service that can be used to copy files between the hosts and you still need to copy some files between the 2 or more machines in a slow but still functional way, then you might not know of one old school hackers trick you can employee to complete the copy of files between DMZ-ed Server Host A lets say with IP address (192.168.50.5) -> Server Host B (192.168.30.7). The way to complete the binary file copy is to Encode the binary on Server Host A and then, use cat  command to display the encoded string and copy whole encoded cat command output  to your (local PC buffer from where you access the remote side via SSH via the CITRIX or Jump host.). Then decode the encoded file with an encoding tool such as base64 or uuencode. In this article, I'll show how this is done with base64 and uuencode. Base64 binary is pretty standard in most Linux / Unix OS-es today on most Linux distributions it is part of the coreutils package.
The main use of base64 encoding to encode non-text Attachment files to Electronic Mail, but for our case it fits perfectly.
Keep in mind, that this hack to copy the binary from Machine A to Machine B of course depends on the Copy / Paste buffer being enabled both on remote Jump host or Citrix from where you reach the servers as well as your own PC laptop from where you access the remote side.

base64-character-encoding-string-table

Base64 Encoding and Decoding text strings legend

The file copy process to the highly secured PCI host goes like this:
 

1. On Server Host A encode with md5sum command

[root@serverA ~]:# md5sum -b /tmp/inputbinfile-to-encode
66c4d7b03ed6df9df5305ae535e40b7d *inputbinfile-to-encode


As you see one good location to encode the file would be /tmp as this is a temporary home or you can use alternatively your HOME dir

but you have to be quite careful to not run out of space if you produce it anywhere 🙂


2. Encode the binary file with base64 encoding

 [root@serverB ~]:# base64 -w0 inputbinfile-to-encode > outputbin-file.base64

The -w0 option is given to disable line wrapping. Line wrapping is perhaps not needed if you will copy paste the data.

base64-encoded-binary-file-text-string-linux-screenshot

Base64 Encoded string chunk with line wrapping

For a complete list of possible accepted arguments check here.

3. Cat the inputbinfile-to-encode just generated to display the text encoded file in your SecureCRT / Putty / SuperPutty etc. remote ssh access client

[root@serverA ~]:# cat /tmp/inputbinfile-to-encode
f0VMRgIBAQAAAAAAAAAAAAMAPgABAAAAMGEAAAAAAABAAAAAAAAAACgXAgAAAAAAAAAAA
EAAOAALAEAAHQAcAAYAAAAEAAA ……………………………………………………………… cTD6lC+ViQfUCPn9bs


4. Select the cat-ted string and copy it to your PC Copy / Paste buffer


If the bin file is not few kilobytes, but few megabytes copying the file might be tricky as the string produced from cat command would be really long, so make sure the SSH client you're using is configured to have a large buffer to scroll up enough and be able to select the whole encoded string until the end of the cat command and copy it to Copy / Paste buffer.


5. On Server Host B paste the bas64 encoded binary inside a newly created file

Open with a text editor vim / mc or whatever is available

[root@serverB ~]:# vi inputbinfile-to-encode

Some very paranoid Linux / UNIX systems might not have even a normal text editor like 'vi' if you happen to need to copy files on such one a useful thing is to use a simple cat on the remote side to open a new File Descriptor buffer, like this:

[root@server2 ~]:# cat >> inputbinfile-to-encode <<'EOF'
Paste the string here


6. Decode the encoded binary with base64 cmd again

[root@serverB ~]:# base64 –decode outputbin-file.base64 > inputbinfile-to-encode


7. Set proper file permissions (the same as on Host A)

[root@serverB ~]:#  chmod +x inputbinfile-to-encode


8. Check again the binary file checksum on Host B is identical as on Host A

[root@serverB ~]:# md5sum -b inputbinfile-to-encode
66c4d7b03ed6df9df5305ae535e40b7d *inputbinfile-to-encode

As you can md5sum match on both sides so file should be OK.


9. Encoding and decoding files with uuencode


If you are lucky and you have uuencode installed (sharutils) package is present on remote machine to encode lets say an archived set of binary files in .tar.gz format do:

Prepare the archive of all the files you want to copy with tar on Host A:

[root@Machine1 ~]:#  tar -czvf /bin/whatever /usr/local/bin/htop /usr/local/bin/samhain /etc/hosts archived-binaries-and-configs.tar.gz

[root@Machine1 ~]:# uuencode archived-binaries-and-configs.tar.gz archived-binaries-and-configs.uu

Cat / Copy / paste the encoded content as usual to a file on Host B:

Then on Machine 2 decode:

[root@Machine2 ~]:# uuencode -c < archived-binaries-and-configs.tar.gz.uu


Conclusion


In this short method I've shown you a hack that is used often by script kiddies to copy over files between pwn3d machines, a method which however is very precious and useful for sysadmins like me who has to admin a paranoid secured servers that are placed in a very hard to access environments.

With the same method you can encode or decode not only binary file but also any standard input/output file content. base64 encoding is quite useful stuff to use also in bash scripts or perl where you want to have the script copy file in a plain text format . Datas are encoded and decoded to make the data transmission and storing process easier. You have to keep in mind always that Encoding and Decoding are not similar to encryption and decryption as encr. deprytion gives a special security layers to the encoded that. Encoded data can be easily revealed by decoding, so if you need to copy between the servers very sensitive data like SSL certificates Private RSA / DSA key, this command line utility tool better to be not used for sesitive data copying.