Posts Tagged ‘hipo’

How much memory users uses in GNU / Linux and FreeBSD – Commands and Scripts to find user memory usage on Linux

Tuesday, February 17th, 2015


how-much-memory-users-use-in-gnu-linux-freebsd-command-to-find-and-show-ascending-descending-usage-of-system-memory-tux-memory-logo


If you have to administrate a heterogenous network with Linux and FreeBSD or other UNIX like OSes you should sooner or later need for scripting purposes to have a way to list how much memory separate users take up on your system. Listing memory usage per user is very helpful for admins who manager free-shells or for companies where you have developers, developing software directly on the server via ssh. Being able to check which process eats up most memory is essential for every UNIX / Linux sysadmin, because often we as admins setup (daemons) on servers and we forgot about their existence, just to remember they exist 2 years later and see the server is crashing because of memory exhaustion. Tracking server bottlenecks where RAM memory and Swapping is the bottleneck is among the main swiss amry knives of admins. Checking which user occupies all server memory is among the routine tasks we're forced to do as admins, but because nowdays servers have a lot of memory and we put on servers often much more memory than ever will be used many admins forget to routinely track users / daemons memory consumption or even many probably doesn't know how.  Probably all are aware of the easiest wy to get list of all users memory in console non interactively with free command, e.g.:
 

free -m
             total       used       free     shared    buffers     cached
Mem:         32236      26226       6010          0        983       8430
-/+ buffers/cache:      16812      15424
Swap:        62959        234      62725


but unfortunately free command only shows overall situation with memory and doesn't divide memory usage by user

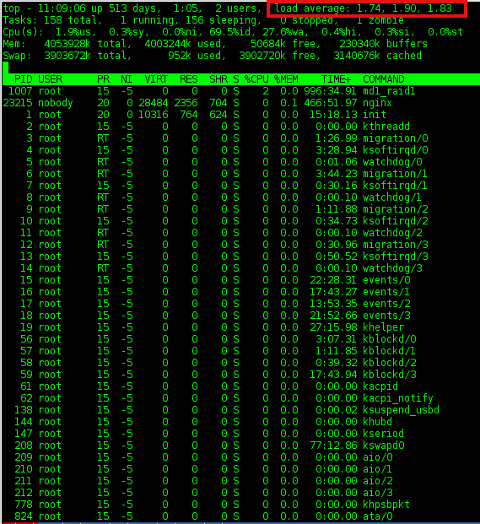
Thus probably to track memory users the only known way for most pepole is to (interactively) use good old top command or if you like modern (colorful) visualization with htop:

debian:~# top


linux-check_memory_usage_by_logged-in-user-with-top-process-command-gnu-linux-freebsd-screenshot

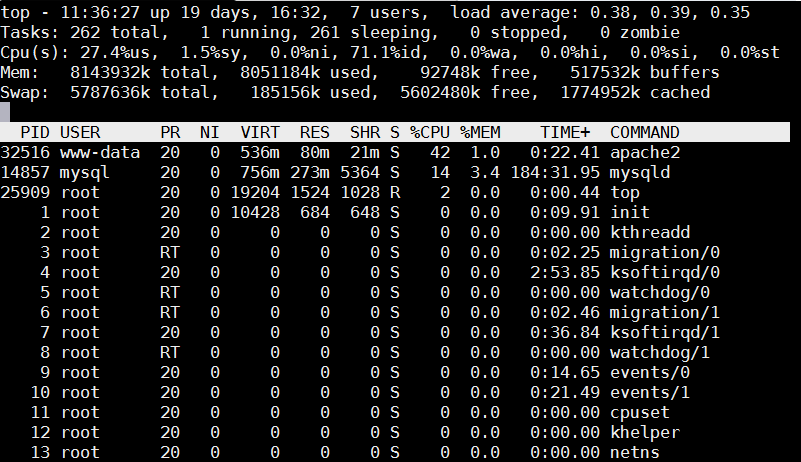
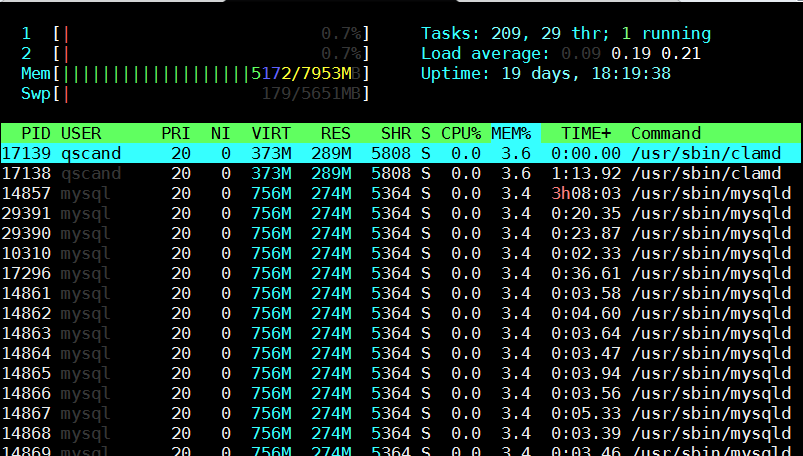
Once top runs interactive press 'm' to get ordered list of processes which occupy most system memory on Linux server.Top process use status statistics will refresh by default every '3.0' seconds to change that behavior to '1' second press  s and type '1.0'. To get Sort by Memory Use in htop also press 'm'
 

[root@mail-server ~]# htop


htop_show_users_memory_usage_order_ascending-gnu-linux-screenshot


However if you need to be involved in scripting and setting as a cron job tasks to be performed in case if high memroy consumption by a service you will need to use few lines of code. Below are few examples on how Linux user memory usage can be shown with ps cmd.

Probably the most universal way to see memory usage by users on Debian / Ubuntu / CentOS / RHEL and BSDs (FreeBSD / NetBSD) is with below one liner:


server:~# ps hax -o rss,user | awk '{a[$2]+=$1;}END{for(i in a)print i” “int(a[i]/1024+0.5);}' | sort -rnk2
daemon 0
debian-tor 63
dnscache 1
dnslog 0
hipo 21
messagebus 1
mysql 268
ntp 2
privoxy 1
proftpd 1
qmaill 0
qmailq 0
qmailr 0
qmails 0
qscand 291
root 94
shellinabox 1
snmp 1
statd 1
vpopmail 80
www-data 6765


Output is in MBs

Below is output from machine where this blog is running, the system runs ( Apache + PHP + MySQL Webserver + Qmail Mail server and Tor) on Debian GNU / Linux.

 To get more human readable (but obscure to type – useful for scripting) output list of which user takes how much memory use on deb / rpm etc. based Linux :


server:~# echo "USER                 RSS      PROCS" ; echo "——————– ——– —–" ; \
ps hax -o rss,user | awk '{rss[$2]+=$1;procs[$2]+=1;}END{for(user in rss) printf “%-20s %8.0f %5.0f\n”, user, rss[user]/1024, procs[user];}' | sort -rnk2


USER                 RSS      PROCS
——————– ——– —–
www-data                 6918   100
qscand                    291     2
mysql                     273     1
root                       95   120
vpopmail                   81     4
debian-tor                 63     1
hipo                       21    15
ntp                         2     1
statd                       1     1
snmp                        1     1
shellinabox                 1     2
proftpd                     1     1
privoxy                     1     1
messagebus                  1     1
dnscache                    1     1
qmails                      0     2
qmailr                      0     1
qmailq                      0     2
qmaill                      0     4
dnslog                      0     1
daemon                      0     2


It is possible to get the list of memory usage listed in percentage proportion, with a tiny for bash loop and some awk + process list command
 

TOTAL=$(free | awk '/Mem:/ { print $2 }')
for USER in $(ps haux | awk '{print $1}' | sort -u)
do
    ps hux -U $USER | awk -v user=$USER -v total=$TOTAL '{ sum += $6 } END { printf "%s %.2f\n", user, sum / total * 100; }'
done

107 1.34
115 2.10
119 1.34
daemon 1.32
dnscache 1.34
dnslog 1.32
hipo 1.59
mysql 4.79
ntp 1.34
privoxy 1.33
proftpd 1.32
qmaill 1.33
qmailq 1.33
qmailr 1.32
qmails 1.33
qscand 4.98
root 1.33
snmp 1.33
statd 1.33
vpopmail 2.35
www-data 86.48

Also a raw script which can be easily extended to give you some custom information on memory use by user list_memory_use_by_user.sh is here.
You can also want to debug further how much memory a certain users (lets say user mysql and my username hipo) is allocating, this can easily be achieved ps like so:
 

root@pcfreak:~# ps -o size,pid,user,command -u mysql –sort -size
 SIZE   PID USER     COMMAND
796924 14857 mysql   /usr/sbin/mysqld –basedir=/usr –datadir=/var/lib/mysql –plugin-dir=/usr/lib/mysql/plugin –user=mysql –pid-file=/var/run/mysqld/mysqld.pid –socket=/var/run/mysqld/mysqld.sock –port=3306


root@pcfreak~# ps -o size,pid,user,command -u hipo –sort -size|less
 SIZE   PID USER     COMMAND
13408 19063 hipo     irssi
 3168 19020 hipo     SCREEN
 2940  2490 hipo     -bash
 1844 19021 hipo     /bin/bash
 1844 19028 hipo     /bin/bash
 1844 19035 hipo     /bin/bash
 1844 19042 hipo     /bin/bash
 1844 19491 hipo     /bin/bash
 1844 22952 hipo     /bin/bash
  744  2487 hipo     sshd: hipo@pts/0
  744  2516 hipo     sshd: hipo@notty
  524  2519 hipo     screen -r
  412  2518 hipo     /usr/lib/openssh/sftp-server

You see from below output user running with www-data (this is Apache Webserver user in Debian) is eating 86.48% of overall system memory and MySQL server user is using only 4.79% of available memory

Output is shown in Megabytes per username memory usage, and user memory usage is ordered (stepping-down / descentive) from top to bottom

Getting more thoroughful and easier to read reporting without beeing a 31337 bash coder you can install and use on Linux smem – memory reporting tool .

SMEM can provide you with following memory info:

  • system overview listing
  • listings by process, mapping, user
  • filtering by process, mapping, or user
  • configurable columns from multiple data sources
  • configurable output units and percentages
  • configurable headers and totals
  • reading live data from /proc
  • reading data snapshots from directory mirrors or compressed tarballs
  • lightweight capture tool for embedded systems
  • built-in chart generation


Installing smem on Debian 6 / 7 / Ubuntu 14.04 / Turnkey Linux etc. servers is done with standard:


debian:~# apt-get install –yes smem
….


To install smem on CentOS 6 / 7:


[root@centos ~ ]# yum -y install smem
….


On Slackware and other Linux-es where smem is not available as a package you can install it easily from binary archive with:


cd /tmp/
wget http://www.selenic.com/smem/download/smem-1.3.tar.gz
tar xvf smem-1.3.tar.gz
sudo cp /tmp/smem-1.3/smem /usr/local/bin/
sudo chmod +x /usr/local/bin/smem


Two most common smem uses are:


root@mail:~# smem -u
User     Count     Swap      USS      PSS      RSS
dnslog       1       44       48       54      148
qmaill       4      232      124      145      464
hipo        11    13552     8596     9171    13160
qscand       2     4500   295336   295602   297508
root       188   217312  4521080  4568699  7712776


Below command shows (-u – Report memory usage by user, -t – show totals, -k – show unix suffixes)

root@mail:~# smem -u -t -k
User     Count     Swap      USS      PSS      RSS
dnslog       1    44.0K    48.0K    54.0K   148.0K
qmaill       4   232.0K   124.0K   145.0K   464.0K
hipo        11    13.2M     8.4M     9.0M    12.9M
qscand       2     4.4M   288.4M   288.7M   290.5M
root       188   212.2M     4.3G     4.4G     7.4G
—————————————————
           206   230.1M     4.6G     4.6G     7.7G


To get users memory use by percentage with smem:
 

root@mail:~# smem -u -p
User     Count     Swap      USS      PSS      RSS
dnslog       1    0.00%    0.00%    0.00%    0.00%
qmaill       4    0.00%    0.00%    0.00%    0.01%
hipo        11    0.17%    0.11%    0.11%    0.16%
qscand       2    0.05%    3.63%    3.63%    3.66%
root       194    2.64%   56.18%   56.77%   95.56%

It is also useful sometimes when you want to debug system overloads caused by external hardware drivers loaded into kernel causing issues to get list of system wide memory use sorted by user


 root@mail:~# smem -w -p
Area                           Used      Cache   Noncache
firmware/hardware             0.00%      0.00%      0.00%
kernel image                  0.00%      0.00%      0.00%
kernel dynamic memory        38.30%     36.01%      2.28%
userspace memory             60.50%      0.98%     59.53%
free memory                   1.20%      1.20%      0.00%


smem is very nice as if you're running it on a Desktop Linux system with Xserver installed you can see also graphical output of memory use by application:
 

root@desktop-pc:~# smem –bar pid -c "pss uss"


smem_graphical_representation-of-which-user-application-is-consuming-most-memory-gnu-linux-kde-screenshot-smem-command-line-tool

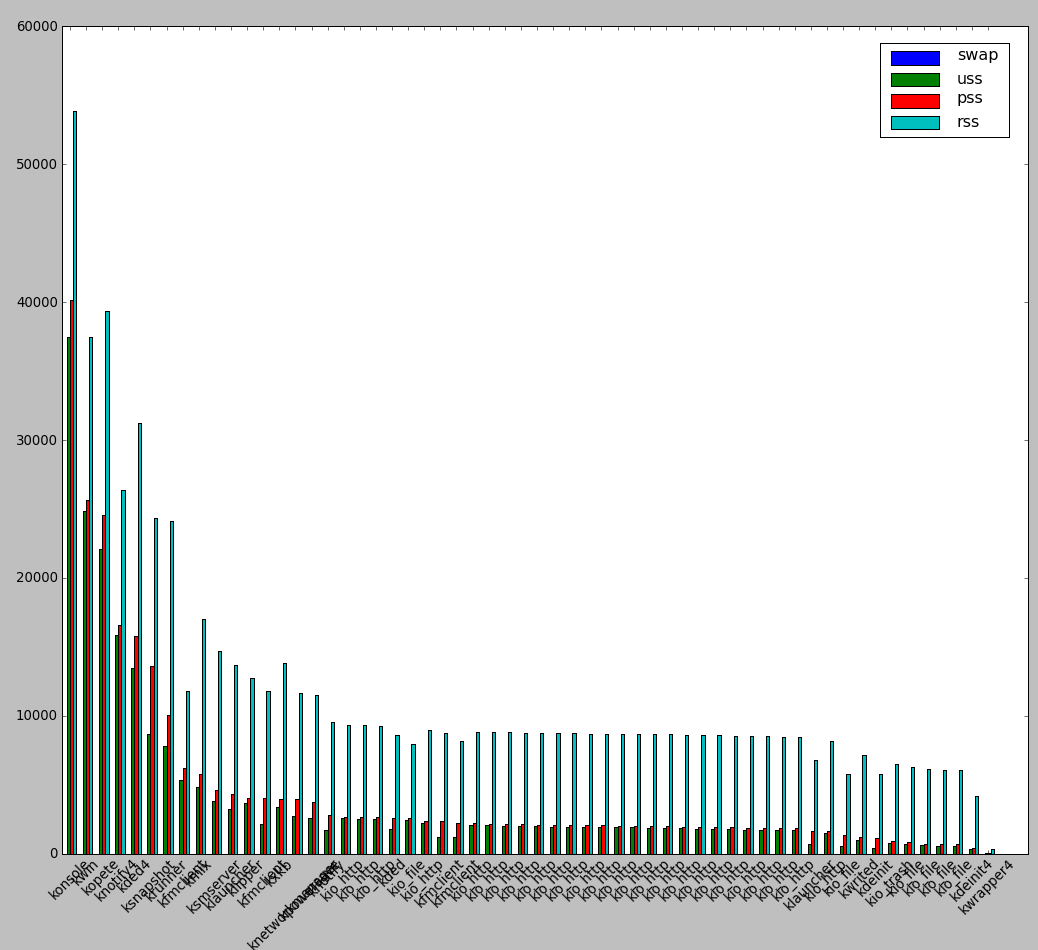
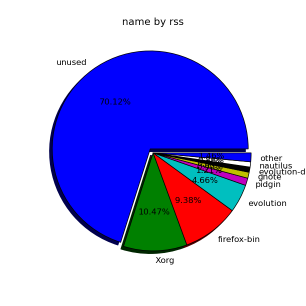
smem can even generate graphical pie charts to visualize better memory use
 

root@desktop-pc:~# smem -P '^k' –pie=name


generate-graphical-staticstics-linux-memory-use-by-pie-chart

If there is a high percentage shown in firmware/hardware this means some buggy module is loaded in kernel eating up memory, to fix it debug further and remove the problematic module.
userspace memory actually shows the percantage of memory out of all server available RAM that is being consumed by applications (non kernel and other system processes which make the system move). You see in above example the kernel itself is consuming about 40% of system overall available memory. 

We all know the SWAP field stands for hard disk drive used as a memory when system is out, but there are 3 fields which smem will report which will be probably unclear for most here is also explanation on what USS / PSS / RSS means?

RSS is the Resident Set Size and is used to show how much memory is allocated to that process and is in RAM. It does not include memory that is swapped out. It does include memory from shared libraries as long as the pages from those libraries are actually in memory. It does include all stack and heap memory too.

There is also PSS (proportional set size). This is a newer measure which tracks the shared memory as a proportion used by the current process. So if there were two processes using the same shared library from before.

USS stands for Unique set size, USS is just the unshared page count, i.e. memory returned when process is killed 

PSS = Proportional set size, (PSS),  is a more meaningful representation of the amount of memory used by libraries and applications in a virtual memory system.  
Because large portions of physical memory are typically shared among multiple applications, the standard measure of memory usage known as resident set size (RSS) will significantly overestimate memory usage. The parameter PSS instead measures each application’s “fair share” of each shared area to give a realistic measure. For most admins checking out the output from RSS (output) should be enough, it will indicate which user and therefore which daemon is eating up all your memory and will help you to catch problematic services which are cause your server to run out of RAM and start swapping to disk.

Fun with Apache / Nginx Webserver log – Visualize webserver access log in real time

Friday, July 18th, 2014

visualize-graphically-web-server-access-log-logstalgia-nginx-apache-log-visualize-in-gnu-linux-and-windows
If you're working in a hosting company and looking for a graphical way to Visualize access to your Linux webservers – (Apache, Nginx, Lighttpd) you will be happy to learn about Logstalgia's existence. Logstalgia is very useful if you need to convince your Boss / company clients that the webservers are exceeding the CPU / Memory hardware limits physically servers can handle. Even if you don't have to convince anyone of anything logstalgia is cool to run if you want to impress a friend and show off your 1337 4Dm!N Sk!11Z 🙂 Nostalgia is much more pleasent way to keep an eye on your Webserver log files in real time better than (tail -f)

The graphical output of nostalgia is a pong-like battle game between webserver and never ending chain of web requests.

This is the official website description of Logstalgia:
 

Logstalgia is a website traffic visualization that replays web-server access logs as a pong-like battle between the web server and an never ending torrent of requests. Requests appear as colored balls (the same color as the host) which travel across the screen to arrive at the requested location. Successful requests are hit by the paddle while unsuccessful ones (eg 404 – File Not Found) are missed and pass through. The paths of requests are summarized within the available space by identifying common path prefixes. Related paths are grouped together under headings. For instance, by default paths ending in png, gif or jpg are grouped under the heading Images. Paths that don’t match any of the specified groups are lumped together under a Miscellaneous section.


To install Logstalgia on Debian / Ubuntu Linux there is a native package, so to install it run the usual:

apt-get --yes install logstalgia

Reading package lists... Done
Building dependency tree
Reading state information... Done
The following NEW packages will be installed:
logstalgia
0 upgraded, 1 newly installed, 0 to remove and 4 not upgraded.
Need to get 161 kB of archives.
After this operation, 1,102 kB of additional disk space will be used.
Get:1 http://mirrors.kernel.org/debian/ stable/main logstalgia amd64 1.0.0-1+b1 [161 kB]
Fetched 161 kB in 2s (73.9 kB/s)
Selecting previously deselected package logstalgia.
(Reading database ... 338532 files and directories currently installed.)
Unpacking logstalgia (from .../logstalgia_1.0.0-1+b1_amd64.deb) ...
Processing triggers for man-db ...
Setting up logstalgia (1.0.0-1+b1) ...


Logstalgia is easily installable from source code on non-Debian Linux distributions too, to install it on any non-debian Linux distrubution do:

cd /usr/local/src/ wget https://logstalgia.googlecode.com/files/logstalgia-1.0.5.tar.gz
 

–2014-07-18 13:53:23–  https://logstalgia.googlecode.com/files/logstalgia-1.0.3.tar.gz
Resolving logstalgia.googlecode.com… 74.125.206.82, 2a00:1450:400c:c04::52
Connecting to logstalgia.googlecode.com|74.125.206.82|:443… connected.
HTTP request sent, awaiting response… 200 OK
Length: 841822 (822K) [application/x-gzip]
Saving to: `logstalgia-1.0.3.tar.gz'

100%[=================================>] 841,822     1.25M/s   in 0.6s

2014-07-18 13:53:24 (1.25 MB/s) – `logstalgia-1.0.3.tar.gz' saved [841822/841822]

Untar the archive with:
 

tar -zxvf logstalgia-1.0.5.tar.gz

Compile and install it:

cd logstalgia
./configure
make
make install


How to use LogStalgia?

Syntax is pretty straight forward just pass the Nginx / Apache

Process Debian Linux Apache logs:

logstalgia /var/log/apache2/access.log


Process CentoS, Redhat etc. RPM based logs:

logstalgia /var/log/httpd/access.log
To process webserver log in real time with logstalgia:

tail -f /var/log/httpd/access_log | logstalgia -

To make logstalgia visualize log output you will need to have access to server physical console screen. As physical access is not possible on most dedicated servers – already colocated in some Datacenter. You can also use a local Linux PC / notebook installed with nostalgia to process webserver access logs remotely like so:

logstalgia-visualize-your-apache-nginx-lighttpd-logs-graphically-in-x-and-console-locally-and-remotely

ssh hipo@www.pc-freak.net tail -f /var/log/apache2/access.log | logstalgia --sync

Note! If you get an empty output from logstalgia, this is because of permission issues, in this example my user hipo is added in www-data Apache group – if you want to add your user to have access like me, issue on remote ssh server):
 

addgroup hipo www-data


Alterantively you can login with ssh with root, e.g. ssh root@www.pc-freak.net

If you're having a GNOME / KDE X environment on the Linux machine from which you're ssh-ing Logstalgia will visualize Webserver access.log requests inside a new X Window otherwise if you're on a Linux with just a console with no Xserver graphics it will visualize graphically web log statistics using console svgalib .


If you're planning to save output from nostalgia visualization screen for later use – lets say you have to present to your CEO statistics about all your servers  Webservers logs you can save nostalgia produced video in .ppm (netpbm) format.

Whether you have physical console access to the server:

logstalgia -1280x720 --output-ppm-stream output.ppm /var/log/httpd/access.log

Or if you just a have a PC with Linux and you want to save visualized content of access.log remotely:

ssh hipo@www.pc-freak.net tail -f /var/log/nginx/pc-freak-access.log | logstalgia -1280x720 --output-ppm-stream --sync output.ppm


ssh user@server1.cyberciti.biz tail -f /var/log/nginx/www.cyberciti.biz_access.log | logstalgia -1280x720 --output-ppm-stream --sync output.ppm

To make produced .ppm later usable you can use ffmpeg to convert to .mp4:

ffmpeg -y -r 60 -f image2pipe -vcodec ppm -i output.ppm -vcodec libx264 -preset ultrafast -pix_fmt yuv420p -crf 1 -threads 0 -bf 0 nginx.server.log.mp4

Then to play the videos use any video player, I usually use vlc and mplayer.

For complete info on Nostalgia – website access log visualizercheck home page on googlecode

If you're lazy to install Logstalgia, here is Youtube video made from its output:

Enjoy 🙂

Text Monitoring of connection server (traffic RX / TX) business in ASCII graphs with speedometer / Easy Monitor network traffic performance

Friday, May 4th, 2012

While reading some posts online related to MS-Windows TcpViewnetwork traffic analyzing tool. I've came across very nice tool for tracking connection speed for Linux (Speedometer). If I have to compare it, speedometer is somehow similar to nethogs and iftop bandwidth network measuring utilities .

What differentiates speedometer from iftop / nethogs / iptraf is it is more suitable for visualizing a network file or data transfers.
The graphs speedometer draws are way easier to understand, than iftop graphs.

Even complete newbies can understand it with no need for extraordinary knowledge in networking. This makes Speedometer, a top tool to visually see the amount of traffic flowing through server network interface (eth0) … (eth1) etc.

What speedometer shows is similar to the Midnight Commander's (mc) file transfer status bar, except the statistics are not only for a certain file transfer but can show overall statistics over server passing network traffic amount (though according to its manual it can be used to also track individual file transfers).

The simplicity for basic use makes speedometer nice tool to track for network congestion issues on Linux. Therefore it is a  must have outfit for every server admin. Below you see a screenshot of my terminal running speedometer on a remote server.

Speedometer ascii traffic track server network business screenshot in byobu screen like virtual terminal emulator

1. Installing speedometer on Debian / Ubuntu and Debian derivatives

For Debian and Ubuntu server administrators speedometer is already packaged as a deb so its installation is as simple as:

debian:~# apt-get --yes install speedometer
....

2. Installing speedometer from source for other Linux distributions CentOS, Fedora, SuSE etc.

Speedometer is written in python programming language, so in order to install and use on other OS Linux platforms, it is necessery to have installed (preferably) an up2date python programming language interpreter (python ver. 2.6 or higher)..
Besides that it is necessary to have installed the urwid -( console user interface library for Python) available for download via excess.org/urwid/


Hence to install speedometer on RedHat based Linux distributions one has to follow these steps:

a) Download & Install python urwid library

[root@centos ~]# cd /usr/local/src
[root@centos src]# wget -q http://excess.org/urwid/urwid-1.0.1.tar.gz
[root@centos src]# tar -zxvvf urwid-1.0.1.tar.gz
....
[root@centos src]# cd urwid-1.0.1
[root@centos urwid-1.0.1]# python setup.py install
running install
running build
running build_py
creating build
creating build/lib.linux-i686-2.4
creating build/lib.linux-i686-2.4/urwid
copying urwid/tests.py -> build/lib.linux-i686-2.4/urwid
copying urwid/command_map.py -> build/lib.linux-i686-2.4/urwid
copying urwid/graphics.py -> build/lib.linux-i686-2.4/urwid
copying urwid/vterm_test.py -> build/lib.linux-i686-2.4/urwid
copying urwid/curses_display.py -> build/lib.linux-i686-2.4/urwid
copying urwid/display_common.py -> build/lib.linux-i686-2.4/urwid
....

b) Download and install python-setuptools

python-setuptools is one other requirement of speedometer, happily on CentOS and Fedora the rpm package is already there and installable with yum:

[root@centos ~]# yum -y install python-setuptools
....

c) Download and install Speedometer

[root@centos urwid-1.0.1]# cd /usr/local/src/
[root@centos src]# wget -q http://excess.org/speedometer/speedometer-2.8.tar.gz
[root@centos src]# tar -zxvvf speedometer-2.8.tar.gz
.....
[root@centos src]# cd speedometer-2.8
[root@centos speedometer-2.8]# python setup.py install
Traceback (most recent call last):
File "setup.py", line 26, in ?
import speedometer
File "/usr/local/src/speedometer-2.8/speedometer.py", line 112
n = n * granularity + (granularity if r else 0)
^

While running the CentOS 5.6 installation of speedometer-2.8, I hit the
"n = n * granularity + (granularity if r else 0)
error.

After consultation with some people in #python (irc.freenode.net), I've figured out this error is caused due the outdated version of python interpreter installed by default on CentOS Linux 5.6. On CentOS 5.6 the python version is:

[root@centos ~]# python -V
Python 2.4.3

As I priorly said speedometer 2.8's minimum requirement for a python to be at v. 2.6. Happily there is quick way to update python 2.4 to python 2.6 on CentOS 5.6, as there is an RPM repository maintained by Chris Lea which contains RPM binary of python 2.6.

To update python 2.4 to python 2.6:

[root@centos speedometer-2.8]# rpm -Uvh http://yum.chrislea.com/centos/5/i386/chl-release-5-3.noarch.rpm[root@centos speedometer-2.8]# rpm --import /etc/pki/rpm-gpg/RPM-GPG-KEY-CHL[root@centos speedometer-2.8]# yum install python26

Now the newly installed python 2.6 is executable under the binary name python26, hence to install speedometer:

[root@centos speedometer-2.8]# python26 setup.py install
[root@centos speedometer-2.8]# chown root:root /usr/local/bin/speedometer
[root@centos speedometer-2.8]# chmod +x /usr/local/bin/speedometer

[root@centos speedometer-2.8]# python26 speedometer -i 1 -tx eth0

The -i will instruct speedometer to refresh the screen graphs once a second.

3. Using speedometer to keep an eye on send / received traffic network congestion

To observe, the amount of only sent traffic via a network interface eth0 with speedometer use:

debian:~# speedometer -tx eth0

To only keep an eye on received traffic through eth0 use:

debian:~# speedometer -rx eth0

To watch over both TX and RX (Transmitted and Received) network traffic:

debian:~# speedometer -tx eth0 -rx eth0

If you want to watch in separate windows TX and RX traffic while  running speedometer you can run in separate xterm windows speedometer -tx eth0 and speedometer -rx eth0, like in below screenshot:

Monitor Received and Transmitted server Network traffic in two separate xterm windows with speedometer ascii graphs

4. Using speedometer to test network maximum possible transfer speed between server (host A) and server (host B)

The speedometer manual suggests few examples one of which is:

How fast is this LAN?

host-a$ cat /dev/zero | nc -l -p 12345
host-b$ nc host-a 12345 > /dev/null
host-b$ speedometer -rx eth0

When I red this example in speedometer's manual, it wasn't completely clear to me what the author really meant, but a bit after when I thought over the example I got his point.

The idea behind this example is that a constant stream of zeros taken from /dev/zero will be streamed over via a pipe (|) to nc which will bind a port number 12345, anyone connecting from another host machine, lets say a server with host host-b to port 12345 on machine host-a will start receiving the /dev/zero streamed content.

Then to finally measure the streamed traffic between host-a and host-b machines a speedometer is started to visualize the received traffic on network interface eth0, thus measuring the amount of traffic flowing from host-a to host-b

I give a try to the exmpls, using for 2 test nodes my home Desktop PC, Linux running  arcane version of Ubuntu and my Debian Linux notebook.

First on the Ubuntu PC I issued
 

hipo@hip0-desktop:~$ cat /dev/zero | nc -l -p 12345
 

Note that I have previously had installed the netcat, as nc is not installed by default on Ubuntu and Debian. If you, don't have nc installed yet, install it with:

apt-get –yes install netcat

"cat /dev/zero | nc -l -p 12345" will not produce any output, but will display just a blank line.

Then on my notebook I ran the second command example, given in the speedometer manual:
 

hipo@noah:~$ nc 192.168.0.2 12345 > /dev/null

Here the 192.168.0.2 is actually the local network IP address of my Desktop PC. My Desktop PC is connected via a normal 100Mbit switch to my routing machine and receives its internet via  NAT. The second test machine (my laptop), gets its internet through a WI-FI connection received by a Wireless Router connected via a UTP cable to the same switch to which my Desktop PC is connected.

Finally to test / get my network maximum thoroughput I had to use:

hipo@noah:~$ speedometer -rx wlan0

Here, I  monitor my wlan0 interface, as this is my (laptop) wireless card interface over which I have connectivity to my local network and via which through the the WI-FI router I get connected to the internet.

Below is a snapshot captured showing approximately what is the max network thoroughput from:

Desktop PC -> to my Thinkpad R61 laptop

Using Speedometer to test network thorougput between two network server hosts screenshot Debian Squeeze Linux

As you can see in the shot approximately the maximum network thoroughput is in between:
2.55MB/s min and 2.59MB/S max, the speed is quite low for a 100 MBit local network, but this is normal as most laptop wireless adapters hardly transfer traffic in more than 10 to 20 MBits per sec.

If the same nework thoroughput test is conducted between two machines both connected to a same 100 M/bit switch, the traffic should be at least a 8 MB/sec.

There is something, else to take in consideration that probably makes the provided example network thoroughput measuring a bit inaccurate. The fact that the /dev/zero content is stremed over is slowing down the zeroes sent over network because of the  pipe ( | ) use slows down the stream.

5. Using speedometer to visualize maximum writting speed to a local hard drive on Linux

In the speedometer manual, I've noticed another interesting application of this nifty tool.

speedometer can be used to track and visualize the maximum writing speed a hard disk drive or hard drive partition can support on Linux OS:

A copy paster from the manual text is as follows:

How fast can I write data to my filesystem? (with at least 1GB free)
dd bs=1000000 count=1000 if=/dev/zero of=bigfile &
speedometer bigfile

However, when I tried copy/pasting the example in terminal, to test the maximum writing speed to an external USB hard drive, only dd command was started and speedometer failed to initialize and display graphs of the file creation speed.

I've found a little "hack" that makes the man example work by adding a 3 secs sleep like so:

debian:/media/Expansion Drive# dd bs=1000000 count=1000 if=/dev/zero of=bigfile & sleep 3; speedometer bigfile

Here is a screenshot of the bigfile created by dd and tracked "in real time" by speedometer:

How fast is writting data to local USB expandable hard disk Debian Linux speedometer screenshot

Actually the returned results from this external USB drive are, quite high, the possible reason for that is it is connected to my laptop over an USB protocol verion 3.

6. Using Speedometer to keep an eye on file download in progress

This application of speedometer is mostly useless especially on Linux where it is used as a Desktop.

However in some occasions if files are transferred over ssh or in non interactive FTP / Samba file transfers between Linux servers it can come handy.

To visualize the download and writing speed of lets say FTP transferred .AVI movie (during the actual file transfer) on the download host issue:

# speedometer Download-Folder/What-goes-around-comes-around.avi

7. Estimating approximate time for file transfer

There is another section in the speedometer manual pointing of the program use to calculate the time remaining for a file transfer.

The (man speedometer) provided example text is:

How long it will take for my 38MB transfer to finish?
speedometer favorite_episode.rm $((38*1024*1024))

At first glimpse it hard to understand (like the other manual example). A bit of reasoning and I comprehend what the man author meant by the obscure calculation:

$((38*1024*1024))

This is a formula used in which 38 has to be substituted with the exact file size amount of the transferred file. The author manual used a 38MB file so this is why he put $((38* … in the formula.

I give it a try – (just for the sake to see how it works) with a file with a size of 2500MB, in below two screenshot pictures I show my preparation to copy the file and the actual copying / "real time" transfer tracking with speedometer's status percentage completion bar.

xterm terminal copy file and estimate file copying operation speed on linux with speedometer preparation

Two xterm terminals one is copying a file the other one uses speedometer to estimate the time remaining to complete the file transfer from expansion USB hard drive to my laptop harddrive


How to disable Debian GNU / Linux (Squeeze) Apache 2 version reporting to improve security – Hide Apache server version

Friday, October 5th, 2012

Debian GNU / Linux's Apache default behavior is to report Apache server name, version and Linux distribution version and codename.
This is shown as a minor security leak in many Security Scanner (audit) software like Nessus. It reveals a vital information which could help malicious attacker later to use exploit if the version number in question is vulnerable.

The quickest way to check, either Apache versioning and distro info is disabled is with telnet:

hipo@noah:~/Desktop$ telnet www.pc-freak.net 80
Trying 83.228.93.76…
Connected to www.pc-freak.net.
Escape character is '^]'.
HEAD / HTTP/1.0

Connection closed by foreign host.
hipo@noah:~/Desktop$ telnet www.pc-freak.net 80
Trying 83.228.93.76…
Connected to www.pc-freak.net.
Escape character is '^]'.
HEAD / HTTP/1.0

HTTP/1.1 200 OK
Date: Fri, 05 Oct 2012 10:48:36 GMT
Server: Apache/2.2.16 (Debian)
X-Powered-By: PHP/5.3.3-7+squeeze14
Vary: Accept-Encoding
Connection: close
Content-Type: text/html

Disabling this Distro version codename and version number reporting on Debian is done by changing in file /etc/apache2/conf.d/security directives:


ServerTokens OS
ServerSignature On

to


ServerSignature Off
ServerTokens ProductOnly

Here important note to make is if you try adding:

ServerSignature Off and ServerTokens Prod straight in Debian general config /etc/apache2/apache2.conf, but did not change the settings set for the vars through /etc/apache2/conf.d/security; settings from /etc/apache2/conf.d/security will overwrite ServerSignature / ServerTokens settings set in /etc/apache2/apache2.conf

I tried this myself (forgotting about /etc/apache2/conf.d/security) and adding both variables straight in apache2.conf. After Apache restart Apache version number and type of distribution continued be returned by the WebServer.
I thought something specific changed in Debian Squeeze – Apache/2.2.16 so this two variables are probably not working so I did a quick research online seing other people complaining also unable to disable Apache ver and Linux distro version and looking for a reason why. Well anyways if you happen to also ponder, why ServerSignature Off and ServerTokens ProductOnly does not take effect keep in mind it is due to overwritten settings via /etc/apache2/conf.d/security, changing the values there and restarting Apache and you're done 🙂

To make sure 100% Apache is no longer returning exact version number and host installed distro type, use telnet again:

hipo@noah:~/Desktop$ telnet www.pc-freak.net 80
Trying 83.228.93.76…
Connected to www.pc-freak.net.
Escape character is '^]'.
HEAD / HTTP/1.0

Connection closed by foreign host.

How to test if imap and pop mail server service is working with Telnet cmd

Monday, August 8th, 2011

test-if-imap-pop3-is-working-with-telnet-command-logo-imap
I’ve recently built new mail qmail server with vpopmail to serve pop3 connectins and courierimap and courierimaps to take care for IMAP IMAPS.

I further used telnet to test if the Linux server pop3 service on (110) and imap on (143) worked fine, straight after the completed qmail install.
Here is how to test mail server with vpopmail listening for connections on pop3 port :

debian:~# telnet mail.mymailserver.com 110
Trying 111.222.333.444...
Connected to mail.mymailserver.com.
Escape character is '^]'.
+OK <2813.1312745988@mymailserver.com>
USER hipo@mymailserver.com
+OK
PASS here_goes_my_secret_pass
+OK
LIST
1 309783
2 64053
3 2119
4 64357
5 317893
RETR 1
My first mail content retrieved with RETR commandgoes here ....
quit
+OK
Connection closed by foreign host.

You see I have 5 messages in my mailbox, as you can see I used RETR command to check the content of my mail, this is handy as I can read my mails straight with telnet (if the mail is in plain text), of course it’s a bit more complicated if I have to read encrypted or html mail, though still its easy to write a tiny parser and pipe the content produced by telnet command to lynx or some other text based browser.

Now another sys admin handy tip is the use of telnet to check my mail servers IMAP servers is correctly operating.
Here is how:

debian:~# telnet mail.mymailserver.com 143
Trying 111.222.333.444...
Connected to localhost.
Escape character is '^]'.
* OK [CAPABILITY IMAP4rev1 UIDPLUS CHILDREN NAMESPACE THREAD=ORDEREDSUBJECT THREAD=REFERENCES SORT QUOTA IDLE ACL ACL2=UNION STARTTLS] Courier-IMAP ready. Copyright 1998-2010 Double Precision, Inc. See COPYING for distribution information.
01 LOGIN hipo@mymailserver.com here_goes_my_secret_pass
A OK LOGIN Ok.
02 LIST "" *
* LIST (Unmarked HasNoChildren) "." "INBOX"
02 OK LIST completed
03 SELECT INBOX
* FLAGS (Draft Answered Flagged Deleted Seen Recent)
* OK [PERMANENTFLAGS (* Draft Answered Flagged Deleted Seen)] Limited
* 5 EXISTS
* 5 RECENT
* OK [UIDVALIDITY 1312746907] Ok
* OK [MYRIGHTS "acdilrsw"] ACL
03 OK [READ-WRITE] Ok
04 STATUS INBOX (MESSAGES)
* STATUS "INBOX" (MESSAGES 5)
04 OK STATUS Completed.
05 FETCH 1 ALL
...
06 FETCH 1 BODY
...
07 FETCH 1 ENVELOPE
...
As you can see according to standard to send commands to IMAP server from console after a telnet connection you will have to always include a command line number like 01, 02, 03 .. etc.

Using such a line numbering is not obligitory and also letters like A, B, C could be use still line numbering with numbers is generally a good idea since it’s easier for reading on the screen.

Now line 02 shows you available mailboxes, line 03 SELECT INBOX selects the imap Inbox to be further operated with, 04 STATUS INBOX cmd displays status about current mailboxes in folder.
FETCH 1 ALL instructs the imap server to get list of all IMAP message headers. Next command in line 05 FETCH 1 BODY will display the message body of the first message in list.
The 07 FETCH 1 ENVELOPE will display the mail headers for the 1 message.

Few other IMAP commands which might be helpfun on connection are:

08 FETCH 1 FULL
09 FETCH * FULL

First one would fetch complete content of a message numbered one from the imap server and the second one 09 FETCH * FULL will get all the mail content for all messages located on the remote IMAP server.

The STATUS command aforementioned earlier could take the following list of arguments:

MESSAGES, UNSEEN, RECENT UIDNEXT UIDVALIDITY

These commands are a gold mine for me as a sysadmin as it helps quickly solve problems, hope they would help to somebody out there as well 😉
This way is a way shorter than bothering each time to check, if some customer e-mail account is improperly configured by creating setting up a new account in Thunderbird.
 

Linux: Understanding uptime command Load Avarage statistics / When load avarage is high?

Wednesday, May 8th, 2013

GNU / Linux load avarage explained load avarage from top command

There is probably no Linux system administrator who, don't have idea about system  Load Avarage. Most of admins however does have some brought idea about what kind of load avarage is critical but doesn't have good understanding on the 3 digits returned as a load avarage i.e. – load average: 2.47, 2.27, 2.02 shown in above ascii graphs ( generated by tload command).
 

What is Load Avarage ?

  •  The number of blocking processes in the run queue averaged over a certain time period.

A blocking process is a process that is waiting for something to continue. Typically, a process is waiting to use:
 

  •  CPU Time,  Disk Input / Output oper. or Network I / O

Thus logically the higher the Load Avarage, the more processes has to wait for access to CPU, HDD and Network I/O.

The most two common commands used where load avarage appear are;
 

w – who

and

uptime

mx:/home/hipo# w
 11:07:56 up 513 days,  1:04,  1 user,  load average: 1.92, 1.95, 1.84
USER     TTY      FROM              LOGIN@   IDLE   JCPU   PCPU WHAT
hipo     pts/0    www.pc-freak.net     Thu19    0.00s  0.06s  0.02s sshd: hipo [priv]

mail:/home/hipo# uptime
 11:03:59 up 513 days,  1:00,  2 users,  load average: 2.11, 1.91, 1.81

Other common place to check load avarage is in top cmd:

mail:/home/hipo# top

Linux top command load avarage showing server system load 3 digits of load avarage explained

a) Optimum machine use – Load Avarage 1 

So what does load avarage: 1.74, 1.90, 1.83 really means? The 3 digits are showing system load avarage over the last 1, 5 and 15 minutes time. Meaning;


– before 1 minute system had a load of 1.74
– 5 minutes before it was 1.90
– and 15 minutes back 1.83

Usually Load Avarage of more than 1 is considered critical. If a system is working with a load avarage of 1 this means the system is working capacity. In best cases in terms of optimizing processes on server with hardware it is good the system is working in load of 0.70 or 0.80. Whether a traffic the machine gets is planned in most cases a load avarage of exactly 1 means machine hardware is properly utilized. However whether the load avarage is hitting over 1 this usually means you have to think about moving server to new hardware. It is general rule of thumb that if system load is exceeeding 0.70 it is time to migrate to better hardware.

b) Load avarage on Multi-core / Multiprocessor servers

Load avarage of 4 on 4 CPU cores server hardware is optimum one. Each core / CPU on machine should get maximum of load avarage 1. Load avarage of 1 means CPU is utilized in 100%. Load avarage of 4 on 4 CPU server hardware means all 4 processors are working in their maximum power of 100%. For people who have multi processor server the best way to show utilization is by running htop. There all 4 CPUs will show idle of 0%.

Hence rule to calculate normal load avarage for server is;

1 Load Avarage per CPU. Therefore for 24 CPU Intel Xeon hardware. Load Avarage under 1*24.00 = 24.00 is considered normal. On such a server whether load avarage jumps to 50.00 / 70.00 or above server becomes totally irresponsive and it is very likely to hang because of over-heating. Even if it continues working it will work extremely slow and even simply operations like ssh to it will become hardly possible and sometimes even access via ssh will be not possible.

Therefore Rule of Thumb for calculating which load avarage is okay for a server is;

Number of CPU / Cores should not exceed digit returned in Load Avarage stats

c) Critical – Load avarage >5 – A sure sign for unresponsive or soon to hang server

On Computers with just 1 CPU, load avarage of 5 is sure sign running services will lag brutally and server will become inaccessible. For multicore / multiprocessor servers big troubles can be expected, whether load avarage is about  1/2 of the maximum number of of Load Avarage; (for 8 CPU Multicore hardware). A load avarage of 8 + ( 1/2 * 8 ) = 12 is sure sign system is stoned and running services inaccessible.

d) load avarage: 1.74, 1.90, 1.83 – Is 1 / 5 or 15 minutes LA numbers more important to consider?

All are important however 5 and 15 minutes load avg. give better indication on what's happening with machine as current load can peak for just a second to a higher number, being misleading.

To get number of CPU / Cores use cmd;

mail:/home/hipo# grep 'model name' /proc/cpuinfo | wc -l
24

For more precise info on CPU type and model use;

mail:/home/hipo# cat /proc/cpuinfo

processor       : 0
vendor_id       : GenuineIntel
cpu family      : 6
model           : 44
model name      : Intel(R) Xeon(R) CPU           E5645  @ 2.40GHz
stepping        : 2
cpu MHz         : 2400.094
cache size      : 12288 KB
physical id     : 0
siblings        : 12
core id         : 0
cpu cores       : 6
apicid          : 0
initial apicid  : 0
fpu             : yes
fpu_exception   : yes
cpuid level     : 11
wp              : yes
flags           : fpu vme de pse tsc msr pae mce cx8 apic sep mtrr pge mca cmov pat pse36 clflush dts acpi mmx fxsr sse sse2 ss ht tm pbe syscall nx pdpe1gb rdtscp lm constant_tsc arch_perfmon pebs bts rep_good xtopology nonstop_tsc aperfmperf pni dtes64 monitor ds_cpl vmx smx est tm2 ssse3 cx16 xtpr pdcm dca sse4_1 sse4_2 popcnt lahf_lm ida arat tpr_shadow vnmi flexpriority ept vpid
bogomips        : 4800.18
clflush size    : 64
cache_alignment : 64
address sizes   : 40 bits physical, 48 bits virtual
power management:
……
………
 

If you hit abnormal high load avarage, it is useful to check in top process list what is top process / processes causing highest system load. It is useful to run ps with following arguments

mail:/home/hipo# ps axuwwf

Look in STAT column. Processes in STAT have 3 states;

  • R – Running
  • S – Sleeping
  • D – Waiting for something

Usually processes with status of D – are ones causing problems. If you get D STAT-ed processes check further what's wrong with them and fix it. If there are none,  simply, number of clients using machine pop-ed up meaning you need to quickly move to better hardware host.

e) Getting notified via email whether load avarage exceeds certain value

A good way to get notified or do certain action like restarting Apache WebServer or other common process causing high loads is through monit. Monit is very usefukl for notifying on high load avarages or even better for Restarting processes imposing high loads.

You can always use a few liners shell script to mail to email or SMS2Email mailbox similar to this tiny shell script to restart apache on high load.There is also a Ruby lang tool – Scout to monitor and report high load avarages

Convert WAV to MP3 in command line with LAME on Linux

Friday, April 8th, 2011

I needed to convert a bunch of files from WAV to MP3 format on my Linux desktop.

I’ve placed all my wav files to the directory /home/hipo/wav

And then I issued the small one liner script to convert the .wav files to .mp3 using the niftly lame linux mp3 convertor.

Here is how I did it:

linux-desktop:~$ cd wav
linux-desktop:/home/hipo/wav$ for i in *.wav; do
new_name=$(echo $i |sed -e 's#wav#mp3#g');
lame -V0 -h -b 160 --vbr-new "$i" "$new_name";
done

After executing the little script you might go and have a coffee, if you have thousands of files, each file convertion takes about 10-15 seconds of time (speed depends on your CPU).

Here is some output from a lame convertion to mp3 taking place:

Encoding as 8 kHz single-ch MPEG-2.5 Layer III VBR(q=0)
Frame | CPU time/estim | REAL time/estim | play/CPU | ETA
27237/27237 (100%)| 0:12/ 0:12| 0:12/ 0:12| 155.89x| 0:00
64 [27237] ***************************************************************
----------------------------------------------
kbps mono % long switch short %
64.0 100.0 84.1 8.9 7.0
If you want to save my convertion quickly for a later, download my Convert WAV to mp3 from a directory with lame shell script here

Actually there are plenty of other ways to convert wav to mp3 on Linux through mplayer, ffmpeg even with mpg123.

There are also some GUI programs that could do the convertion like winff , however for some weird reason after installing WinFF on my debian it was not able to complete convertion to mp3?!
But it doesn’t matter, the good news is I did what I wanted to via the simple lame program and the above script, hope it helps somebody out there.

Enabling talkd (Console Chat) between logged in users on FreeBSD and other BSDs

Sunday, June 10th, 2012

Talk between two useres on FreeBSD 7.2 screenshot, console peer to peer interactive talk program UNIX, Linux, BSD

Those who are in familiar with older UNIXes, UNIX BSD derivatives and GNU Linux should certainly remember the times, when we hackers used to talk to each other using talk service.

Those who don't know what talk command is it is a simple console / ssh utility to talk to another logged in users.

Talk is very similar to write and mesg one liner messasing utilities available for *nixes, the difference is it is intendted to provide interactive chat between the two logged in users. People who came to know UNIX or free software in older times most likely don't know talk, however I still remember how precious this tool was for communication back in the day.

I believe still it can be useful so I dediced to install ot on one FreeBSD host.

In order to have the talk service running on BSD it is necessery to have /usr/libexec/ntalkd installed on the system this however is installed by default with standard BSD OS installs, so no need for any external ports install to run it.

talk doesn't have it's own init script to start is not written to run as it own service but in order to run it is is necessery to enable it via inetd

Enabling it is done by;;;

1 — Editting /etc/inetd.conf

Inside the conf the line::

#ntalk dgram udp wait tty:tty /usr/libexec/ntalkd ntalkd

should be uncommented e.g, become ;;;

ntalk dgram udp wait tty:tty /usr/libexec/ntalkd ntalkd

2 — Restart inetd

freebsd# /etc/rc.d/inetd restart
Stopping inetd.
Starting inetd.

talk is planned to be used for peer to peer conversations over SSH so in a way it is the GRANDFATHER 🙂 of IRC, ICQ and Skype;;;

Here is an example on how talk is used ,, Let's say there are three logged in users

pcfreak# w
12:39PM up 3 days, 16:25, 3 users, load averages: 1.12, 0.91, 0.71
USER TTY FROM LOGIN@ IDLE WHAT
testuser p0 192.168.0.7 10:50AM - bash
hipo p3 192.168.0.8 12:23PM - w
root p4 :ttyp2:S.0 12:24PM - vim /usr/local/www/dat

I'm logged in with my username hipo and I would like to talk to testuser ;;;;

pcfreak% tty
/dev/ttyp3

You see I'm logged in on /dev/ttyp3 (this is the specific naming on BSDs) on Linux equivalent is /dev/tty3So to talk the other user testuser;;;;;-

$ talk testuser ttyp0
[No connection yet]
[Waiting for your party to respond]

The testuser logged in via SSH will then get a message ||;

Message from Talk_Daemon@pcfreak at 12:44 on 2012/06/10 ...
talk: connection requested by hipo@localhost
talk: respond with: talk hipo@localhost

To enter a talk session then the logged in testuser has to type:

$ talk hipo@localhost


AEWAN – a nice advanced GNU / Linux console ASCII art text editor

Saturday, May 19th, 2012

I'm a guy fascinated by ASCII art, since the very early days I saw a piece of this awesome digital art.

As time passed and computers went to be used mostly  graphics resolution, ASCII art loose its huge popularity from the early DOS and BBS (internet primordial days).

However, this kind  of art is still higly valued by true computer geeks.
In that manner of thoughts, lately I'm researching widely on ASCII art tools and ASCII art open source tools available for Linux.
Last time I check what is available for 'ASCII job' was before 5 years time. Recently I decided to review once again and see if there are new software for doing ascii manipulations on Linux and this is how this article got born.

My attention was caught by aewan (ASCII-art Editor Without A Name), while searching for ASCII keyword description packages with:

apt-cache search ascii

Aewan project official website is on sourceforge check it out here

Here is the complete description of the Debian package:

hipo@noah:~$ apt-cache show aewan|grep -i description -A 5
Description: ASCII-art Editor Without A Name
aewan is an ASCII art editor with support for multiple layers that can be
edited individually, colors, rectangular copy and paste, and intelligent
horizontal and vertical flipping (converts '\' to '/', etc). It produces
both stand-alone art files and an easy-to-parse format for integration
into your terminal applications.

I installed it to give it a try:

noah:~# apt-get --yes install aewan
Selecting previously deselected package aewan.
(Reading database ... 388522 files and directories currently installed.)
Unpacking aewan (from .../aewan_1.0.01-3_amd64.deb) ...
Processing triggers for man-db ...
Setting up aewan (1.0.01-3) ...

aewan package provides three executable binaries:

noah:~# dpkg -L aewan|grep -i /bin/ /usr/bin/aecat
/usr/bin/aewan
/usr/bin/aemakeflic

1. aewan binary is the ascii-art editor itself

2. aecat is utility to display an aewan documents (aewan format saved files)3. aemakeflictool to produce an animation from an aewan document

Next I ran it in plain console tty  to check how it is like:

hipo@noah:~$ aewan

Below are screenshots to give you an idea how powerful aewan ASCII art editor is:

AEWAN ASCII art editor entry information screen Debian GNU / Linux shot

Aewan immediate entry screen after start up

Aewan ASCII art editor Linux showing the major functionality of aewan on Debian GNU / Linux Squeeze

Aewan ASCII art editor – all of the supported tool functions

As you can see from the shot the editor is very feature rich. I was stunned to find out it even supports layers (in ASCII!!) (w0w!). 
It even has a Layers Manager (like GIMP) 🙂

To create my first ASCII art I used the:

New

menu.

This however didn't immediately show the prompt, where I can type  the ascii characters to draw my picture. In order to be able to draw inside the editor, its necessary to open at least one layer, through using the menu:

Add Layer (defaults)

then the interactive ASCII art editor appeared.

While an ASCII art is created with the editor you can select the color of the input characters by using Drawing Color menu seen in the above screenshot.

aewan drawing color choose color Linux shot

I've played few minutes and created a sample ascii art, just to test the color and editor "look & feel", my conclusions are the editor chars drawing is awesome.

Aewan ascii art produced on my Debian GNU / Linux host

All the commands available via menus are also accessible via a shortcut key combinations:

Aewan Linux Ascii art editor quick key shortcut commands

aewan controls are just great and definitely over-shadows every other text editor I used to draw an ASCII art so far.
Once saved the ASCII art, are by default saved in a plain gzipped ascii text. You can therefore simply zcat the the saves;
Don't expect zcat to show you the ascii as they're displayed in aewan, zcat-ing it will instead  display just the stored meta data; the meta data is interpreted and displayed properly only with aecat command.

aewan aecat displaying properly previously saved ascii art picture

I've checked online for rpm builds too and such are available, so installing on Fedora, CentOS, SuSE etc. is up to downloading the right distro / hardware architecture rpm package and running:

# rpm -ivh aewan*.rpm

On the official website, there are also instructions to compile from source, Slackware users and users of other distros which doesn't have a package build should compile manually with the usual:

$ tar -zxf aewan-1.0.01.tar.gz
$ cd aewan-1.0.01
$ ./configure
$ make
$ su -c "make install"

For those inrested to make animations with aemakeflic you need to first save a multiple layers of pictures. The idea of creating ASCII art video is pretty much like the old school way to make animation "draw every scene" and movie it. Once all different scene layers of the ASCII art animation are prepared one could use  aemakeflic to export all the ASCII layers as common video.

aemakeflic has the ability to export the ASCII animation in a runnable shell script to display the animation. The other way aemakeflic can be used is to produce a picture in kind of text format showing the video whether seen with  less cmd.
Making ASCII animation takes a lot of time and effort. Since i'm too lazy and I lack the time I haven't tested this functionality. Anyways I've seen some ascii videos on telnet  to remote hosts (some past time); therefore I guess they were made using aewan and later animated with aemakeflic.

I will close this post with a nice colorful ASCII art, made with aewan (picture is taken from the project page):

Aewan Flipping Selection Screenshot
 

Viewing JPEG,GIF and PNG in ASCII with cacaview on GNU / Linux – Review on caca-utils text mode graphics utilities

Thursday, May 17th, 2012

Stitch 80x45 libcaca mascot cacaview viewing JPG, PNG, GIF images as ASCII on Linux libcaca

Probably, many don't know that it is possible to view normal graphical pictures (JPG, PNG, GIF, BMP) etc. in plain console tty.

Being able to view pictures in ASCII is something really nice especially for console geeks like me.
The images produced sometimes are a bit unreadable, if compared to the original graphics, but anyways most of the pictures looks pretty decent 🙂

Viewing in console / terminal images on GNU / Linux is possible thanks to a library called libcaca, caca labs libcaca project official website here.
Below is a shot description of libcaca:
hipo@noah:~$ apt-cache show libcaca0|grep 'Description' -A 4
Description: colour ASCII art library
libcaca is the Colour AsCii Art library. It provides high level functions
for colour text drawing, simple primitives for line, polygon and ellipse
drawing, as well as powerful image to text conversion routines.

In Debian, Ubuntu and other deb Linux distros viewing GUI images with no need for Xserver or any kind of window manager in plain ASCII is possible with cacaview.

cacaview is part of a package called caca-utils. caca-utils is providing few other great utilities for ASCII freaks 🙂 along with cacaview console ascii viewer prog.
The package> is available for Debian distributins since many years, so even on a very old Debians like Debian – (Potato, Woody, Sarge) the package is available in default free package repositories ready to install via apt

To install apt-get it as usual:

noah:~# apt-get --yes install caca-utils

Here is a list of the binaries the package provides:

hipo@noah:~$ dpkg -L caca-utils|grep -i /usr/bin/
/usr/bin/cacaserver
/usr/bin/cacaplay
/usr/bin/cacafire
/usr/bin/cacademo
/usr/bin/cacaview
/usr/bin/img2txt

1. cacaserver a tiny program allowing network streaming of applications written in caca

Belkow is a chop, from man cacaserver
 

cacaserver reads libcaca animation files in its standard input and
serves them as ANSI art on network port 51914. These animations can be
created by any libcaca program by setting the CACA_DRIVER environment
variable to raw and piping the program's standard output to cacaserver.

Clients can then connect to port 51914 using telnet or netcat to see
the output.

The example section of the manual points 1 example use of cacaserver to stream the console output from cacademo.
cacademo binary is a short presentation ASCII DEMO in the spirit of the old school assembly demos (demoscene) .
To run it to bind on port 51914 one has to type in bash shell:
hipo@noah:~$ CACA_DRIVER=raw cacademo | cacaserver
initialised network, listening on port 51914

Then to check out how the demo looks, open telnet connection to the cacaserver host; In my case the cacaserver is binded and streamed over IP 192.168.0.2:

hipo@debian:~$ telnet 192.168.0.2 51914

Immediately you got the demo shining; Below are two screenshots of the demo played after succesful telnet connection:

Cacaserver - caca for the network screenshot Matrix cacademo

cacademo running over telnet network connection – Matrix

cacaserver running on Debian GNU / Linux drug addict like spots streamed via telnet

Blur spots cacademo shot of cacademo streamed via network

You see the demo looks quite awesome 🙂

2. Running cacafire to stream over network

Another possible example use of cacaserver is in conjunction with cacafire libcaca test application:

noah:~# CACA_DRIVER=raw cacafire | cacaserver
initialised network, listening on port 51914
cacafire is a short application written to render ASCII via libcaca and is just displaying a screen with ASCII (moving) burning fire.
It is quite spectacular if you, ask an unexpecting friend to connect to your host to 51914 🙂

Cacafire Screenshot Debian GNU / Linux cacaserver streaming ASCII demo via network port 51914

Besides that bored sys admins, could run cacafire in console to hypnotize themselves watching dumb the burning fire screen for few hoursor just use it as a screensaver 😉

3. cacaview a program to display a graphic images in console using ASCII art

cacaview takes just one argument – the picture to be displayed.

Below is a screenshot of cacaview ran from my gnome-terminal displaying a ASCII text version of the MySQL server logo

hipo@noah:~$ cd /disk/pictures
hipo@noah:/disk/pictures$ cacaview mysql_logo.png


cacaview displaying MySQL database logo in ASCII using caca for X

Whether cacaview is invoked in GUI, the libcaca X support is used, so the text image is visualized in new window with graphics, if however it is invoked in plain let's say tty1 libcaca displays the graphics pictures drawing it with only text characters.

Here is also a screenshot, I've made while viewing a GIF website logo in ASCII in plain tty console:

hipo@noah:~$ cacaview /disk/pictures/logo.gif

cacaview plain tty console screenshot of a website logo graphics pictures 17-05-2012

The logo is in cyrillic, so for latin speaking people some of the characters in the two words seen will be unreadable 🙂

cacaview even supports viewing, the next and previous picture in line, like in any modern graphics image viewer program.
To view a bunch of graphic pictures in ASCII with cacaview pass it *.*:

hipo@noah:~$ cacaview /disk/pictures/*.*

For simplicity the common unix * is also supported, so I find it quicker to do:

hipo@noah:~$ cacaview /disk/pictures/*

Showing pictures forward and backward (Previous / Next) picture is done with n and p kbd keys, whether;
n - next;
p - previous

cacaview doesn't crash or stop but skip unknown file formats – if for instance encounters filenames which are not images; lets say you have *.rar archive files along with other pictures.

The complete list of keys cacaview supports are:
br />

KEYS
? show the help screen

n, p switch to next image, previous image

Left, Right, Up, Down or h, l, k, j
scroll the image around

+, – zoom in and out

z reset the zoom level to normal

f switch fullscreen mode (hide/show menu and status bars)

d toggle the dithering mode (no dithering, 4×4 ordered dithering, 8×8 ordered dithering and random dithering)

q exit the program

4. Converting graphics images to ASCII art like (plain text pictures)

The tool that does "the trick" is img2txt. img2txt has a bit more options while compared to the rest of the aforementioned tools.The following list of arguments are recognized:

  • the size (font, height)
  • brightness
  • contrast
  • gamma and dither
  • format type of out the output pic

Anyways I found that the basic just in / out arguments passed are enough to produce pretty good results:

hipo@noah:~$ img2txt hipo_avatar.gif >hipo_avatar_pic.txt

The original hipo_avatar.gif file looks like so:

hipo avatar gif picture before img2txt convertion to text

After above img2txt command is run and hipo_avatar_pic.txt to see the colorful output ASCII art img2txt produces, cat it:

hipo@noah:~$ cat hipo_avatar_pic.txt

The image result if screenshot looks quite beautiful and even, can be considered or used as an ART effect image (filter) 🙂

Console Screenshot hipo avatar pic ASCII img2txt output picture

The picture colors are plain ANSI color, so in order to display properly the picture with colors on another computers or Operating System you will need at least basic support for ANSI colors.

Plenty of output file formats are supported by img2txt

Here is the complete list of supported output formats:
 

ansi : coloured ANSI
caca : internal libcaca format
utf8 : UTF8 with CR
utf8 : UTF8 with CRLF (MS Windows)
html : HTML with CSS and DIV support
html3 : Pure HTML3 with tables
irc : IRC with ctrl-k codes
bbfr : BBCode (French)
ps : Postscript
svg : Scalable Vector Graphics
tga : Targa Image

libcaca is available for FreeBSD too, but the caca-utils is not available as a port yet, though probably the deb or rpm packages can easily be ported to BSD.

Well that's all, Enjoy.