Posts Tagged ‘default’

How rescue unbootable Windows PC, Windows files through files Network copy to remote server shared Folder using Hirens Boot CD

Saturday, November 12th, 2011

hirens-boot-cd-logo-how-to-rescue-unbootable-pc-with-hirens-bootcd
I'm rescuing some files from one unbootable Windows XP using a livecd with Hirens Boot CD 13

In order to rescue the three NTFS Windows partitions files, I mounted them after booting a Mini Linux from Hirens Boot CD.

Mounting NTFS using Hirens BootCD went quite smoothly to mount the 3 partitions I used cmds:

# mount /dev/sda1 /mnt/sda1
# mount /dev/sda2 /mnt/sda2
# mount /dev/sdb1 /mnt/sdb1

After the three NTFS file partitions are mounted I used smbclient to list all the available Network Shares on the remote Network Samba Shares Server which by the way possessed the NETBIOS name of SERVER 😉

# smbclient -L //SERVER/
Enter root's password:
Domain=[SERVER] OS=[Windows 7 Ultimate 7600] Server=[Windows 7 Ultimate 6.1]

Sharename Type Comment
——— —- ——-
!!!MUSIC Disk
ADMIN$ Disk Remote Admin
C$ Disk Default share
Canon Inkjet S9000 (Copy 2) Printer Canon Inkjet S9000 (Copy 2)
D$ Disk Default share
Domain=[SERVER] OS=[Windows 7 Ultimate 7600] Server=[Windows 7 Ultimate 6.1]
Server Comment
——— ——-
Workgroup Master
——— ——-

Further on to mount the //SERVER/D network samba drive – (the location where I wanted to transfer the files from the above 3 mounted partitions):

# mkdir /mnt/D
# mount //192.168.0.100/D /mnt/D
#

Where the IP 192.168.0.100 is actually the local network IP address of the //SERVER win smb machine.

Afterwards I used mc to copy all the files I needed to rescue from all the 3 above mentioned win partitions to the mounted //SERVER/D
 

Configuring varnishd to log client IP addresses in Apache log

Wednesday, February 3rd, 2010

I realized today, that because my varnish serves incoming connections to my
apache port a really annoying problem appears.
I mean in my httpd-access.log everytime I get some visit from the Net, the
incoming IP address logged in the Apache log is originating from 127.0.0.0
e.g. (localhost). That’s a real pain in the ass, cause it prevents me from
adequately tracking visitors countries and their networks.
Therefore to fix that and configure varnish to always log my original visitors
IPs to the apache log I had to follow instructions described in.
How can I log the client IP address on the backend? in the Varnish Cache FAQ

Here I will include step by step explanation how I practically implemented
the solution as explained in the FAQ on my FreeBSD.

First I had edit:
/usr/local/etc/varnish/default.vcl
The following is currently my default.vlc file content:
backend default {.host = "127.0.0.1";.port = "8080";}sub vcl_recv {# Add a unique header containing the client addressremove req.http.X-Forwarded-For;set req.http.X-Forwarded-For = client.ip;# [...]}
Next I had to add:
varnishd_config="/usr/local/etc/varnish/default.vcl"
to my /etc/rc.conf
And then modify my:
/usr/local/etc/apache2/httpd.conf
and include:
LogFormat "%{X-Forwarded-For}i %l %u %t "%r" %>s %b "%{Referer}i" "%{User-Agent}i"" varnishcombined
as well as:
CustomLog /var/log/httpd-access.log varnishcombined
to all my VirtualHosts.

Finally it’s required to restart both varnishd and apache
pcfreak# /usr/local/etc/rc.d/varnishd restartpcfreak# /usr/local/etc/rc.d/apache2 restart

That’s all folks!

Enable Rsyslog and Syslog cron events logging in /var/log/cron.log on Debian Lenny

Friday, April 9th, 2010

By default Debian doesn’t log it’s cron events in a separate log file.
All the cron events got logged along with all the other syslog events configured by default in either syslog or rsyslog.
So you end up with a /var/log/syslog which includes many versatile messages. That’s really unpleasent if you want to keep track of your cron events separately.
I always change this behaviour while configuring new servers or Desktop systems running Debian.
Therefore I decided to share here what I do to enable separate cron logging. The logged cron events would go to var/log/cron.log.
As a starter please make sure you have the file /var/log/cron.log existing on your filesystem tree, if you have it not then please create it:
debian:~# touch /var/log/cron.log

To configure your crond to log to /var/log/cron.log on a system running syslogd all you have to do is edit /etc/syslog.conf and either include the line:

cron.* /var/log/cron.log
or simply uncomment the same line already laying commented in the syslog.conf.
If you’re using the enhanced version of syslogd for Linux (Rsyslog) the code syntax that is necessery to be included is absolutely identical.
Again you have to include:

cron.* /var/log/cron.log

in /etc/rsyslog.conf or uncomment the line shown above in /etc/rsyslog.conf.

Now last step to do is to reload syslogd or rsyslogd.

With syslogd running on your system execute:

debian:~# killall -HUP syslogd

With rsyslogd as a default system logger:

debian:~# killall -HUP rsyslogd

Now you should have your crond logging to the separate /var/log/cron.log, wish you happy cron.log reading 🙂

How to easy add Joomla 1.5 donate Paypal capabilities with Joomla PAYPAL DONATION MODULE

Wednesday, June 15th, 2011

PayPal donation Module Joomla Screenshot

Many joomla CMS installations are for Non-profit organizations or Non Government organizations. These are organizations which are not officially making profit and therefore this instituations are interested into donations to support their activities.

In this occasions adding Joomla paypal capabilities is very essential. There are plenty of modules which enables Joomla to support paypal monetary payments, however many of them are either paid or requires registration and thus it’s quite time consuming to set up a decent PayPal supporting module for Joomla.
After a bit of investigation thanks God, I’ve come across a module that is free of charge, easily downloadable (wihtout registration) and is also relatively easy to configure, these module is called PAYPAL DONATION MODULE
I’ve mirored the module to my server, just in case if the module disappears in the future.

Here are a very brief explanation on how the module can be downloaded installed and configured:

First Download (mod_ojdonation_pp) Paypal Donation Module here

Install it as joomla module via:

Extensions -> Install/Uninstall
menu

Afterwards, go to:

Extensions -> Module Manager

In the list of modules you will notice the Donate module which will be disabled. Use the Enable button to enable it.

Next by clicking on the Donate Module Name, one can configure the module, where the most essential configuration values that needs to be filled in are:

1. Title: – The title of the donation form:
2. Donation Title: – Title of donation picture to show in the webpage
3. Donation Amount: – Default donation amount user will donate with paypal by clicking on Donate button
4. Currency – Default currency the donators will use to donate to configured paypal account
5. Paypal ID: – The email address of paypal account your donators will donate to (This was a bit hard to understand since Paypal ID is not a number ID but the email address configured as an username in PayPal).
6. Donation Description: – Description text to appear before the Donate button
7. Donation Footer: – Text to appear after the Donate button

There are two ways one could add the donation module to show the donation form, on the joomla website:
a. One is to enable the donation button on every joomla webpage (I don’t like this kind of behaviour).

To use this kind of donate button display approach, you will have to select from the Donation module, conf options:
– Show on FrontPage: and Show Title:

Also make sure the Enabled: option is set to Yes

b. Second approach is to set the PayPal Donation form only to appear on a single menu, to do so:

While in Paypal Donation Module configuration in Menu Assignment section, select:

Select Menu Item(s) from the List
instead of the default All value set for Menus.

The last setting to be choosen is the paypal donation form page location (where exactly on the selected pages the form will appear).

The form location is set from the Position: dropdown menu, the option which I found to be the best one for me was the bottom option. However just play with the Position setting and choose the one that will be best for you.

Then scroll on in the Menu Selection: and choose only the menus where you want a paypal donation form to appear.

Finally to save all the recent made settings, click on Apply and refreshing in a new page should show you paypal’s money donation form in joomla

If all is configured fine with Joomla’s – Paypal Donation Module you should get on your webpage:

PayPal donation Module in Joomla Screenshot
 

mod_rewrite redirect rule 80 to 443 on Apache webserver

Wednesday, April 2nd, 2014

A classic sysadmin scenario is to configure new Apache webserver with requirement to have an SSL ceriticate installed and working on port 443 and all requests coming on port 80 to be redirected to https://.
On Apache this is done with simple mod_rewrite rule:

RewriteEngine On
RewriteCond %{HTTPS} off
RewriteRule (.*) https://%{HTTP_HOST}%{REQUEST_URI}

Before applying the rule don't forget to have Apache mod_rewrite enabled usually it is not enabled on default most Linux distributions by default.
On shared hostings if you don't have access to directly modify Apache configuration but have .htaccess enabled you can add above rules also to .htaccess

Add this to respective VirtualHost configuration and restart Apache and that's it. If after configuring it for some reason it is not working debug mod_rewrite issues by enabling mod_rewrite's rewrite.log

Other useful Apache mod_rewrite redirect rule is redirect a single landing page from HTTP to HTTP

RewriteEngine On
RewriteRule ^apache-redirect-http-to-https.html$ https://www.site-url.com/apache-redirect-http-to-https.html [R=301,L]

!Note! that in case where performance is a key requirement for a website it might be better to use the standard way to redirect HTTP to HTTPS protocol in Apache through:

ServerName www.site-url.com Redirect / https://www.site-url.com/

To learn more on mod_rewrite redirecting  check out this official documentation on Apache's official site.

How to Turn Off, Suppress PHP Notices and Warnings – PHP error handling levels via php.ini and PHP source code

Friday, April 25th, 2014

php-logo-disable-warnings-and-notices-in-php-through-htaccess-php-ini-and-php-code

PHP Notices are common to occur after PHP version upgrades or where an obsolete PHP code is moved from Old version PHP to new version. This is common error in web software using Frameworks which have been abandoned by developers.

Having PHP Notices to appear on a webpage is pretty ugly and give a lot of information which might be used by malicious crackers to try to break your site thus it is always a good idea to disable PHP Notices. There are plenty of ways to disable PHP Notices

The easiest way to disable it is globally in all Webserver PHP library via php.ini (/etc/php.ini) open it and make sure display_errors is disabled:

display_errors = 0

or

display_errors = Off

Note that that some claim in PHP 5.3 setting display_errors to Off will not work as expected. Anyways to make sure where your loaded PHP Version display_errors is ON or OFF use phpinfo();

It is also possible to disable PHP Notices and error reporting straight from PHP code you need code like:


<?php
// Turn off all error reporting
error_reporting(0);
?>


or through code:


ini_set('display_errors',0);


PHP has different levels of error reporting, here is complete list of possible error handling variables:


<?php
// Report simple running errors

error_reporting(E_ERROR | E_WARNING | E_PARSE);

// Reporting E_NOTICE can be good too (to report uninitialized
// variables or catch variable name misspellings …)

error_reporting(E_ERROR | E_WARNING | E_PARSE | E_NOTICE);

// Report all errors except E_NOTICE
// This is the default value set in php.ini

error_reporting(E_ALL ^ E_NOTICE);
// Report all PHP errors (see changelog)

error_reporting(E_ALL);
// Report all PHP errors error_reporting(-1);
// Same as error_reporting(E_ALL);

ini_set('error_reporting', E_ALL); ?>

The level of logging could be tuned on Debian Linux via /etc/php5/apache2/php.ini or if necessary to set PHP log level in PHP CLI through /etc/php5/cli/php.ini with:

error_reporting = E_ALL & ~E_NOTICE


If you need to remove to remove exact warning or notices from PHP without changing the way  PHPLib behaves is to set @ infront of variable or function that is causing NOTICES or WARNING:
For example:
 

@yourFunctionHere();
@var = …;


Its also possible to Disable PHP Notices and Warnings using .htaccess file (useful in shared hosting where you don't have access to global php.ini), here is how:

# PHP error handling for development servers
php_flag display_startup_errors off
php_flag display_errors off
php_flag html_errors off
php_flag log_errors on
php_flag ignore_repeated_errors off
php_flag ignore_repeated_source off
php_flag report_memleaks on
php_flag track_errors on
php_value docref_root 0
php_value docref_ext 0
php_value error_log /home/path/public_html/domain/php_errors.log
php_value error_reporting -1
php_value log_errors_max_len 0

This way though PHP Notices and Warnings will be suppressed errors will get logged into php_error.log

Linux: basic system CPU, Disk and Network resource monitoring via phpsysinfo lightweight script

Wednesday, June 18th, 2014

phpsysinfo-logo-simple-way-to-web-monitor-windows-linux-server-cpu-disk-network-resources

There are plenty of GNU / Linux softwares to monitor server performance (hard disk space, network and CPU load) and general hardware health both text based for SSH console) and from web.

Just to name a few for console precious tools, such are:

And for web based Linux / Windows server monitoring my favourite tools are:

phpsysinfo is yet another web based Linux monitoring software for small companies or home router use it is perfect for people who don't want to spend time learning how to configure complicated and robust multiple server monitoring software like Nagios or Icanga.

phpsysinfo is quick and dirty way to monitor system uptime, network, disk and memory usage, get information on CPU model, attached IDEs, SCSI devices and PCIs from the web and is perfect for Linux servers already running Apache and PHP.

1. Installing PHPSysInfo on Debian, Ubuntu and deb derivative Linux-es

PHPSysInfo is very convenient and could be prefered instead of above tools for the reason it is available by default in Debian and Ubuntu package repositories and installable via apt-get and it doesn't require any further configuration, to roll it you install you place a config and you forget it.
 

 # apt-cache show phpsysinfo |grep -i desc -A 2

Description: PHP based host information
 phpSysInfo is a PHP script that displays information about the
 host being accessed.


Installation is a piece of cake:

# apt-get install --yes phpsysinfo

Add phpsysinfo directives to /etc/apache2/conf.d/phpsysinfo.conf to make it accessible via default set Apache vhost domain under /phpsysinfo

Paste in root console:
 

cat > /etc/apache2/conf.d/phpsysinfo.conf <<-EOF
Alias /phpsysinfo /usr/share/phpsysinfo
<Location /phpsysinfo>
 Options None
 Order deny,allow
 Deny from all
 #Allow from localhost
 #Allow from 192.168.56.2
 Allow from all
</Location>
EOF


Above config will allow access to /phpsysinfo from any IP on the Internet, this could be a security hole, thus it is always better to either protect it with access .htaccess password login or allow it only from certain IPs, from which you will access it with something like:

Allow from 192.168.2.100

Then restart Apache server:

# /etc/init.d/apache2 restart


To access phpsysinfo monitoring gathered statistics, access it in a browser http://defaultdomain.com/phpsysinfo/

phpsysinfo_on_debian_ubuntu_linux-screenshot-quick-and-dirty-web-monitoring-for-windows-and-linux-os

2. Installing PHPSysinfo on CentOS, Fedora and RHEL Linux
 

Download and untar

# cd /var/www/html
# wget https://github.com/phpsysinfo/phpsysinfo/archive/v3.1.13.tar.gz
# tar -zxvf phpsysinfo-3.1.13.tar.gz
# ln -sf phpsysinfo-3.1.13 phpsysinfo
# mv phpsysinfo.ini.new phpsysinfo.ini


Install php php-xml and php-mbstring RPM packages
 

yum -y install php php-xml php-mbstring
...

Start Apache web service

[root@ephraim html]# /etc/init.d/httpd restart

[root@ephraim html]# ps ax |grep -i http
 8816 ?        Ss     0:00 /usr/sbin/httpd
 8819 ?        S      0:00 /usr/sbin/httpd

phpsysinfo-install-on-centos-rhel-fedora-linux-simple-monitoring

As PhpSysInfo is written in PHP it is also possible to install phpsysinfo on Windows.

phpsysinfo is not the only available simple monitoring server performance remotely tool, if you're looking for a little bit extended information and a better visualization interface alternative to phpsysinfo take a look at linux-dash.

In context of web monitoring other 2 web PHP script tools useful in remote server monitoring are:

OpenStatus – A simple and effective resource and status monitoring script for multiple servers.
LookingGlass – User-friendly PHP Looking Glass (Web interface to use Host (Nslookup), Ping, Mtr – Matt Traceroute)

Fix MySQL connection error – Host ” is blocked because of many connection errors; unblock with ‘mysqladmin flush-hosts’

Wednesday, July 2nd, 2014

fix-mysql-too-many-connection-errors-explained

If you get a MySQL error like:

Host '' is blocked because of many connection errors; unblock with 'mysqladmin flush-hosts'

This most likely means your PHP / Java whatever programming language application connecting to MySQL is failing to authenticate with the application created (existing) or that the application is trying too many connections to MySQL in a rate where MySQL server can't serve all the requests.

Some common errors for Too many Connection errors are:
 

  • Networking Problem
  • Server itself could be down
  • Authentication Problems
  • Maximum Connection Errors allowed.

The value of the max_connection_errors system variable determines how many successive interrupted connection requests are permitted to myqsl server.
 

Well anyways if you get the:

Host '' is blocked because of many connection errors; unblock with 'mysqladmin flush-hosts'

You can consider this a sure sign application connections to MySQLis logging a lot of error connections, for some reason.
This error could also appear on very busy websites where high amount of separete connections are used – I've seen the error occur on PHP websites whether mysql_pconnect(); is selected in favour of the prooved working mysql_connect();

The first thing to do before changing / increasing default set of max connection errors is to check how many max connection errors are set within MySQL?

For that connect with MySQL CLI and issue:
 

mysql> SHOW VARIABLES LIKE '%error%';


+——————–+————————————————————-+
| Variable_name      | Value                                                           |
+——————–+————————————————————-+
| error_count        | 0                                                                     |
| log_error          | /var/log/mysql//mysqld.log                                |
| max_connect_errors | 10000                                                      |
| max_error_count    | 64                                                               |
| slave_skip_errors  | OFF                                                             |
+——————–+————————————————————-+


A very useful mysql cli command in debugging max connection errors reached problem is

mysql> SHOW PROCESSLIST;


To solve the error, try to tune in /etc/my.cnf, /etc/mysql/my.cnf or wherever my.cnf is located:

[mysqld]
max_connect_errors
variable

and

wait_timeout var. Some reasonable variable size would be:

max_connect_errors = 100000
wait_timeout = 60

If such (anyways) high values is still not high enough you can raise mysql config connection timeout


to

max_connect_errors = 100000000

Also if you want to try raise max_connect_errors var without making it permanenty (i.e. remember var setting after MySQL service restart), set it from MySQL cli with:

SET GLOBAL max_connect_errors


If you want to keep the set default max_connection_errors and fix it temporary, you can try to follow the error

Host '' is blocked because of many connection errors; unblock with 'mysqladmin flush-hosts'

suggestion and issue in root console:

mysqladmin flush-hosts

Same could also be done from MySQL Cli with cmd:
 

FLUSH HOSTS;

How to share your Windows local drives via Remote Desktop (RDP) – Safe file copy with RDP protocol

Tuesday, October 14th, 2014

remote-desktop-connection-options-button-screenshot

Just had a task to install Tomcat 7, Java JRE 1.7 and .NET Framework 3.5 and MS Visual C++ x86 on a Windows 2008 RC2 system situated behind a firewalled network NAT. To do the installation I had to use a special jump host (which was also a MS Windows system). The end system where installation had to occur did not have access to the Internet was in special DMZ-ed network so to install above 3 software packages I had to transfer them from my notebook to install host.
To depic what had to happen, I had to:

Transfer files from (host A – my notebook) -> via host (B – jump host) to host (C – the end install host).

Default Windows RDP Client command (mstsc.exe) supports transferring files between host A and RDP-ed host B via standard file copy / paste, so I tried transferring files between my work Windows PC to (jump host B), by copy pasting the files, but as the DotNetFx35Client.exe file was 261 Megabytes and the network between host A and B has some shapings and network firewalls the file transfer timed out. Copy / Paste method via RDP Protocol by default, doesn’t support Transfer Resume thus in order to transfer the 261 MB file, I tried Sharing C:Temp Folder and transfer that way, but unfortunately I didn’t have the permissions in that Windows Domain to create sharings (even though on the remote system I was already logged in with admin accounts). I’ve consulted a colleague on advise on how to transfer the files and I was told about a Win RDP client option to share drives.

Here is how to share your PC drive letters C: D: E: etc. via Remote Desktop Protocol


1. Run mstsc.exe

2. Click the Options button

remote-desktop-connection-options-button-screenshot

3. Click Local Resources tab

4. Click More button

remote-desktop-connection-more-options-button-screenshot

5. Click on Drives

remote-desktop-connection-share-windows-disk-drives-option-screenshot

Then after connecting to the Remote RDP host, all your local PC drive partitions C: D: E: will be visible as (attached) ones in mounted in My Computer / MS Explorer with assigned new drive letters

Once, I transferred the .NET Framework 3.5 while using the installer I was notified that .NET Framework 3.5 is by default included in Windows 8 and I need only to enable it.

To enable .NET Framework 3.5 in Windows 8 from Control Panel

Choose Programs, and then choose Turn Windows features on or off.

Select the .NET Framework 3.5 (includes .NET 2.0 and 3.0) check box.
enable-dot-net-framework-windows-8-windows-8.1-add-feature-screenshot

Linux: How to see / change supported network bandwidth of NIC interface and get various eth network statistics with ethtool

Monday, January 19th, 2015

linux-how-to-see-change-supported-network-bandwidth-of-NIC-interface-and-view-network-statistics
If you're a novice Linux sysadmin and inherited some dedicated servers without any documentation and hence on of the first things you have to do to start a new server documentation is to check the supported TCP/IP network speed of servers Network (ethernet) Interfaces. On Linux this is very easy task to verify the speed of LAN card supported Local / Internet traffic install ethtool (if not already preseont on the servers) – assuming you're dealing with Debian / Ubuntu Linux servers.

1. Install ethtool on Deb and RPM based distros

dedi-server1:~# apt-cache show ethtool|grep -i desc -A 3
Description: display or change Ethernet device settings
 ethtool can be used to query and change settings such as speed, auto-
 negotiation and checksum offload on many network devices, especially
 Ethernet devices.

dedi-server1:~# apt-get install –yes ethtool
..

ethtool should be installed by default on CentOS / Fedora / RHEL and  syntax is same like on Debs. If you happen to miss ethtool on any (SuSE) / RedHat / RPM based distro install it with yum

[root@centos:~] # yum -y install ethtool


2. Get ethernet configurations

To check the current eth0 / eth1 / ethX network (Speed / Duplex) and other network related configuration configuration:
 

dedi-server5:~# ethtool eth0

Settings for eth0:
        Supported ports: [ TP ]
        Supported link modes:   10baseT/Half 10baseT/Full
                                100baseT/Half 100baseT/Full
                                1000baseT/Full
        Supports auto-negotiation: Yes
        Advertised link modes:  10baseT/Half 10baseT/Full
                                100baseT/Half 100baseT/Full
                                1000baseT/Full

        Advertised pause frame use: No
        Advertised auto-negotiation: Yes
        Speed: 1000Mb/s
        Duplex: Full
        Port: Twisted Pair
        PHYAD: 1
        Transceiver: internal
        Auto-negotiation: on
        MDI-X: off
        Supports Wake-on: pumbag
        Wake-on: g
        Current message level: 0x00000001 (1)
        Link detected: yes

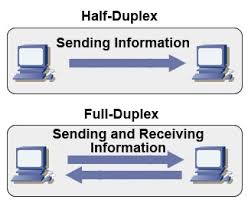
Having a NIC configured to act as Duplex is very important as Duplex communication enables LAN card to communicate both sides (Sent / Receive) packets simultaneously.

full-duplex-half-duplex-explained-picture

Probably most interesting parameters for most admins are the ones that are telling whether the NIC UpLink is 10megabyte / 100 megabyte or 1Gigabyte as well as supported Receive / Send ( Transfer ) speeds of LAN, a common useful ethtool admin use to just show current LAN ethernet interface speed:

server-admin1:~# ethtool eth0 |grep -i speed
        Speed: 1000Mb/s


To get info about NIC (kernel module / driver) used with ethtool:

dedi-server3:~# ethtool -i eth0 driver: e1000e
version: 1.2.20-k2
firmware-version: 1.8-0
bus-info: 0000:06:00.0

3. Make LAN Card blink to recognize eth is mapped to which Physical LAN

Besides that ethtool has many other useful use cases, for example if you have a server with 5 lan or more LAN cards, but you're not sure to which of all different EthX interfaces correspond, a very useful thing is to make eth0, eth1, eth2, eth3, etc. blink for 5 seconds in order to identify which static IP is binded physically to which NIC , here is how:

ethtool -p eth0 5


Then you can follow the procedure for any interface on the server and map them with a sticker 🙂

Ethtool is also useful for getting "deep" (thorough) statistics on Server LAN cards, this could be useful to identify sometimes hard to determine broadcast flood attacks:
 

4. Get network statistics with ethtool for interfaces
 

dedi-server5:~# ethtool -S eth0|grep -vw 0
NIC statistics:
     rx_packets: 6196644448
     tx_packets: 7197385158
     rx_bytes: 2038559235701
     tx_bytes: 8281206569250
     rx_broadcast: 357508947
     tx_broadcast: 172
     rx_multicast: 34731963
     tx_multicast: 20
     rx_errors: 115
     multicast: 34731963
     rx_length_errors: 115
     rx_no_buffer_count: 26391
     rx_missed_errors: 10059
     tx_timeout_count: 3
     tx_restart_queue: 2590
     rx_short_length_errors: 115
     tx_tcp_seg_good: 964136993
     rx_long_byte_count: 2038559235701
     rx_csum_offload_good: 5824813965
     rx_csum_offload_errors: 42186
     rx_smbus: 383640020

5. Turn on Auto Negotiation and change NIC set speed to 10 / 100 / 1000 Mb/s

Auto-negotiation is important as an ethernet procedure by which two communication devices (2 network cards) choose common transmission parameters such as speed, duplex mode, and flow control in order to achieve maximum transmission speed over the network. On 1000BASE-T basednetworks the standard is a mandatory. There is also backward compatability for older 10BASE-T Networks.

a) To raise up NIC to use 1000 Mb/s in case if the bandwidth was raised to 1Gb/s but NIC settings were not changed:

dedi-server1:~# ethtool -s eth0 speed 1000 duplex half autoneg off


b) In case if LAN speed has to be reduced for some weird reason to 10 / 100Mb/s


dedi-server1:~# ethtool -s eth0 speed 10 duplex half autoneg off

dedi-server1:~# ethtool -s eth0 speed 100 duplex half autoneg off

c) To enable disable NIC Autonegotiation:

dedi-server1:~# ethtool -s eth0 autoneg on


6. Change Speed / Duplex settings to load on boot

a) Set Network to Duplex on Fedora / CentOS etc.

Quickest way to do it is of course to use /etc/rc.local. If you want to do it following distribution logic on CentOS / RHEL Linux:

Add to /etc/sysconfig/network-scripts/ifcfg-eth0

vim /etc/sysconfig/network/-scripts/ifcfg-eth0

ETHTOOL_OPTS="speed 1000 duplex full autoneg off"

To load the new settings restart networking (be careful to have physical access to server if something goes wrong 🙂 )

service network restart

b) Change network speed / duplex setting on Debian / Ubuntu Linux

Add at the end of /etc/network/interfaces

vim /etc/network/interfaces

post-up ethtool -s eth0 speed 100 duplex full autoneg off

7. Tune NIC ring buffers

dedi-server1:~# ethtool -g eth0

Ring parameters for eth0:
Pre-set maximums:
RX:             4096
RX Mini:        0
RX Jumbo:       0
TX:             4096
Current hardware settings:
RX:             256
RX Mini:        0
RX Jumbo:       0
TX:             256

As you can see the default setting of RX (receive) buffer size is low 256 and on busy servers with high traffic loads, depending on the hardware NIC vendor this RX buffer size varies.
Through increasing the Rx/Tx ring buffer size , you can decrease the probability of discarding packets in the NIC during a scheduling delay.
A change in rx buffer ring requires NIC restart so (be careful not to loose connection to remote server), be sure to have iLO access to it.

Here is how to raise Rx ring buffer size 4 times from default value:

ethtool -G eth0 rx 4096 tx 4069