Posts Tagged ‘system’
Wednesday, April 16th, 2014 
Sooner or later your Linux Desktop or Linux server hard drive will start breaking up, whether you have a hardware or software RAID 1, 6 or 10 you can and good hard disk health monitoring software you can react on time but sometimes as admins we have to take care of old servers which either have RAID 0 or missing RAID configuration and or disk firmware is unable to recognize failing blocks on time and remap them. Thus it is quite useful to have techniques to save data from failing hard disk drives with physical badblocks.
With ddrescue tool there is still hope for your Linux data though disk is full of unrecoverable I/O errors.
apt-cache show ddrescue
apt-cache show ddrescue|grep -i description -A 12
Description: copy data from one file or block device to another
dd_rescue is a tool to help you to save data from crashed
partition. Like dd, dd_rescue does copy data from one file or
block device to another. But dd_rescue does not abort on errors
on the input file (unless you specify a maximum error number).
It uses two block sizes, a large (soft) block size and a small
(hard) block size. In case of errors, the size falls back to the
small one and is promoted again after a while without errors.
If the copying process is interrupted by the user it is possible
to continue at any position later. It also does not truncate
the output file (unless asked to). It allows you to start from
the end of a file and move backwards as well. dd_rescue does
not provide character conversions.
To use ddrescue for saving data first thing is to shutdown the Linux host boot the system with a Rescue LiveCD like SystemRescueCD – (Linux system rescue disk), Knoppix (Most famous bootable LiveCD / LiveDVD), Ubuntu Rescue Remix or BackTrack LiveCD – (A security centered "hackers" distro which can be used also for forensics and data recovery), then mount the failing disk (I assume disk is still mountable :). Note that it is very important to mount the disk as read only, because any write operation on hard drive increases chance that it completely becomes unusable before saving your data!
To make backup of your whole hard disk data to secondary mounted disk into /mnt/second_disk
# mkdir /mnt/second_disk/rescue
# mount /dev/sda2 /mnt/second_disk/rescue
# dd_rescue -d -r 10 /dev/sda1 /mnt/second_disk/rescue/backup.img
# mount -o loop /mnt/second_disk/rescue/backup.img
In above example change /dev/sda2 to whatever your hard drive device is named.
Whether you have already an identical secondary drive attached to the Linux host and you would like to copy whole failing Linux partition (/dev/sda) to the identical drive (/dev/sdb) issue:
ddrescue -d -f -r3 /dev/sda /dev/sdb /media/PNY_usb/rescue.logfile
If you got just a few unreadable files and you would like to recover only them then run ddrescue just on the damaged files:
ddrescue -d –R -r 100 /damaged/disk/some_dir/damaged_file /mnt/secondary_disk/some_dir/recoveredfile
-d instructs to use direct I/O
-R retrims the error area on each retry
-r 100 sets the retry limit to 100 (tries to read data 100 times before resign)
Of course this is not always working as on some HDDs recovery is impossible due to hard physical damages, if above command can't recover a file in 10 attempts it is very likely that it never succeeds …
A small note to make here is that there is another tool dd_rescue (make sure you don't confuse them) – which is also for recovery but GNU ddrescue performs better with recovery.
How ddrescue works is it keeps track of the bad sectors, and go back and try to do a slow read of that data in order to read them.
By the way BSD users would happy to know there is ddrescue port already, so data recovery on BSDs *NIX filesystems if you're a Windows user you can use ddrescue to recover data too via Cygwin.
Of course final data recovery is also very much into God's hands so before launching ddrescue, don't forget to say a prayer 🙂
Tags: bad blocks, data, firmware, GNU, good, hard disk, hard drive, health, input file, Linux, Linux data recovery, linux desktop, mnt, mount dev, Raid, read, recovery, run, software, system, system rescuecd ddrescue, time, Ubuntu Rescue Remix, use
Posted in Linux, Linux Backup tools, System Administration | No Comments »
Wednesday, April 23rd, 2014 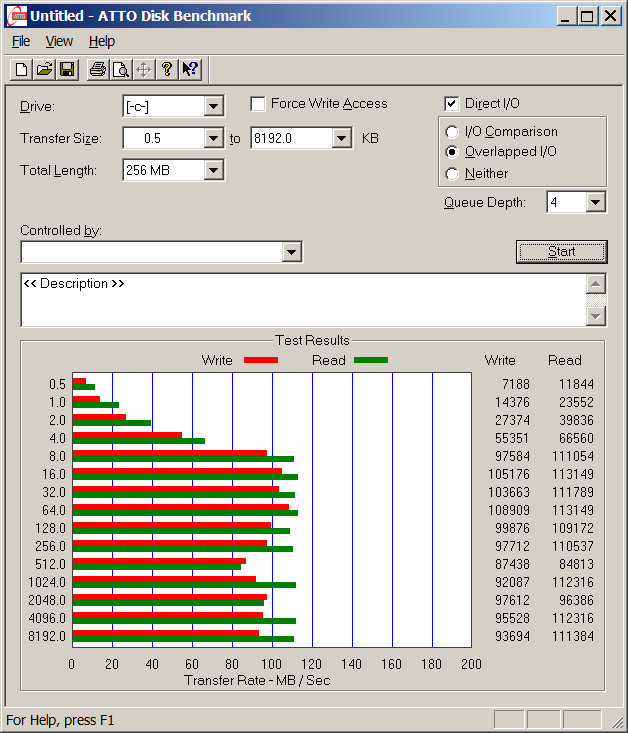
Disk Benchmarking is very useful for people involved in Graphic Design, 3D modelling, system admins and anyone willing to squeeze maximum of his PC hardware.
If you want to do some benchmarking on newly built Windows server targetting Hard Disk performance, just bought a new hard SSD (Solid State Drives) and you want to test how well Hard Drive I/O operations behave or you want to see a regular HDD benchmarking of group of MS Windows PCs and plan hardware optiomization, check out ATTO Disk Benchmark.
So why exactly ATTO Benchmark? – Cause it is one of the best Windows Free Benchmark tools on the internet.
ATTO is a widely-accepted Disk Benchmark freeware utility to help measure storage system performance. ATTO though being freeware is among top tools utilized in industry. It is very useful in comparing different Hard Disk vendors speed, measure Windows storage systems performance with various transfer sizes and test lengths for reads and writes.
ATTO Disk Benchmark is used by manufacturers of Hardware RAID controllers, its precious tool to test Windows storage controllers, host bus adapters (HBAs).
Here is ATTO Benchmark tool specifications (quote from their webstie):
- Transfer sizes from 512KB to 8MB
- Transfer lengths from 64KB to 2GB
- Support for overlapped I/O
- Supports a variety of queue depths
- I/O comparisons with various test patterns
- Timed mode allows continuous testing
- Non-destructive performance measurement on formatted drives
- Transfer sizes from 512KB to 8MB
- Transfer lengths from 64KB to 2GB
- Support for overlapped I/O
- Supports a variety of queue depths
- I/O comparisons with various test patterns
- Timed mode allows continuous testing
- Non-destructive performance measurement on formatted drives
- – See more at: http://www.attotech.com/disk-benchmark/#sthash.rRlgSTOE.dpuf
Here is mirrored latest version of ATTO Disk for Download. Once you get your HDD statistics you will probably want to compare to other people results. On TomsHardware's world famous Hardware geek site there are plenty of Hard Drives performance Charts
Of course there are other GUI alternatives to ATTO Benchmark one historically famous is NBench
NBench
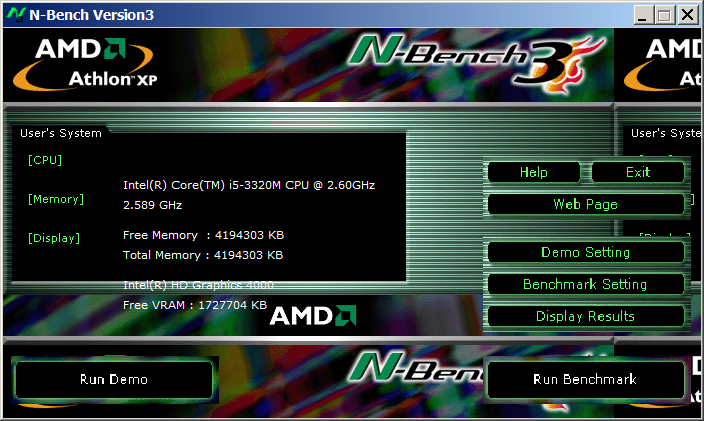
Nbench is nice little benchmarking program for Windows NT. Nbench reports the following components of performance:
CPU speed: integer and floating operations/sec
L1 and L2 cache speeds: MB/sec
main memory speed: MB/sec
disk read and write speeds: MB/sec
SMP systems and multi-tasking OS efficiency can be tested using up to 20 separate threads of execution.
For Console Geeks or Windows server admins there are also some ports of famous *NIX Hard Disk Benchmarking tools:
NTiogen
NTiogen benchmark was written by Symbios Logic, It's Windows NT port of their popular UNIX benchmark IOGEN. NTIOGEN is the parent processes that spawns the specified number of IOGEN processes that actually do the I/O.
The program will display as output the number of processes, the average response time, the number of I/O operations per second, and the number of KBytes per second. You can download mirror copy of Ntiogen here
There are plenty of other GUI and Console HDD Benchmarking Win Tools, i.e.:
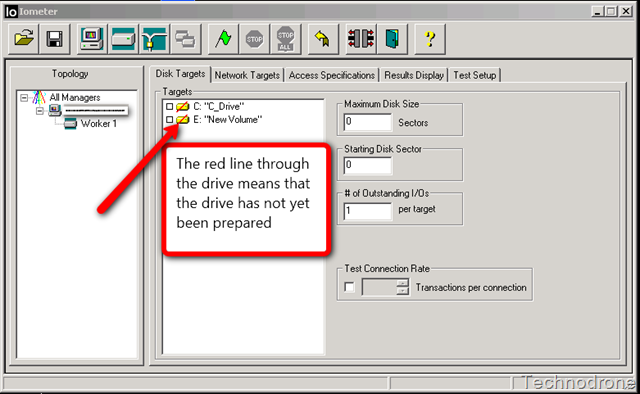
IOMeter (ex-developed by Intel and now abandoned available as open source available on SourceForge)
Bench32 – Comprehensive benchmark that measures overall system performance under Windows NT or Windows 95, now obsolete not developed anymore abandoned by producer company.
ThreadMark32 – capable of bench (ex developed and supported by ADAPTEC) but also already unsupported
IOZone – filesystem benchmark tool. The benchmark generates and measures a variety of file operations. Iozone has been ported to many machines and runs under many operating systems.
N! B! Important note to make here is above suggested tools will provide you more realistic results than the proprietary vendor tools shipped by your hardware vendor. Using proprietary software produced by a single vendor makes it impossible to analyze and compare different hardwares, above HDD benchmarking tools are for "open systems", e.g. nomatter what the hardware producer is produced results can be checked against each other.
Another thing to consider is even though if you use any of above tools to test and compare two storage devices still results will be partially imaginary, its always best to conduct tests in Real Working Application Environments. If you're planning to launch a new services structure always test it first and don't rely on preliminary returned soft benchmarks.
if you know some other useful benchmarking software i'm missing please share.
Tags: ADAPTEC, ATTO, benchmarking, check, Disk Benchmark, Disk Benchmarking, Flash, freeware, hard disk, hardware, hardware vendor, hdd, host, industry, IOGEN, number, performance, proprietary software, queue, software, speed, storage, Supports, system, test, testing, threads, transfer, utility, Windows
Posted in Everyday Life, System Administration, Windows | No Comments »
Thursday, May 15th, 2014 
If you're working in a middle or big sized IT company or corporation like IBM or HP, you're already sucked into the Outlook "mail whirlwind of corporate world" and daily flooded with tons of corporate spam emails with fuzzy business random terms like taken from Corporate Bullshit Generator
Many corporations, because probably of historic reasons still provide employees with small sized mailboxes half a gigabyte, a gigabyte or even in those with bigger user Mailboxes like in Hewlett Packard, this is usually no more than 2 Gigabytes.
This creates a lot of issues in the long term because usually mail communication in Inbox, Sent Items, Drafts Conversation History, Junk Email and Outbox grows up quickly and for a year or a year and a half, available Mail space fills up and you stop receiving email communication from customers. This is usually not too big problem if your Mailbox gets filled when you're in the Office (in office hours). However it is quite unpleasent and makes very bad impression to customers when you're in a few weeks Summar Holiday with no access to your mailbox and your Mailbox free space depletes, then you don't get any mail from the customer and all the time the customer starts receiving emails disrupting your personal or company image with bouncing messages saying the "INBOX" is full.
To prevent this worst case scenario it is always a good idea to archive old mail communication (Items) to free up space in Outlook 2010 mailbox.
Old Outlook Archived mail is (Saved) exported in .PST outlook data file format. Later exported Mail Content and Contacts could be easily (attached) from those .pst file to Outlook Express, leaving you possibility to still have access to your old archived mail keeping the content on your hard drive instead on the Outlook Exchange Mailserver (freeing up space from your Inbox).
Here is how to archive your Outlook mail Calendar and contacts:
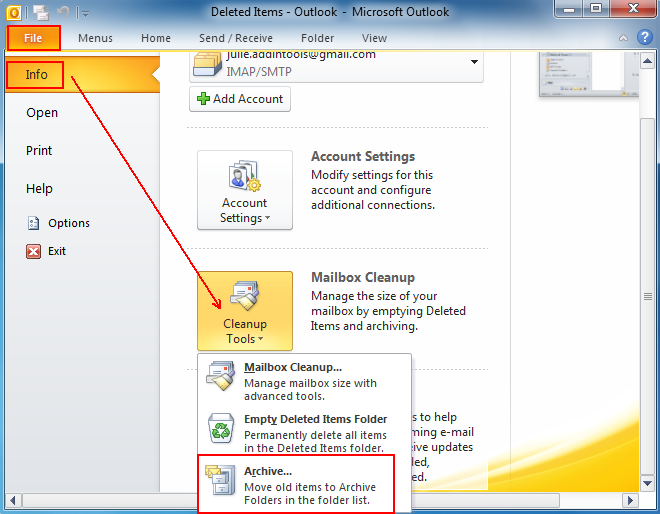
1. Click on the "File" tab on the top horizontal bar.Select "Cleanup Tools" from the options.
2. Click "Cleanup Tools" from the options.
3. Click on the "Archive this folder and all subfolders" option.
4. Select what to archive (e.g. Inbox, Drafts, Sent Items, Calendar whatever …)
5. Choose archive items older than (this is quite self-explanatory)
6. Select the location of your archive file (make sure you palce the .PST file into directory you will not forget later)
That's all now you have old mails freed up from Outlook Exchange server. Now make sure you create regular backups ot old-archived-mail.pst file you just created, it is a very good idea to upload this folder to encrypted file system on USB stick or use something like TrueCrypt to encrypt the file and store it to external hard drive, if you already don't have a complete backup corporate solution backuping up all your Laptop content.
Later Attaching or detaching exported .PST file in Outlook is done from:
File -> Open -> Open Outlook Data File
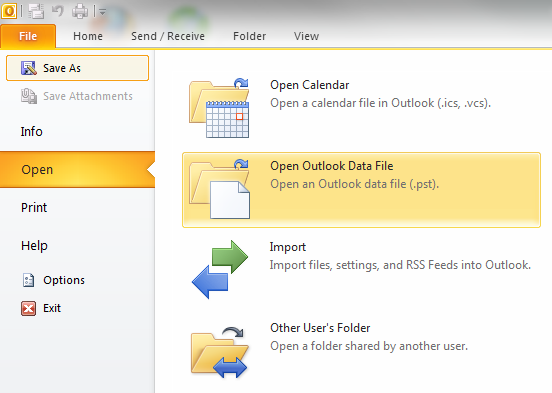
Once .PST file is opened and attached in Left Inbox pane you will have the Archived old mail folder appear.
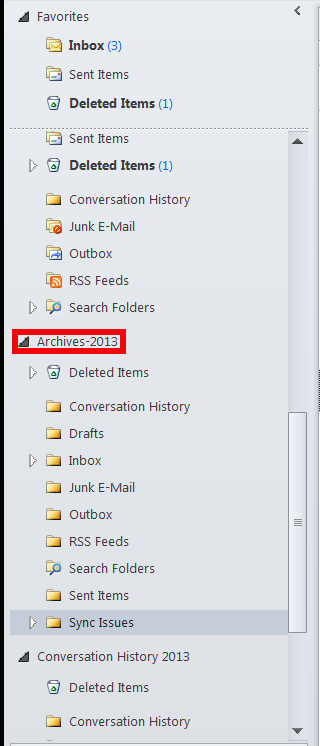
You can change Archived name (like I did to some meaningful name) like I've change it to Archives-2013 by right clicking on it (Data File properties -> Advanced)
Tags: archive, Archive Outlook, Click Cleanup Tools, data, Drafts Conversation History, drive, external hard drive, file, file format, free space, good, hard drive, hp, ibm, idea, IT, location, mail, mailboxes, middle, possibility, PST, Select Cleanup Tools, Sent Items, system, USB, working, year
Posted in Everyday Life, Outlook, Various, Windows | 1 Comment »
Friday, May 16th, 2014 
I juset setup a VMWare Virtual Machine on my HP notebook and installed Debian 7.0 stable Wheezy. Though VMWare identified my Office Internet and configured automatically NAT, I couldn't access the internet from a browser until I remembered all HP traffic is going through a default set browser proxy.
After setting a proxy to Iceweasel, Internet pages started opening normally, however as every kind of traffic was also accessible via HP's proxy, package management with apt-get (apt-get update, apt-get install etc. were failing with errors):
# apt-get update
Ign cdrom://[Debian GNU/Linux 7.2.0 _Wheezy_ – Official i386 CD Binary-1 20131012-12:56] wheezy Release.gpg
Ign cdrom://[Debian GNU/Linux 7.2.0 _Wheezy_ – Official i386 CD Binary-1 20131012-12:56] wheezy Release
Ign cdrom://[Debian GNU/Linux 7.2.0 _Wheezy_ – Official i386 CD Binary-1 20131012-12:56] wheezy/main i386 Packages/DiffIndex
Ign cdrom://[Debian GNU/Linux 7.2.0 _Wheezy_ – Official i386 CD Binary-1 20131012-12:56] wheezy/main Translation-en_US
Err http://ftp.by.debian.org wheezy Release.gpg
Could not connect to ftp.by.debian.org:80 (86.57.151.3). – connect (111: Connection refused)
Err http://ftp.by.debian.org wheezy-updates Release.gpg
Unable to connect to ftp.by.debian.org:http:
Err http://security.debian.org wheezy/updates Release.gpg
Cannot initiate the connection to security.debian.org:80 (2607:ea00:101:3c0b:207:e9ff:fe00:e595). – connect (101: Network is unreachable) [IP: 2607:ea00:101:3c0b:207:e9ff:fe00:e595 80]
Reading package lists…
This error is caused because apt-get is trying to directly access above http URLs and because port 80 is filtered out from HP Office, it fails in order to make it working I had to configure apt-get to use Proxy host – here is how:
a) Create /etc/apt/apt.conf.d/02proxy file (if not already existing)
and place inside:
Acquire::http::proxy::Proxy "https://web-proxy.cce.hp.com";
Acquire::ftp::proxy::Proxy "ftp://web-proxy.cce.hp.com";
To do it from console / gnome-terminal issue:
echo ''Acquire::http::Proxy "https://web-proxy.cce.hp.com:8088";' >> /etc/apt/apt.conf.d/02proxy

echo ''Acquire::ftp::Proxy "https://web-proxy.cce.hp.com:8088";' >> /etc/apt/apt.conf.d/02proxy
That's all now apt-get will tunnel all traffic via HTTP and FTP proxy host web-proxy.cce.hp.com and apt-get works again.
Talking about Proxyfing Linux's apt-get, its possible to also set proxy shell variables, which are red and understood by many console programs like Console browsers lynx, links, elinks as well as wget and curl commands, e.g.:
export http_proxy=http://192.168.1.5:5187/

export https_proxy=$http_proxy

export ftp_proxy=$http_proxy

export rsync_proxy=$http_proxy

export no_proxy="localhost,127.0.0.1,localaddress,.localdomain.com"
For proxies protected with username and password export variables should look like so:
 echo -n "username:"

read -e username

echo -n "password:"

read -es password

export http_proxy="http://$username:$password@proxyserver:8080/"

export https_proxy=$http_proxy

export ftp_proxy=$http_proxy

export rsync_proxy=$http_proxy

export no_proxy="localhost,127.0.0.1,localaddress,.localdomain.com"
To make this Linux proxy settings system wide on Debian / Ubuntu there is the /etc/environment file add to it:
http_proxy=http://proxy.server.com:8080/

https_proxy=http://proxy.server.com:8080/

ftp_proxy=http://proxy.server.com:8080/

no_proxy="localhost,127.0.0.1,localaddress,.localdomain.com"

HTTP_PROXY=http://proxy.server.com:8080/

HTTPS_PROXY=http://proxy.server.com:8080/

FTP_PROXY=http://proxy.server.com:8080/

NO_PROXY="localhost,127.0.0.1,localaddress,.localdomain.com"
To make proxy global (systemwide) for most (non-Debian specific) Linux distributions shell environments create new file /etc/profile.d/proxy.sh and place something like:
function proxy(){

echo -n "username:"

read -e username

echo -n "password:"

read -es password

export http_proxy="http://$username:$password@proxyserver:8080/"

export https_proxy=$http_proxy

export ftp_proxy=$http_proxy

export rsync_proxy=$http_proxy

export no_proxy="localhost,127.0.0.1,localaddress,.localdomain.com"

echo -e "nProxy environment variable set."

}

function proxyoff(){

unset HTTP_PROXY

unset http_proxy

unset HTTPS_PROXY

unset https_proxy

unset FTP_PROXY

unset ftp_proxy

unset RSYNC_PROXY

unset rsync_proxy

echo -e "nProxy environment variable removed."

}
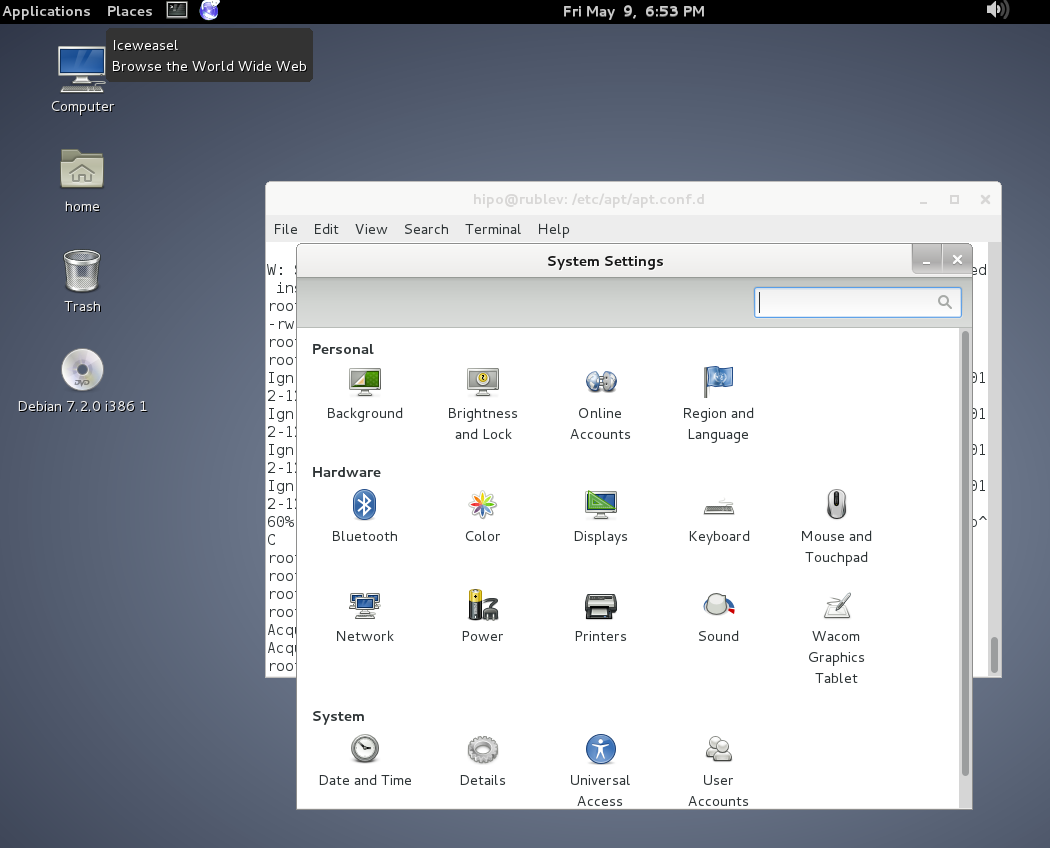
To set Global Proxy (make Proxy Systemwide) for a user in GNOME Desktop environment launch gnome-control-center
And go to Network -> Network Proxy
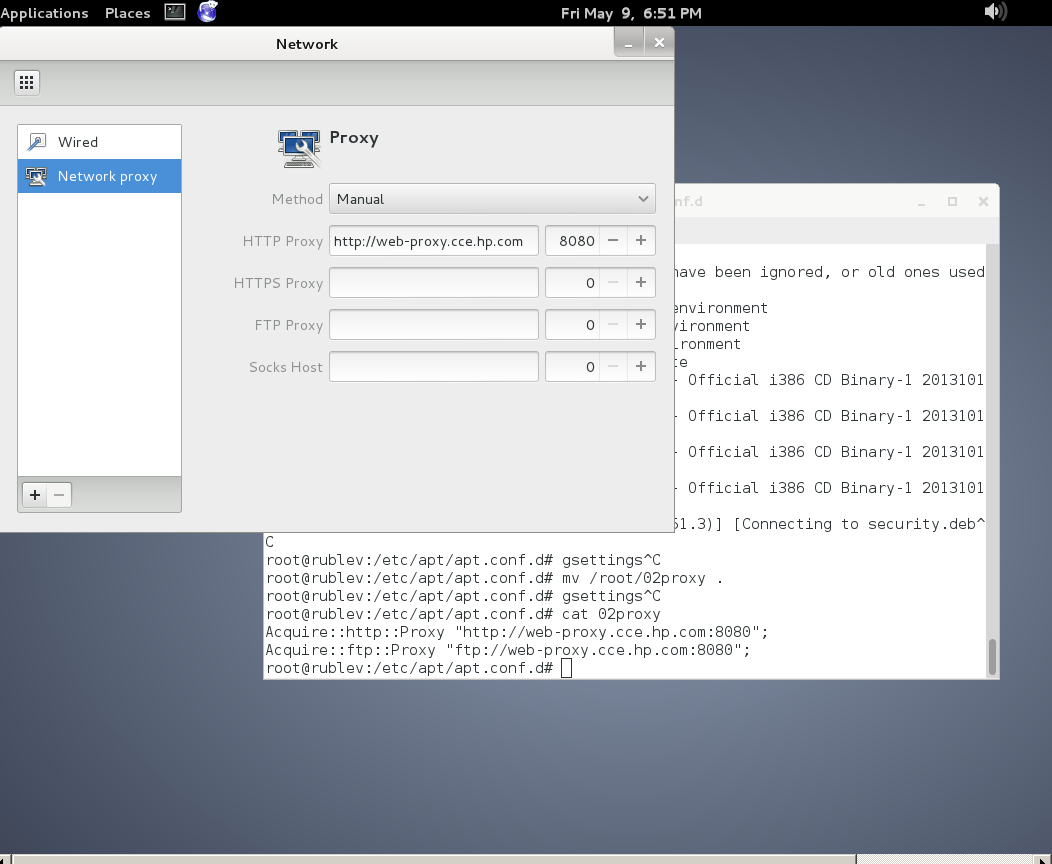
To make proxy settings also system wide for some GUI Gnome GTK3 applications
gsettings set org.gnome.system.proxy mode 'manual'

gsettings set org.gnome.system.proxy.http host 'your-proxy.server.com'

gsettings set org.gnome.system.proxy.http port 8080
Tags: browser, com, conf, Debian, export, Gnome, hp, Linux, localdomain, make, org, proxy, proxy settings, Proxy Systemwide, reading package, server, system, Ubuntu, variables
Posted in Linux, Linux and FreeBSD Desktop, Various | No Comments »
Wednesday, May 21st, 2014 
In Linux to check uptime there is the uptime command, so how is it possible to check your system uptime – e.g. check when was last time Windows host was rebooted?
Or in other words what is Windows server equivalent to Linux's uptime command?
To check uptime on Windows OS, there is the:
net statistics server
command a shorter reference to this command is
net stats srv
To run it quickest way is to press Windows (button)+r type cmd.exe and exec command in Windows command prompt:
C:UsersGeorgi>net statistics server

Server Statistics for \SM07862
Statistics since 21.05.2014 09:55:21
Sessions accepted 1

Sessions timed-out 0

Sessions errored-out 0
Kilobytes sent 0

Kilobytes received 0
Mean response time (msec) 0
System errors 0

Permission violations 0

Password violations 0
Files accessed 0

Communication devices accessed 0

Print jobs spooled 0
Times buffers exhausted
Big buffers 0

Request buffers 0
The command completed successfully.
C:UsersGeorgi>
Statistics since 21.05.2014 09:55:21 – shows when system booted last time, so to check the difference between current time and when system booted last – you need to check current time with time command
C:UsersGeorgi>time

The current time is: 16:59:26,60

Enter the new time:
Alternative command to check when Windows system booted is:
C:UsersGeorgi>systeminfo|findstr "System Boot Time"

System Boot Time: 21.05.2014, 09:54:11

System Manufacturer: HP

System Model: ProLiant BL460c G7

System Type: x64-based PC

System Directory: C:Windowssystem32

Boot Device: DeviceHarddiskVolume1

System Locale: de;German (Germany)

Time Zone: (UTC+01:00) Amsterdam, Berlin, Bern, Rome, Stockholm, Vienna
C:UsersGeorgi>
If you want to check Windows boot time "the Windows way" through the GUI, launch Windows Task Manager – run taskmgr command and go to Performance tab
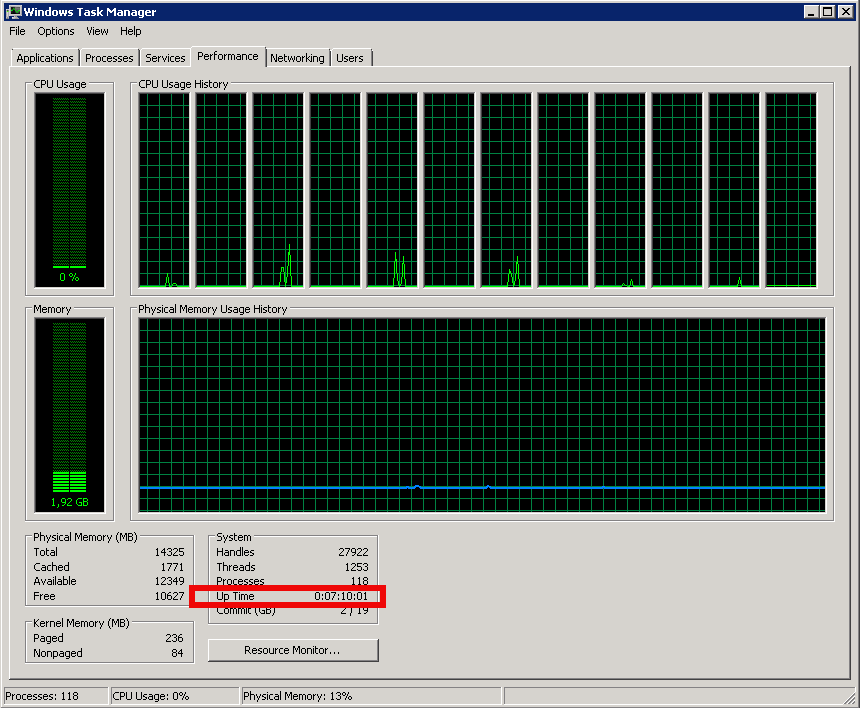
Tags: buffers, check, command, current time, GUI, How to, last, last time, microsoft windows, net, Print, server, Server Statistics, sessions, statistics, system, system boot time, time, Windows
Posted in Everyday Life, System Administration, Various, Windows | No Comments »
Friday, May 23rd, 2014 
If you happen to have the rare case of having a hung MAC OS X application and you're coming from a Linux / Windows background you will be certainly wonderhing how to kill Mac OS X hung application.
In Mac OS the 3 golden buttons to kill crashed application are:
COMMAND + OPTION + ESCAPE
Command + Option + Escape
while pressed simultaneously is the Mac Computer equivalent of Windows CTRL + ALT + DEL
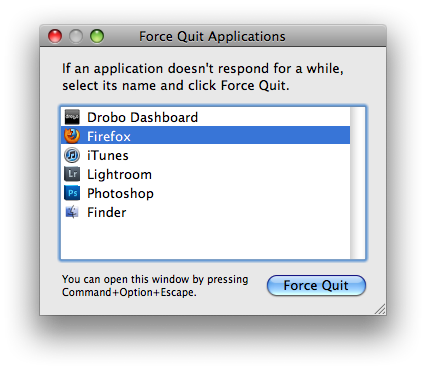
Holding together COMMAND + OPTION + ESCAPE on MAC OS brings up the Force Quit Window showing and letting you choose between the list of open applications. To close freezed MAC application, choose it and Press the Force Quit Button this will kill immediately that application.
To directly end application without invoking the choose Force Quit Window menu, to force a hanging app quit right click on its icon in Dock (CTRL + Click) and choose "Force Quit” from context menu.
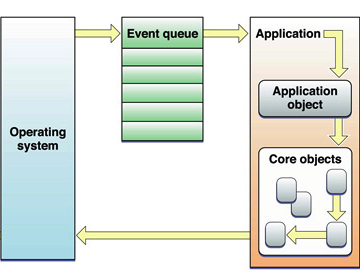
A little bit more on why applications hung in MAC OS. Each application in MAC OS has its event queue. Event queue is created on initial application launch, event queue is buffer that accepts input from system (could be user input from kbd or mouse, messages passed from other programs etc.). Program is hanging when system detects queued events are not being used.
Other reasons for Mac OS hanging program is whether you're attaching detaching new hardware peripherals (i.e. problems caused by improper mount / unmounts), same hang issues are often observed on BSD and Linux. Sometimes just re-connecting (mouse, external hdd etc.) resolves it.
Program hungs due to buggy software are much rarer in Macs just like in IPhones and Ipads due to fact mac applications are very well tested until published in appstore.
Issues with program hungs in Mac sometimes happen after "sleep mode" during "system wake" function – closing, opening macbook. If a crashed program is of critical importance and you don't want to "Force Quit" with COMMAND + OPTION + ESC. Try send PC to sleep mode for a minute or 2 by pressing together OPTION + COMMAND + EJECT.
An alternative approach to solve hanging app issue is to Force-quit Finder and Dock to try that, launch Terminal
And type there:
# killall Dock
Other useful to know Mac OS keyboard combination is COMMAND + OPTION + POWER – Hold together Command and Option and after a while press Power – This is a shortcut to instruct your Mac PC to reboot.
Tags: application, BSD, case, close, event, external hdd, Force Quit, Force Quit Window, kill, Linux, linux windows, MAC, Mac Computer, new hardware, Press, program, queue, rare case, Restart, sleep, system
Posted in Curious Facts, Everyday Life, Mac OS X, System Administration, Various | 1 Comment »
Thursday, June 5th, 2014 
Whether you had to install a CentOS server in a DMZ-ed network with paranoic system firewall rules or simply you want to use your own created RPM local repository to run RPM installs and CentOS system updates via monitored Proxy you will have to configure yum to use a proxy.
There is a standard way to do it by adding a proxy directive to /etc/yum.conf as explained in CentOS official documetnation.
However for some reason:
proxy=http://your-proxy-url.com:8080

proxy_username=yum-user

proxy_password=qwerty
proxy vars adding to /etc/yum.conf [main] section is not working on CentOS 6.5?
However there is a dirty patch by using the OS environment standard variable http_proxy
To make yum work via proxy in gnome-terminal run first:
export http_proxy=http://your-proxy-server.com:8080
or if proxy is protected by username / password run instead:
export username='yum-user'

export password='qwerty'

export http_proxy="http://$username:$password@your-proxy-server:8080/
Afterwards yum will work via the proxy, i.e.:
yum update && yum upgrade
To make http_proxy exported system wide check my previous post – Set Proxy System-Wide
Hope this helps someone.
Tags: CentOS, export, fedora linux, org, password, proxy, rhel, system, upgrade, username, www, yum
Posted in Everyday Life, Linux, System Administration, Various | No Comments »
Wednesday, June 18th, 2014 
There are plenty of GNU / Linux softwares to monitor server performance (hard disk space, network and CPU load) and general hardware health both text based for SSH console) and from web.
Just to name a few for console precious tools, such are:
And for web based Linux / Windows server monitoring my favourite tools are:
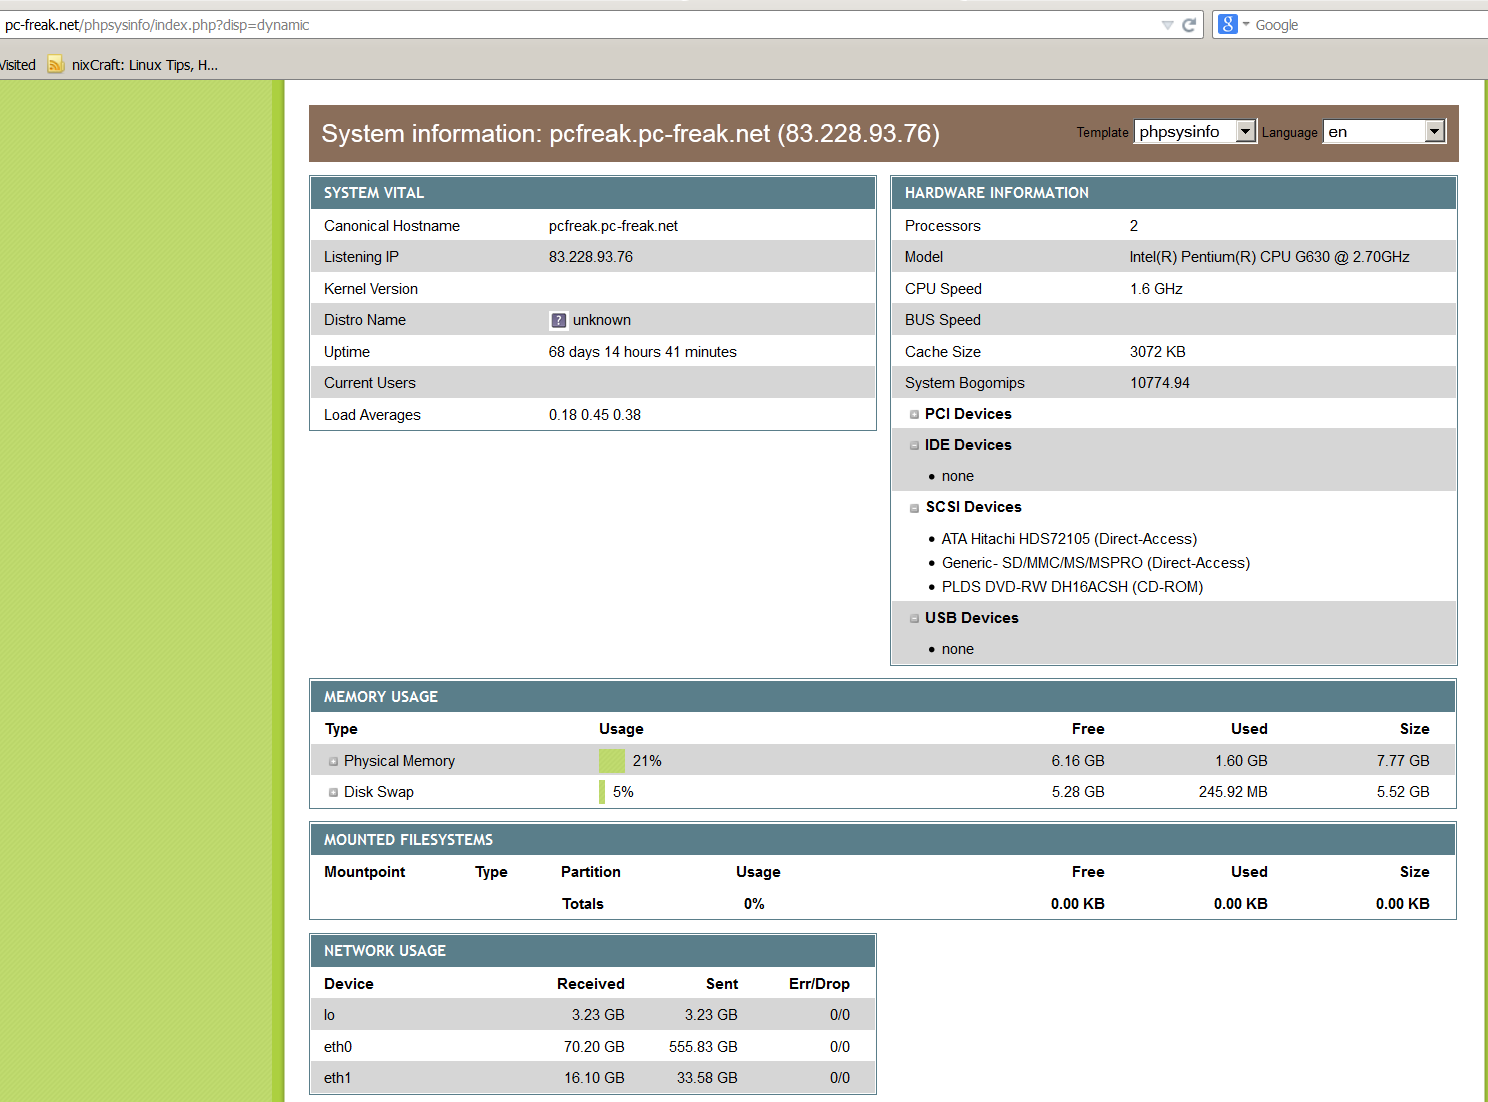
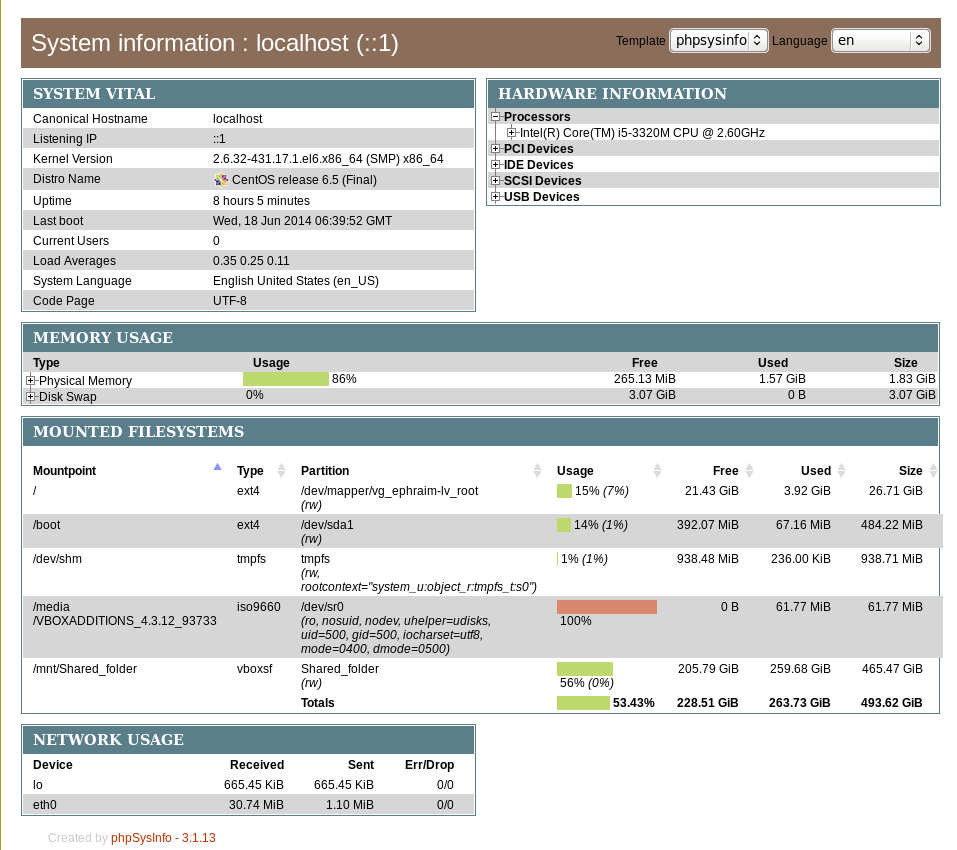
phpsysinfo is yet another web based Linux monitoring software for small companies or home router use it is perfect for people who don't want to spend time learning how to configure complicated and robust multiple server monitoring software like Nagios or Icanga.
phpsysinfo is quick and dirty way to monitor system uptime, network, disk and memory usage, get information on CPU model, attached IDEs, SCSI devices and PCIs from the web and is perfect for Linux servers already running Apache and PHP.
1. Installing PHPSysInfo on Debian, Ubuntu and deb derivative Linux-es
PHPSysInfo is very convenient and could be prefered instead of above tools for the reason it is available by default in Debian and Ubuntu package repositories and installable via apt-get and it doesn't require any further configuration, to roll it you install you place a config and you forget it.
# apt-cache show phpsysinfo |grep -i desc -A 2
Description: PHP based host information
phpSysInfo is a PHP script that displays information about the
host being accessed.
Installation is a piece of cake:
# apt-get install --yes phpsysinfo
…
Add phpsysinfo directives to /etc/apache2/conf.d/phpsysinfo.conf to make it accessible via default set Apache vhost domain under /phpsysinfo
Paste in root console:
cat > /etc/apache2/conf.d/phpsysinfo.conf <<-EOF
Alias /phpsysinfo /usr/share/phpsysinfo
<Location /phpsysinfo>
 Options None
 Order deny,allow
 Deny from all
 #Allow from localhost
 #Allow from 192.168.56.2
 Allow from all
</Location>
EOF
Above config will allow access to /phpsysinfo from any IP on the Internet, this could be a security hole, thus it is always better to either protect it with access .htaccess password login or allow it only from certain IPs, from which you will access it with something like:
Allow from 192.168.2.100
Then restart Apache server:
# /etc/init.d/apache2 restart
To access phpsysinfo monitoring gathered statistics, access it in a browser http://defaultdomain.com/phpsysinfo/
2. Installing PHPSysinfo on CentOS, Fedora and RHEL Linux
Download and untar
# cd /var/www/html

# wget https://github.com/phpsysinfo/phpsysinfo/archive/v3.1.13.tar.gz

# tar -zxvf phpsysinfo-3.1.13.tar.gz

# ln -sf phpsysinfo-3.1.13 phpsysinfo

# mv phpsysinfo.ini.new phpsysinfo.ini
Install php php-xml and php-mbstring RPM packages
yum -y install php php-xml php-mbstring

...
Start Apache web service
[root@ephraim html]# /etc/init.d/httpd restart
…
[root@ephraim html]# ps ax |grep -i http

 8816 ?        Ss     0:00 /usr/sbin/httpd

 8819 ?        S      0:00 /usr/sbin/httpd
As PhpSysInfo is written in PHP it is also possible to install phpsysinfo on Windows.
phpsysinfo is not the only available simple monitoring server performance remotely tool, if you're looking for a little bit extended information and a better visualization interface alternative to phpsysinfo take a look at linux-dash.
In context of web monitoring other 2 web PHP script tools useful in remote server monitoring are:
OpenStatus – A simple and effective resource and status monitoring script for multiple servers.
LookingGlass – User-friendly PHP Looking Glass (Web interface to use Host (Nslookup), Ping, Mtr – Matt Traceroute)
Tags: configure, default, hard disk, information, init, installation, linux windows, little bit, php, rhel, script, security hole, server performance, system, usr, web
Posted in Monitoring, System Administration, Various, Web and CMS | No Comments »
Wednesday, July 2nd, 2014 
If you get a MySQL error like:
Host '' is blocked because of many connection errors; unblock with 'mysqladmin flush-hosts'
This most likely means your PHP / Java whatever programming language application connecting to MySQL is failing to authenticate with the application created (existing) or that the application is trying too many connections to MySQL in a rate where MySQL server can't serve all the requests.
Some common errors for Too many Connection errors are:
- Networking Problem
- Server itself could be down
- Authentication Problems
- Maximum Connection Errors allowed.
The value of the max_connection_errors system variable determines how many successive interrupted connection requests are permitted to myqsl server.
Well anyways if you get the:
Host '' is blocked because of many connection errors; unblock with 'mysqladmin flush-hosts'
You can consider this a sure sign application connections to MySQLis logging a lot of error connections, for some reason.
This error could also appear on very busy websites where high amount of separete connections are used – I've seen the error occur on PHP websites whether mysql_pconnect(); is selected in favour of the prooved working mysql_connect();
The first thing to do before changing / increasing default set of max connection errors is to check how many max connection errors are set within MySQL?
For that connect with MySQL CLI and issue:
mysql> SHOW VARIABLES LIKE '%error%';
+——————–+————————————————————-+
| Variable_name | Value |
+——————–+————————————————————-+
| error_count | 0 |
| log_error | /var/log/mysql//mysqld.log |
| max_connect_errors | 10000 |
| max_error_count | 64 |
| slave_skip_errors | OFF |
+——————–+————————————————————-+
A very useful mysql cli command in debugging max connection errors reached problem is
mysql> SHOW PROCESSLIST;
To solve the error, try to tune in /etc/my.cnf, /etc/mysql/my.cnf or wherever my.cnf is located:
[mysqld]
max_connect_errors variable
and
wait_timeout var. Some reasonable variable size would be:
max_connect_errors = 100000

wait_timeout = 60
If such (anyways) high values is still not high enough you can raise mysql config connection timeout
to
max_connect_errors = 100000000
Also if you want to try raise max_connect_errors var without making it permanenty (i.e. remember var setting after MySQL service restart), set it from MySQL cli with:
SET GLOBAL max_connect_errors
If you want to keep the set default max_connection_errors and fix it temporary, you can try to follow the error
Host '' is blocked because of many connection errors; unblock with 'mysqladmin flush-hosts'
suggestion and issue in root console:
mysqladmin flush-hosts
Same could also be done from MySQL Cli with cmd:
FLUSH HOSTS;
Tags: application, cnf, config, connection, connection timeout, default, fix, issue, lot, mysqladmin, programming language, reason, setting, size, suggestion, system
Posted in Everyday Life, MySQL, System Administration, Various | 3 Comments »
Thursday, December 11th, 2014 
Recently I had a task to delete number of set variables (listed parameters) from URL address on a Apache webserver serving as Reverse Proxy.
To make it more clear exact task was when customers call the URL https://companywebsite-url.com (all subdomains included) the following URL parameters should always be deleted by the reverse proxy:
– ebppMode
– ebppObjectKey
– ebppObjectType
– ebppSystem
– logSys
The paramets are part of SAP Biller Direct in a Portal (based on the famous SAP database) which is often deployed as a component of Internet Sales (ISA) / Supplier Relationship Management (SRM) / CRM
, if a user is logged in with his Credentials (KID (Key ID) / Admin KID) into the system. The EBPP part of most variables stands for (Electronic Bill Presentment and Payment).
By passing above parameters to Website, modes of use, user accounts switched with which user is logged into the system system logs read and other stuff which can turn to be a severe security hole.
As most of Big Companies, does pass there web traffic via a "transparent" Reverse Proxy,it is a good security practice for SAP Biller Direct (including CRM systems( to wipe out this variables
Here is the mod_rewrite working rules that I used to achieve the delete variable from URL address task:
RewriteEngine On
RewriteCond %{QUERY_STRING} ^(.*)bebppMode=(w*)b(.*)
RewriteRule (.*) $1?%1%3
RewriteCond %{QUERY_STRING} ^(.*)bebppObjectKey=(w*)b(.*)
RewriteRule (.*) $1?%1%3
RewriteCond %{QUERY_STRING} ^(.*)bebppObjectType=(w*)b(.*)
RewriteRule (.*) $1?%1%3
RewriteCond %{QUERY_STRING} ^(.*)bebppSystem=(w*)b(.*)
RewriteRule (.*) $1?%1%3
RewriteCond %{QUERY_STRING} ^(.*)logSys=(w*)b(.*)
RewriteRule (.*) $1?%1%3
RewriteCond %{QUERY_STRING} ^(.*)&&(.*)
RewriteRule (.*) $1?%1%3
P.S. I've implemented above Rewrite rules into all Virtualhosts of Applications (in that case all living in the same httpd.conf on SuSE (SLES) 11 SP1 Enterprise Linux server).
To make changes affective, restarted HTTPD Webserver:
/etc/init.d/httpd restart
The sesult is:
https://companywebsite-url.com/start.html?page=start&ebppMode=A&ebppSystem=Test
leads to a internal URL redirection
https://companywebsite-url.com/start.html?page=start
without parameters ebppSystem, ebppMode, ebppObjectKey, ebppSystem, logSys .
Other mod_rewrite rule that works but is too ugly and when I tried it on Debian Linux host was behaving strange (including in the rewrited URL address the directory address of the PHP twice):
RewriteCond %{QUERY_STRING} (.*)(^|&|%26|%20)ebppMode(=|%3D)([^&]+)(.*)$ [OR]
RewriteCond %{QUERY_STRING} (.*)(^|&|%26|%20)ebppObjectKey(=|%3D)([^&]+)(.*)$ [OR]
RewriteCond %{QUERY_STRING} (.*)(^|&|%26|%20)ebppObjectType(=|%3D)([^&]+)(.*)$ [OR]
RewriteCond %{QUERY_STRING} (.*)(^|&|%26|%20)ebppSystem(=|%3D)([^&]+)(.*)$ [OR]
RewriteCond %{QUERY_STRING} (.*)(^|&|%26|%20)logSys(=|%3D)([^&]+)(.*)$
RewriteRule (.*) /$1?%1%5 [R=307]
Well anyways, with the first bunch of mod_rewrite rule it works fine.
Thanks God Problem Solved 🙂
Tags: apache reverse proxy, Big Companies, delete parameter web url, delete string from url, good security, How to, make, page, SAP, sap database security, sap security, security practice, set variables, string, system, url
Posted in Computer Security, System Administration, Web and CMS | No Comments »


