Posts Tagged ‘cat’

Monitor cluster heartbeat lines IP reahability via ping ICMP protocol with Zabbix

Wednesday, April 12th, 2023

https://pc-freak.net/images/zabbix-monitoring-icmp-ping-on-application-crm-clusters-with-userparameter-script-howto

Say you're having an haproxy load balancer cluster with two or more nodes and you are running the servers inside some complex organizational hybrid complex network that is a combination of a local DMZ lans, many switches, dedicated connectivity lines and every now and then it happens for the network to mysteriously go down. Usually simply setting monitoring on the network devices CISCO itself or the smart switches used is enough to give you an overview on what's going on but if haproxy is in the middle of the end application servers and in front of other Load balancers and network equipment sometimes it might happen that due to failure of a network equipment / routing issues or other strange unexpected reasons one of the 2 nodes connectivity might fail down via the configured dedicated additional Heartbeat lines that are usually configured in order to keep away the haproxy CRM Resource Manager cluster thus ending it up in a split brain scenarios.

Assuming that this is the case like it is with us you would definitely want to keep an eye on the connectivity of Connect Line1 and Connect Line2 inside some monitoring software like zabbix. As our company main monitoring software used to monitor our infrastructure is Zabbix in this little article, I'll briefly explain how to configre the network connectivity status change from haproxy node1 and haproxy node2 Load balancer cluster to be monitored via a simple ICMP ping echo checks.

Of course the easies way to configure an ICMP monitor via Zabbix is using EnableRemoteCommands=1 inside /etc/zabbix/zabbix-agentd.conf but if your infrastructure should be of High Security and PCI perhaps this options is prohibited to be used on the servers. This is why to achieve still the ICMP ping checks with EnableRemoteCommands=0 a separate simple bash user parameter script could be used. Read further to find out one way ICMP monitoring with a useparameter script can be achieved with Zabbix.


1. Create the userparameter check for heartbeat lines

root@haproxy1 zabbix_agentd.d]# cat userparameter_check_heartbeat_lines.conf
UserParameter=heartbeat.check,\
/etc/zabbix/scripts/check_heartbeat_lines.sh

root@haproxy2 zabbix_agentd.d]# cat userparameter_check_heartbeat_lines.conf
UserParameter=heartbeat.check,\
/etc/zabbix/scripts/check_heartbeat_lines.sh

2. Create check_heartbeat_lines.sh script which will be actually checking connectivity with simple ping

root@haproxy1 zabbix_agentd.d]# cat /etc/zabbix/scripts/check_heartbeat_lines.sh
#!/bin/bash
hb1=haproxy2-lb1
hb2=haproxy2-lb2
if ping -c 1 $hb1  &> /dev/null
then
  echo "$hb1 1"
else
  echo "$hb1 0"
fi
if ping -c 1 $hb2  &> /dev/null
then
  echo "$hb2 1"
else
  echo "$hb2 0"
fi

[root@haproxy1 zabbix_agentd.d]#

root@haproxy2 zabbix_agentd.d]# cat /etc/zabbix/scripts/check_heartbeat_lines.sh
#!/bin/bash
hb1=haproxy1-hb1
hb2=haproxy1-hb2
if ping -c 1 $hb1  &> /dev/null
then
  echo "$hb1 1"
else
  echo "$hb1 0"
fi
if ping -c 1 $hb2  &> /dev/null
then
  echo "$hb2 1"
else
  echo "$hb2 0"
fi

[root@haproxy2 zabbix_agentd.d]#


3. Test script heartbeat lines first time

Each of the nodes from the cluster are properly pingable via ICMP protocol

The script has to be run on both haproxy1 and haproxy2 Cluster (load) balancer nodes

[root@haproxy-hb1 zabbix_agentd.d]# /etc/zabbix/scripts/check_heartbeat_lines.sh
haproxy2-hb1 1
haproxy2-hb2 1

[root@haproxy-hb2 zabbix_agentd.d]# /etc/zabbix/scripts/check_heartbeat_lines.sh
haproxy1-hb1 1
haproxy1-hb2 1


The status of 1 returned by the script should be considered remote defined haproxy node is reachable / 0 means ping command does not return any ICMP status pings back.

4. Restart the zabbix-agent on both cluster node machines that will be conducting the ICMP ping check

[root@haproxy zabbix_agentd.d]# systemctl restart zabbix-agentd
[root@haproxy zabbix_agentd.d]# systemctl status zabbix-agentd

[root@haproxy zabbix_agentd.d]# tail -n 100 /var/log/zabbix_agentd.log


5. Create Item to process the userparam script

Create Item as follows:

6. Create the Dependent Item required
 

zabbix-heartbeat-check-screenshots/heartbeat-line1-preprocessing

For processing you need to put the following simple regular expression

Name: Regular Expression
Parameters: hb1(\s+)(\d+)
Custom on fail: \2

zabbix-heartbeat-check-screenshots/heartbeat-line2-preprocessing1

zabbix-heartbeat-check-screenshots/heartbeat-lines-triggers


7. Create triggers that will be generating the Alert

Create the required triggers as well

zabbix-heartbeat-check-screenshots/heartbeat2-line
Main thing to configure here in Zabbix is below expression

Expression: {FQDN:heartbeat2.last()}<1

triggers_heartbeat1

You can further configure Zabbix Alerts to mail yourself or send via Slack / MatterMost or Teams alarms in case of problems.

Configure aide file integrity check server monitoring in Zabbix to track for file changes on servers

Tuesday, March 28th, 2023

zabbix-aide-log-monitoring-logo

Earlier I've written a small article on how to setup AIDE monitoring for Server File integrity check on Linux, which put the basics on how this handy software to improve your server overall Security software can be installed and setup without much hassle.

Once AIDE is setup and a preset custom configuration is prepared for AIDE it is pretty useful to configure AIDE to monitor its critical file changes for better server security by monitoring the AIDE log output for new record occurs with Zabbix. Usually if no files monitored by AIDE are modified on the machine, the log size will not grow, but if some file is modified once Advanced Linux Intrusion Detecting (aide) binary runs via the scheduled Cron job, the /var/log/app_aide.log file will grow zabbix-agentd will continuously check the file for size increases and will react.

Before setting up the Zabbix required Template, you will have to set few small scripts that will be reading a preconfigured list of binaries or application files etc. that aide will monitor lets say via /etc/aide-custom.conf
 

1. Configure aide to monitor files for changes


Before running aide, it is a good idea to prepare a file with custom defined directories and files that you plan to monitor for integrity checking e.g. future changes with aide, for example to capture bad intruders who breaks into server which runs aide and modifies critical files such as /etc/passwd /etc/shadow /etc/group or / /usr/local/etc/* or /var/* / /usr/* critical files that shouldn't be allowed to change without the admin to soon find out.

# cat /etc/aide-custom.conf

# Example configuration file for AIDE.
@@define DBDIR /var/lib/aide
@@define LOGDIR /var/log/aide
# The location of the database to be read.
database=file:@@{DBDIR}/app_custom.db.gz
database_out=file:@@{DBDIR}/app_aide.db.new.gz
gzip_dbout=yes
verbose=5

report_url=file:@@{LOGDIR}/app_custom.log
#report_url=syslog:LOG_LOCAL2
#report_url=stderr
#NOT IMPLEMENTED report_url=mailto:root@foo.com
#NOT IMPLEMENTED report_url=syslog:LOG_AUTH

# These are the default rules.
#
#p:      permissions
#i:      inode:
#n:      number of links
#u:      user
#g:      group
#s:      size
#b:      block count
#m:      mtime
#a:      atime
#c:      ctime
#S:      check for growing size
#acl:           Access Control Lists
#selinux        SELinux security context
#xattrs:        Extended file attributes
#md5:    md5 checksum
#sha1:   sha1 checksum
#sha256:        sha256 checksum
#sha512:        sha512 checksum
#rmd160: rmd160 checksum
#tiger:  tiger checksum

#haval:  haval checksum (MHASH only)
#gost:   gost checksum (MHASH only)
#crc32:  crc32 checksum (MHASH only)
#whirlpool:     whirlpool checksum (MHASH only)

FIPSR = p+i+n+u+g+s+m+c+acl+selinux+xattrs+sha256

#R:             p+i+n+u+g+s+m+c+acl+selinux+xattrs+md5
#L:             p+i+n+u+g+acl+selinux+xattrs
#E:             Empty group
#>:             Growing logfile p+u+g+i+n+S+acl+selinux+xattrs

# You can create custom rules like this.
# With MHASH…
# ALLXTRAHASHES = sha1+rmd160+sha256+sha512+whirlpool+tiger+haval+gost+crc32
ALLXTRAHASHES = sha1+rmd160+sha256+sha512+tiger
# Everything but access time (Ie. all changes)
EVERYTHING = R+ALLXTRAHASHES

# Sane, with multiple hashes
# NORMAL = R+rmd160+sha256+whirlpool
NORMAL = FIPSR+sha512

# For directories, don't bother doing hashes
DIR = p+i+n+u+g+acl+selinux+xattrs

# Access control only
PERMS = p+i+u+g+acl+selinux

# Logfile are special, in that they often change
LOG = >

# Just do sha256 and sha512 hashes
LSPP = FIPSR+sha512

# Some files get updated automatically, so the inode/ctime/mtime change
# but we want to know when the data inside them changes
DATAONLY =  p+n+u+g+s+acl+selinux+xattrs+sha256

##############TOUPDATE
#To delegate to app team create a file like /app/aide.conf
#and uncomment the following line
#@@include /app/aide.conf
#Then remove all the following lines
/etc/zabbix/scripts/check.sh FIPSR
/etc/zabbix/zabbix_agentd.conf FIPSR
/etc/sudoers FIPSR
/etc/hosts FIPSR
/etc/keepalived/keepalived.conf FIPSR
# monitor haproxy.cfg
/etc/haproxy/haproxy.cfg FIPSR
# monitor keepalived
/home/keepalived/.ssh/id_rsa FIPSR
/home/keepalived/.ssh/id_rsa.pub FIPSR
/home/keepalived/.ssh/authorized_keys FIPSR

/usr/local/bin/script_to_run.sh FIPSR
/usr/local/bin/another_script_to_monitor_for_changes FIPSR

#  cat /usr/local/bin/aide-config-check.sh
#!/bin/bash
/sbin/aide -c /etc/aide-custom.conf -D

# cat /usr/local/bin/aide-init.sh
#!/bin/bash
/sbin/aide -c /etc/custom-aide.conf -B database_out=file:/var/lib/aide/custom-aide.db.gz -i


# cat /usr/local/bin/aide-check.sh

#!/bin/bash
/sbin/aide -c /etc/custom-aide.conf -Breport_url=stdout -B database=file:/var/lib/aide/custom-aide.db.gz -C|/bin/tee -a /var/log/aide/custom-aide-check.log|/bin/logger -t custom-aide-check-report
/usr/local/bin/aide-init.sh


# cat /usr/local/bin/aide_app_cron_daily.txt

#!/bin/bash
#If first time, we need to init the DB
if [ ! -f /var/lib/aide/app_aide.db.gz ]
   then
    logger -p local2.info -t app-aide-check-report  "Generating NEW AIDE DATABASE for APPLICATION"
    nice -n 18 /sbin/aide –init -c /etc/aide_custom.conf
    mv /var/lib/aide/app_aide.db.new.gz /var/lib/aide/app_aide.db.gz
fi

nice -n 18 /sbin/aide –update -c /etc/aide_app.conf
#since the option for syslog seems not fully implemented we need to push logs via logger
/bin/logger -f /var/log/aide/app_aide.log -p local2.info -t app-aide-check-report
#Acknoledge the new database as the primary (every results are sended to syslog anyway)
mv /var/lib/aide/app_aide.db.new.gz /var/lib/aide/app_aide.db.gz

What above cron job does is pretty simple, as you can read it yourself. If the configuration predefined aide database store file /var/lib/aide/app_aide.db.gz, does not
exists aide will create its fresh empty database and generate a report for all predefined files with respective checksums to be stored as a comparison baseline for file changes. 

Next there is a line to write aide file changes via rsyslog through the logger and local2.info handler


2. Setup Zabbix Template with Items, Triggers and set Action

2.1 Create new Template and name it YourAppName APP-LB File integrity Check

aide-itengrity-check-zabbix_ Configuration of templates

Then setup the required Items, that will be using zabbix's Skip embedded function to scan file in a predefined period of file, this is done by the zabbix-agent that is
supposed to run on the server.

2.2 Configure Item like

aide-zabbix-triggers-screenshot
 

*Name: check aide log file

Type: zabbix (active)

log[/var/log/aide/app_aide.log,^File.*,,,skip]

Type of information: Log

Update Interval: 30s

Applications: File Integrity Check

Configure Trigger like

Enabled: Tick On

images/aide-zabbix-screenshots/check-aide-log-item


2.3 Create Triggers with the respective regular expressions, that would check the aide generated log file for file modifications


aide-zabbix-screenshot-minor-config

Configure Trigger like
 

Enabled: Tick On


*Name: Someone modified {{ITEM.VALUE}.regsub("(.*)", \1)}

*Expression: {PROD APP-LB File Integrity Check:log[/var/log/aide/app_aide.log,^File.*,,,skip].strlen()}>=1

Allow manual close: yes tick

*Description: Someone modified {{ITEM.VALUE}.regsub("(.*)", \1)} on {HOST.NAME}


2.4 Configure Action


aide-zabbix-file-monitoring-action-screensho

Now assuming the Zabbix server has  a properly set media for communication and you set Alerting rules zabbix-server can be easily set tosend mails to a Support email to get Notifications Alerts, everytime a monitored file by aide gets changed.

That's all folks ! Enjoy being notified on every file change on your servers  !
 

How to configure multiple haproxies and frontends to log in separate log files via rsyslog

Monday, September 5th, 2022

log-multiple-haproxy-servers-to-separate-files-log-haproxy-froentend-to-separate-file-haproxy-rsyslog-Logging-diagram
In my last article How to create multiple haproxy instance separate processes for different configuration listeners,  I've shortly explained how to create a multiple instances of haproxies by cloning the systemd default haproxy.service and the haproxy.cfg to haproxyX.cfg.
But what if you need also to configure a separate logging for both haproxy.service and haproxy-customname.service instances how this can be achieved?

The simplest way is to use some system local handler staring from local0 to local6, As local 1,2,3 are usually used by system services a good local handler to start off would be at least 4.
Lets say we already have the 2 running haproxies, e.g.:

[root@haproxy2:/usr/lib/systemd/system ]# ps -ef|grep -i hapro|grep -v grep
root      128464       1  0 Aug11 ?        00:01:19 /usr/sbin/haproxy -Ws -f /etc/haproxy/haproxy.cfg -p /run/haproxy.pid -S /run/haproxy-master.sock
haproxy   128466  128464  0 Aug11 ?        00:49:29 /usr/sbin/haproxy -Ws -f /etc/haproxy/haproxy.cfg -p /run/haproxy.pid -S /run/haproxy-master.sock

root      346637       1  0 13:15 ?        00:00:00 /usr/sbin/haproxy-customname-wrapper -Ws -f /etc/haproxy/haproxy_customname_prod.cfg -p /run/haproxy_customname_prod.pid -S /run/haproxy-customname-master.sock
haproxy   346639  346637  0 13:15 ?        00:00:00 /usr/sbin/haproxy-customname-wrapper -Ws -f /etc/haproxy/haproxy_customname_prod.cfg -p /run/haproxy_customname_prod.pid -S /run/haproxy-customname-master.sock


1. Configure local messaging handlers to work via /dev/log inside both haproxy instance config files
 

To congigure the separte logging we need to have in /etc/haproxy/haproxy.cfg and in /etc/haproxy/haproxy_customname_prod.cfg the respective handlers.

To log in separate files you should already configured in /etc/haproxy/haproxy.cfg something like:


global
        stats socket /var/run/haproxy/haproxy.sock mode 0600 level admin #Creates Unix-Like socket to fetch stats
        log /dev/log    local0
        log /dev/log    local1 notice

#       nbproc 1
#       nbthread 2
#       cpu-map auto:1/1-2 0-1
        nbproc          1
        nbthread 2
        cpu-map         1 0
        cpu-map         2 1
        chroot /var/lib/haproxy
        user haproxy
        group haproxy
        daemon
        maxconn 99999

defaults
        log     global
        mode    tcp


        timeout connect 5000
        timeout connect 30s
        timeout server 10s

    timeout queue 5s
    timeout tunnel 2m
    timeout client-fin 1s
    timeout server-fin 1s

    option forwardfor
        maxconn 3000
    retries                 15

frontend http-in
        mode tcp

        option tcplog
        log global


        option logasap
        option forwardfor
        bind 0.0.0.0:80

default_backend webservers_http
backend webservers_http
    fullconn 20000
        balance source
stick match src
    stick-table type ip size 200k expire 30m

        server server-1 192.168.1.50:80 check send-proxy weight 255 backup
        server server-2 192.168.1.54:80 check send-proxy weight 254
        server server-3 192.168.0.219:80 check send-proxy weight 252 backup
        server server-4 192.168.0.210:80 check send-proxy weight 253 backup
        server server-5 192.168.0.5:80 maxconn 3000 check send-proxy weight 251 backup

For the second /etc/haproxy/haproxy_customname_prod.cfg the logging configuration should be similar to:
 

global
        stats socket /var/run/haproxy/haproxycustname.sock mode 0600 level admin #Creates Unix-Like socket to fetch stats
        log /dev/log    local5
        log /dev/log    local5 notice

#       nbproc 1
#       nbthread 2
#       cpu-map auto:1/1-2 0-1
        nbproc          1
        nbthread 2
        cpu-map         1 0
        cpu-map         2 1
        chroot /var/lib/haproxy
        user haproxy
        group haproxy
        daemon
        maxconn 99999

defaults
        log     global
        mode    tcp


2. Configure separate haproxy Frontend logging via local5 inside haproxy.cfg
 

As a minimum you need a configuration for frontend like:


frontend http-in
        mode tcp

        option tcplog
        log /dev/log    local5 debug
…..
….

..
.

Of course the mode tcp in my case is conditional you might be using mode http etc. 


3. Optionally but (preferrably) make local5 / local6 handlers to work via rsyslogs UDP imudp protocol


In this example /dev/log is straightly read by haproxy instead of sending the messages first to rsyslog, this is a good thing in case if you have doubts that rsyslog might stop working and respectively you might end up with no logging, however if you prefer to use instead rsyslog which most of people usually do you will have instead for /etc/haproxy/haproxy.cfg to use config:

global
    log          127.0.0.1 local6 debug

defaults
        log     global
        mode    tcp

And for /etc/haproxy_customname_prod.cfg config like:

global
    log          127.0.0.1 local5 debug

defaults
        log     global
        mode    tcp

If you're about to send the haproxy logs directly via rsyslog, it should have enabled in /etc/rsyslog.conf the imudp module if you're not going to use directly /dev/log

# provides UDP syslog reception
module(load="imudp")
input(type="imudp" port="514")


4. Prepare first and second log file and custom frontend output file and set right permissions
 

Assumably you already have /var/log/haproxy.log and this will be the initial haproxy log if you don't want to change it, normally it is installed on haproxy package install time on Linux and should have some permissions like following:

root@haproxy2:/etc/rsyslog.d# ls -al /var/log/haproxy.log
-rw-r–r– 1 haproxy haproxy 6681522  1 сеп 16:05 /var/log/haproxy.log


To create the second config with exact permissions like haproxy.log run:

root@haproxy2:/etc/rsyslog.d# touch /var/log/haproxy_customname.log
root@haproxy2:/etc/rsyslog.d# chown haproxy:haproxy /var/log/haproxy_customname.log

Create the haproxy_custom_frontend.log file that will only log output of exact frontend or match string from the logs
 

root@haproxy2:/etc/rsyslog.d# touch  /var/log/haproxy_custom_frontend.log
root@haproxy2:/etc/rsyslog.d# chown haproxy:haproxy  /var/log/haproxy_custom_frontend.log


5. Create the rsyslog config for haproxy.service to log via local6 to /var/log/haproxy.log
 

root@haproxy2:/etc/rsyslog.d# cat 49-haproxy.conf
# Create an additional socket in haproxy's chroot in order to allow logging via
# /dev/log to chroot'ed HAProxy processes
$AddUnixListenSocket /var/lib/haproxy/dev/log

# Send HAProxy messages to a dedicated logfile
:programname, startswith, "haproxy" {
  /var/log/haproxy.log
  stop
}


Above configs will make anything returned with string haproxy (e.g. proccess /usr/sbin/haproxy) to /dev/log to be written inside /var/log/haproxy.log and trigger a stop (by the way the the stop command works exactly as the tilda '~' discard one, except in some newer versions of haproxy the ~ is no now obsolete and you need to use stop instead (bear in mind that ~ even though obsolete proved to be working for me whether stop not ! but come on this is no strange this is linux mess), for example if you run latest debian Linux 11 as of September 2022 haproxy with package 2.2.9-2+deb11u3.
 

6. Create configuration for rsyslog to log from single Frontend outputting local2 to /var/log/haproxy_customname.log
 

root@haproxy2:/etc/rsyslog.d# cat 48-haproxy.conf
# Create an additional socket in haproxy's chroot in order to allow logging via
# /dev/log to chroot'ed HAProxy processes
$AddUnixListenSocket /var/lib/haproxy/dev/log

# Send HAProxy messages to a dedicated logfile
#:programname, startswith, "haproxy" {
#  /var/log/haproxy.log
#  stop
#}
# GGE/DPA 2022/08/02: HAProxy logs to local2, save the messages
local5.*                                                /var/log/haproxy_customname.log


You might also explicitly define the binary that will providing the logs inside the 48-haproxy.conf as we have a separate /usr/sbin/haproxy-customname-wrapper in that way you can log the output from the haproxy instance only based
on its binary command and you can omit writting to local5 to log via it something else 🙂

root@haproxy2:/etc/rsyslog.d# cat 48-haproxy.conf
# Create an additional socket in haproxy's chroot in order to allow logging via
# /dev/log to chroot'ed HAProxy processes
$AddUnixListenSocket /var/lib/haproxy/dev/log

# Send HAProxy messages to a dedicated logfile
#:programname, startswith, "haproxy" {
#  /var/log/haproxy.log
#  stop
#}
# GGE/DPA 2022/08/02: HAProxy logs to local2, save the messages

:programname, startswith, "haproxy-customname-wrapper " {
 
/var/log/haproxy_customname.log
  stop
}


7. Create the log file to log the custom frontend of your preference e.g. /var/log/haproxy_custom_frontend.log under local5 /prepare rsyslog config for
 

root@haproxy2:/etc/rsyslog.d# cat 47-haproxy-custom-frontend.conf
$ModLoad imudp
$UDPServerAddress 127.0.0.1
$UDPServerRun 514
#2022/02/02: HAProxy logs to local6, save the messages
local4.*                                                /var/log/haproxy_custom_frontend.log
:msg, contains, "https-in" ~

The 'https-in' is my frontend inside /etc/haproxy/haproxy.cfg it returns the name of it every time in /var/log/haproxy.log therefore I will log the frontend to local5 and to prevent double logging inside /var/log/haproxy.log of connections incoming towards the same frontend inside /var/log/haproxy.log, I have the tilda symbol '~' which instructs rsyslog to discard any message coming to rsyslog with "https-in" string in, immediately after the same frontend as configured inside /etc/haproxy/haproxy.cfg will output the frontend operations inside local5.


!!! Note that for rsyslog it is very important to have the right order of configurations, the configuration order is being considered based on the file numbering. !!!
 

Hence notice that my filter file number 47_* preceeds the other 2 configured rsyslog configs.
 

root@haproxy2:/etc/rsyslog.d# ls -1
47-haproxy-custom-frontend.conf
48-haproxy.conf
49-haproxy.conf

This will make 47-haproxy-custom-frontend.conf to be read and processed first 48-haproxy.conf processed second and 49-haproxy.conf processed third.


8. Reload rsyslog and haproxy and test


root@haproxy2: ~# systemctl restart rsyslog
root@haproxy2: ~# systemctl restart haproxy
root@haproxy2: ~# systemctl status rsyslog

● rsyslog.service – System Logging Service
     Loaded: loaded (/lib/systemd/system/rsyslog.service; enabled; vendor preset: enabled)
     Active: active (running) since Thu 2022-09-01 17:34:51 EEST; 1s ago
TriggeredBy: ● syslog.socket
       Docs: man:rsyslogd(8)
             man:rsyslog.conf(5)
             https://www.rsyslog.com/doc/
   Main PID: 372726 (rsyslogd)
      Tasks: 6 (limit: 4654)
     Memory: 980.0K
        CPU: 8ms
     CGroup: /system.slice/rsyslog.service
             └─372726 /usr/sbin/rsyslogd -n -iNONE

сеп 01 17:34:51 haproxy2 systemd[1]: Stopped System Logging Service.
сеп 01 17:34:51 haproxy2 rsyslogd[372726]: warning: ~ action is deprecated, consider using the 'stop' statement instead [v8.210>
сеп 01 17:34:51 haproxy2 systemd[1]: Starting System Logging Service…
сеп 01 17:34:51 haproxy2 rsyslogd[372726]: [198B blob data]
сеп 01 17:34:51 haproxy2 systemd[1]: Started System Logging Service.
сеп 01 17:34:51 haproxy2 rsyslogd[372726]: [198B blob data]
сеп 01 17:34:51 haproxy2 rsyslogd[372726]: imuxsock: Acquired UNIX socket '/run/systemd/journal/syslog' (fd 3) from systemd.  [>
сеп 01 17:34:51 haproxy2 rsyslogd[372726]: [origin software="rsyslogd" swVersion="8.2102.0" x-pid="372726" x-info="https://www.

Do some testing with some tool like curl / wget / lynx / elinks etc. on each of the configured haproxy listeners and frontends and check whether everything ends up in the correct log files.
That's all folks enjoy ! 🙂
 

How to calculate connections from IP address with shell script and log to Zabbix graphic

Thursday, March 11th, 2021

We had to test the number of connections incoming IP sorted by its TCP / IP connection state.

For example:

TIME_WAIT, ESTABLISHED, LISTEN etc.


The reason behind is sometimes the IP address '192.168.0.1' does create more than 200 connections, a Cisco firewall gets triggered and the connection for that IP is filtered out. To be able to know in advance that this problem is upcoming. a Small userparameter script is set on the Linux servers, that does print out all connections from IP by its STATES sorted out.


The script is calc_total_ip_match_zabbix.sh is below:

#!/bin/bash
#  check ESTIMATED / FIN_WAIT etc. netstat output for IPs and calculate total
# UserParameter=count.connections,(/usr/local/bin/calc_total_ip_match_zabbix.sh)
CHECK_IP='192.168.0.1';
f=0; 


for i in $(netstat -nat | grep "$CHECK_IP" | awk '{print $6}' | sort | uniq -c | sort -n); do

echo -n "$i ";
f=$((f+i));
done;
echo
echo "Total: $f"


root@pcfreak:/bashscripts# ./calc_total_ip_match_zabbix.sh 
1 TIME_WAIT 2 ESTABLISHED 3 LISTEN 

Total: 6


root@pcfreak:/bashscripts# ./calc_total_ip_match_zabbix.sh 
2 ESTABLISHED 3 LISTEN 
Total: 5


images/zabbix-webgui-connection-check1

To make process with Zabbix it is necessery to have an Item created and a Depedent Item.


webguiconnection-check1

webguiconnection-check1
 

webgui-connection-check2-item

images/webguiconnection-check1

Finally create a trigger to trigger alarm if you have more than or eqaul to 100 Total overall connections.


images/zabbix-webgui-connection-check-trigger

The Zabbix userparameter script should be as this:

[root@host: ~]# cat /etc/zabbix/zabbix_agentd.d/userparameter_webgui_conn.conf
UserParameter=count.connections,(/usr/local/bin/webgui_conn_track.sh)


Some collleagues suggested more efficient shell script solution for suming the overall number of connections, below is less time consuming version of script, that can be used for the calculation.
 

#!/bin/bash -x
# show FIN_WAIT2 / ESTIMATED etc. and calcuate total
count=$(netstat -n | grep "192.168.0.1" | awk ' { print $6 } ' | sort -n | uniq -c | sort -nr)
total=$((${count// /+}))
echo "$count"
echo "Total:" "$total"

      2 ESTABLISHED
      1 TIME_WAIT
Total: 3


Below is the graph built with Zabbix showing all the fluctuations from connections from monitored IP. ebgui-check_ip_graph


How to configure bond0 bonding and network bridging for KVM Virtual machines on Redhat / CentOS / Fedora Linux

Tuesday, February 16th, 2021

configure-bond0-bonding-channel-with-bridges-on-hypervisor-host-for-guest-KVM-virtual-machines-howto-sample-Hypervisor-Virtual-machines-pic
 1. Intro to Redhat RPM based distro /etc/sysconfig/network-scripts/* config vars shortly explained

On RPM based Linux distributions configuring network has a very specific structure. As a sysadmin just recently I had a task to configure Networking on 2 Machines to be used as Hypervisors so the servers could communicate normally to other Networks via some different intelligent switches that are connected to each of the interfaces of the server. The idea is the 2 redhat 8.3 machines to be used as  Hypervisor (HV) and each of the 2 HVs to each be hosting 2 Virtual guest Machines with preinstalled another set of Redhat 8.3 Ootpa. I've recently blogged on how to automate a bit installing the KVM Virtual machines with using predefined kickstart.cfg file.

The next step after install was setting up the network. Redhat has a very specific network configuration well known under /etc/sysconfig/network-scripts/ifcfg-eno*# or if you have configured the Redhats to fix the changing LAN card naming ens, eno, em1 to legacy eth0, eth1, eth2 on CentOS Linux – e.g. to be named as /etc/sysconfig/network-scripts/{ifcfg-eth0,1,2,3}.

The first step to configure the network from that point is to come up with some network infrastrcture that will be ready on the HV nodes server-node1 server-node2 for the Virtual Machines to be used by server-vm1, server-vm2.

Thus for the sake of myself and some others I decide to give here the most important recognized variables that can be placed inside each of the ifcfg-eth0,ifcfg-eth1,ifcfg-eth2 …

A standard ifcfg-eth0 confing would look something this:
 

[root@redhat1 :~ ]# cat /etc/sysconfig/network-scripts/ifcfg-eth0
TYPE=Ethernet
BOOTPROTO=none
DEFROUTE=yes
IPV4_FAILURE_FATAL=no
IPV6INIT=yes
IPV6_AUTOCONF=yes
IPV6_DEFROUTE=yes
IPV4_FAILURE_FATAL=no
NAME=eth0
UUID=…
ONBOOT=yes
HWADDR=0e:a4:1a:b6:fc:86
IPADDR0=10.31.24.10
PREFIX0=23
GATEWAY0=10.31.24.1
DNS1=192.168.50.3
DNS2=10.215.105.3
DOMAIN=example.com
IPV6_PEERDNS=yes
IPV6_PEERROUTES=yes


Lets say few words to each of the variables to make it more clear to people who never configured Newtork on redhat without the help of some of the console ncurses graphical like tools such as nmtui or want to completely stop the Network-Manager to manage the network and thus cannot take the advantage of using nmcli (a command-line tool for controlling NetworkManager).

Here is a short description of each of above configuration parameters:

TYPE=device_type: The type of network interface device
BOOTPROTO=protocol: Where protocol is one of the following:

  • none: No boot-time protocol is used.
  • bootp: Use BOOTP (bootstrap protocol).
  • dhcp: Use DHCP (Dynamic Host Configuration Protocol).
  • static: if configuring static IP

EFROUTE|IPV6_DEFROUTE=answer

  • yes: This interface is set as the default route for IPv4|IPv6 traffic.
  • no: This interface is not set as the default route.

Usually most people still don't use IPV6 so better to disable that

IPV6INIT=answer: Where answer is one of the following:

  • yes: Enable IPv6 on this interface. If IPV6INIT=yes, the following parameters could also be set in this file:

IPV6ADDR=IPv6 address

IPV6_DEFAULTGW=The default route through the specified gateway

  • no: Disable IPv6 on this interface.

IPV4_FAILURE_FATAL|IPV6_FAILURE_FATAL=answer: Where answer is one of the following:

  • yes: This interface is disabled if IPv4 or IPv6 configuration fails.
  • no: This interface is not disabled if configuration fails.

ONBOOT=answer: Where answer is one of the following:

  • yes: This interface is activated at boot time.
  • no: This interface is not activated at boot time.

HWADDR=MAC-address: The hardware address of the Ethernet device
IPADDRN=address: The IPv4 address assigned to the interface
PREFIXN=N: Length of the IPv4 netmask value
GATEWAYN=address: The IPv4 gateway address assigned to the interface. Because an interface can be associated with several combinations of IP address, network mask prefix length, and gateway address, these are numbered starting from 0.
DNSN=address: The address of the Domain Name Servers (DNS)
DOMAIN=DNS_search_domain: The DNS search domain (this is the search Domain-name.com you usually find in /etc/resolv.conf)

Other interesting file that affects how routing is handled on a Redhat Linux is

/etc/sysconfig/network

[root@redhat1 :~ ]# cat /etc/sysconfig/network
# Created by anaconda
GATEWAY=10.215.105.

Having this gateway defined does add a default gateway

This file specifies global network settings. For example, you can specify the default gateway, if you want to apply some network settings such as routings, Alias IPs etc, that will be valid for all configured and active configuration red by systemctl start network scripts or the (the network-manager if such is used), just place it in that file.

Other files of intesresting to control how resolving is being handled on the server worthy to check are 

/etc/nsswitch.conf

and

/etc/hosts

If you want to set a preference of /etc/hosts being red before /etc/resolv.conf and DNS resolving for example you need to have inside it, below is default behavior of it.
 

root@redhat1 :~ ]#   grep -i hosts /etc/nsswitch.conf
#     hosts: files dns
#     hosts: files dns  # from user file
# Valid databases are: aliases, ethers, group, gshadow, hosts,
hosts:      files dns myhostname

As you can see the default order is to read first files (meaning /etc/hosts) and then the dns (/etc/resolv.conf)
hosts: files dns

Now with this short intro description on basic values accepted by Redhat's /etc/sysconfig/network-scripts/ifcfg* prepared configurations.


I will give a practical example of configuring a bond0 interface with 2 members which were prepared based on Redhat's Official documentation found in above URLs:

https://access.redhat.com/documentation/en-us/red_hat_enterprise_linux/8/html/configuring_and_managing_networking/configuring-network-bonding_configuring-and-managing-networking
 

# Bonding on RHEL 7 documentation
https://access.redhat.com/documentation/en-us/red_hat_enterprise_linux/7/html/networking_guide/sec-network_bonding_using_the_command_line_interface

https://access.redhat.com/documentation/en-us/red_hat_enterprise_linux/7/html/networking_guide/sec-verifying_network_configuration_bonding_for_redundancy

https://access.redhat.com/documentation/en-us/red_hat_enterprise_linux/6/html/deployment_guide/s2-networkscripts-interfaces_network-bridge

# Network Bridge with Bond documentation
https://access.redhat.com/documentation/en-us/red_hat_enterprise_linux/6/html/deployment_guide/sec-Configuring_a_VLAN_over_a_Bond

https://docs.fedoraproject.org/en-US/Fedora/24/html/Networking_Guide/sec-Network_Bridge_with_Bond.html


2. Configuring a single bond connection on eth0 / eth2 and setting 3 bridge interfaces bond -> br0, br1 -> eth1, br2 -> eth2

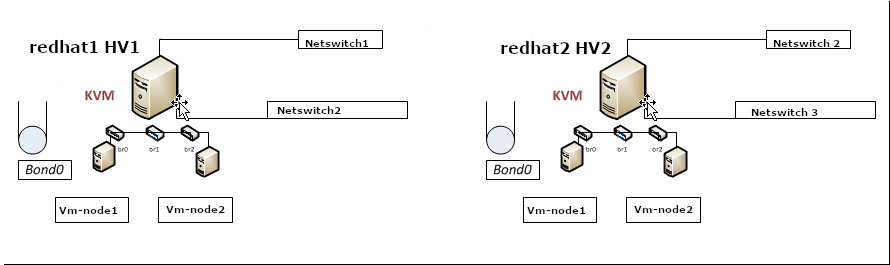
The task on my machines was to set up from 4 lan cards one bonded interface as active-backup type of bond with bonded lines on eth0, eth2 and 3 other 2 eth1, eth2 which will be used for private communication network that is connected via a special dedicated Switches and Separate VLAN 50, 51 over a tagged dedicated gigabit ports.

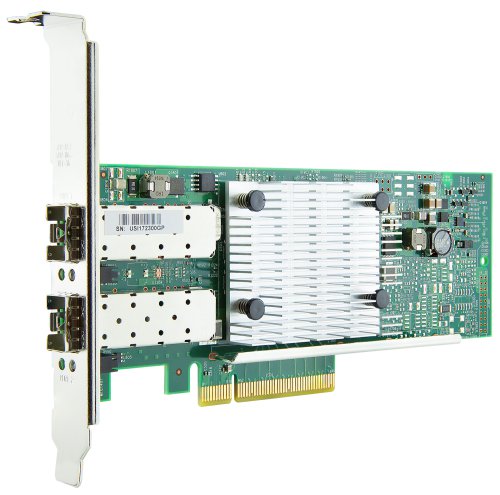
As said the 2 Servers had each 4 Broadcom Network CARD interfaces each 2 of which are paired (into a single card) and 2 of which are a solid Broadcom NetXtreme Dual Port 10GbE SFP+ and Dell Broadcom 5720 Dual Port 1Gigabit Network​.

2-ports-broadcom-netxtreme-dual-port-10GBe-spf-plus

On each of server-node1 and server-node2 we had 4 Ethernet Adapters properly detected on the Redhat

root@redhat1 :~ ]# lspci |grep -i net
01:00.0 Ethernet controller: Broadcom Inc. and subsidiaries NetXtreme BCM5720 2-port Gigabit Ethernet PCIe
01:00.1 Ethernet controller: Broadcom Inc. and subsidiaries NetXtreme BCM5720 2-port Gigabit Ethernet PCIe
19:00.0 Ethernet controller: Broadcom Inc. and subsidiaries BCM57412 NetXtreme-E 10Gb RDMA Ethernet Controller (rev 01)
19:00.1 Ethernet controller: Broadcom Inc. and subsidiaries BCM57412 NetXtreme-E 10Gb RDMA Ethernet Controller (rev 01)


I've already configured as prerogative net.ifnames=0 to /etc/grub2/boot.cfg and Network-Manager service disabled on the host (hence to not use Network Manager you'll see in below configuration NM_CONTROLLED="no" is telling the Redhat servers is not to be trying NetworkManager for more on that check my previous article Disable NetworkManager automatic Ethernet Interface Management on Redhat Linux , CentOS 6 / 7 / 8.

3. Types of Network Bonding

mode=0 (balance-rr)

This mode is based on Round-robin policy and it is the default mode. This mode offers fault tolerance and load balancing features. It transmits the packets in Round robin fashion that is from the first available slave through the last.

mode-1 (active-backup)

This mode is based on Active-backup policy. Only one slave is active in this band, and another one will act only when the other fails. The MAC address of this bond is available only on the network adapter part to avoid confusing the switch. This mode also provides fault tolerance.

mode=2 (balance-xor)

This mode sets an XOR (exclusive or) mode that is the source MAC address is XOR’d with destination MAC address for providing load balancing and fault tolerance. Each destination MAC address the same slave is selected.

mode=3 (broadcast)

This method is based on broadcast policy that is it transmitted everything on all slave interfaces. It provides fault tolerance. This can be used only for specific purposes.

mode=4 (802.3ad)

This mode is known as a Dynamic Link Aggregation mode that has it created aggregation groups having same speed. It requires a switch that supports IEEE 802.3ad dynamic link. The slave selection for outgoing traffic is done based on a transmit hashing method. This may be changed from the XOR method via the xmit_hash_policy option.

mode=5 (balance-tlb)

This mode is called Adaptive transmit load balancing. The outgoing traffic is distributed based on the current load on each slave and the incoming traffic is received by the current slave. If the incoming traffic fails, the failed receiving slave is replaced by the MAC address of another slave. This mode does not require any special switch support.

mode=6 (balance-alb)

This mode is called adaptive load balancing. This mode does not require any special switch support.

Lets create the necessery configuration for the bond and bridges

[root@redhat1 :~ ]# cat ifcfg-bond0
DEVICE=bond0
NAME=bond0
TYPE=Bond
BONDING_MASTER=yes
#IPADDR=10.50.21.16
#PREFIX=26
#GATEWAY=10.50.0.1
#DNS1=172.20.88.2
ONBOOT=yes
BOOTPROTO=none
BONDING_OPTS="mode=1 miimon=100 primary=eth0"
NM_CONTROLLED="no"
BRIDGE=br0


[root@redhat1 :~ ]# cat ifcfg-bond0.10
DEVICE=bond0.10
BOOTPROTO=none
ONPARENT=yes
#IPADDR=10.50.21.17
#NETMASK=255.255.255.0
VLAN=yes

[root@redhat1 :~ ]# cat ifcfg-br0
STP=yes
BRIDGING_OPTS=priority=32768
TYPE=Bridge
PROXY_METHOD=none
BROWSER_ONLY=no
BOOTPROTO=none
DEFROUTE=yes
IPV4_FAILURE_FATAL=no
#IPV6INIT=yes
#IPV6_AUTOCONF=yes
#IPV6_DEFROUTE=yes
#IPV6_FAILURE_FATAL=no
#IPV6_ADDR_GEN_MODE=stable-privacy
IPV6_AUTOCONF=no
IPV6_DEFROUTE=no
IPV6_FAILURE_FATAL=no
IPV6_ADDR_GEN_MODE=stable-privacy
NAME=br0
UUID=4451286d-e40c-4d8c-915f-7fc12a16d595
DEVICE=br0
ONBOOT=yes
IPADDR=10.50.50.16
PREFIX=26
GATEWAY=10.50.0.1
DNS1=172.20.0.2
NM_CONTROLLED=no

[root@redhat1 :~ ]# cat ifcfg-br1
STP=yes
BRIDGING_OPTS=priority=32768
TYPE=Bridge
PROXY_METHOD=none
BROWSER_ONLY=no
BOOTPROTO=none
DEFROUTE=no
IPV4_FAILURE_FATAL=no
#IPV6INIT=yes
#IPV6_AUTOCONF=yes
#IPV6_DEFROUTE=yes
#IPV6_FAILURE_FATAL=no
#IPV6_ADDR_GEN_MODE=stable-privacy
IPV6INIT=no
IPV6_AUTOCONF=no
IPV6_DEFROUTE=no
IPV6_FAILURE_FATAL=no
IPV6_ADDR_GEN_MODE=stable-privacy
NAME=br1
UUID=40360c3c-47f5-44ac-bbeb-77f203390d29
DEVICE=br1
ONBOOT=yes
##IPADDR=10.50.51.241
PREFIX=28
##GATEWAY=10.50.0.1
##DNS1=172.20.0.2
NM_CONTROLLED=no

[root@redhat1 :~ ]# cat ifcfg-br2
STP=yes
BRIDGING_OPTS=priority=32768
TYPE=Bridge
PROXY_METHOD=none
BROWSER_ONLY=no
BOOTPROTO=none
DEFROUTE=no
IPV4_FAILURE_FATAL=no
#IPV6INIT=yes
#IPV6_AUTOCONF=yes
#IPV6_DEFROUTE=yes
#IPV6_FAILURE_FATAL=no
#IPV6_ADDR_GEN_MODE=stable-privacy
IPV6INIT=no
IPV6_AUTOCONF=no
IPV6_DEFROUTE=no
IPV6_FAILURE_FATAL=no
IPV6_ADDR_GEN_MODE=stable-privacy
NAME=br2
UUID=fbd5c257-2f66-4f2b-9372-881b783276e0
DEVICE=br2
ONBOOT=yes
##IPADDR=10.50.51.243
PREFIX=28
##GATEWAY=10.50.0.1
##DNS1=172.20.10.1
NM_CONTROLLED=no
NM_CONTROLLED=no
BRIDGE=br0

[root@redhat1 :~ ]# cat ifcfg-eth0
TYPE=Ethernet
NAME=bond0-slaveeth0
BOOTPROTO=none
#UUID=61065574-2a9d-4f16-b16e-00f495e2ee2b
DEVICE=eth0
ONBOOT=yes
MASTER=bond0
SLAVE=yes
NM_CONTROLLED=no

[root@redhat1 :~ ]# cat ifcfg-eth1
TYPE=Ethernet
NAME=eth1
UUID=b4c359ae-7a13-436b-a904-beafb4edee94
DEVICE=eth1
ONBOOT=yes
BRIDGE=br1
NM_CONTROLLED=no

[root@redhat1 :~ ]#  cat ifcfg-eth2
TYPE=Ethernet
NAME=bond0-slaveeth2
BOOTPROTO=none
#UUID=821d711d-47b9-490a-afe7-190811578ef7
DEVICE=eth2
ONBOOT=yes
MASTER=bond0
SLAVE=yes
NM_CONTROLLED=no

[root@redhat1 :~ ]#  cat ifcfg-eth3
TYPE=Ethernet
PROXY_METHOD=none
BROWSER_ONLY=no
#BOOTPROTO=dhcp
BOOTPROTO=none
DEFROUTE=no
IPV4_FAILURE_FATAL=no
#IPV6INIT=yes
#IPV6_AUTOCONF=yes
#IPV6_DEFROUTE=yes
#IPV6_FAILURE_FATAL=no
#IPV6_ADDR_GEN_MODE=stable-privacy
IPV6INIT=no
IPV6_AUTOCONF=no
IPV6_DEFROUTE=no
IPV6_FAILURE_FATAL=no
IPV6_ADDR_GEN_MODE=stable-privacy
BRIDGE=br2
NAME=eth3
UUID=61065574-2a9d-4f16-b16e-00f495e2ee2b
DEVICE=eth3
ONBOOT=yes
NM_CONTROLLED=no

[root@redhat2 :~ ]# cat ifcfg-bond0
DEVICE=bond0
NAME=bond0
TYPE=Bond
BONDING_MASTER=yes
#IPADDR=10.50.21.16
#PREFIX=26
#GATEWAY=10.50.21.1
#DNS1=172.20.88.2
ONBOOT=yes
BOOTPROTO=none
BONDING_OPTS="mode=1 miimon=100 primary=eth0"
NM_CONTROLLED="no"
BRIDGE=br0

# cat ifcfg-bond0.10
DEVICE=bond0.10
BOOTPROTO=none
ONPARENT=yes
#IPADDR=10.50.21.17
#NETMASK=255.255.255.0
VLAN=yes
NM_CONTROLLED=no
BRIDGE=br0

[root@redhat2 :~ ]# cat ifcfg-br0
STP=yes
BRIDGING_OPTS=priority=32768
TYPE=Bridge
PROXY_METHOD=none
BROWSER_ONLY=no
BOOTPROTO=none
DEFROUTE=yes
IPV4_FAILURE_FATAL=no
#IPV6INIT=yes
#IPV6_AUTOCONF=yes
#IPV6_DEFROUTE=yes
#IPV6_FAILURE_FATAL=no
#IPV6_ADDR_GEN_MODE=stable-privacy
IPV6_AUTOCONF=no
IPV6_DEFROUTE=no
IPV6_FAILURE_FATAL=no
IPV6_ADDR_GEN_MODE=stable-privacy
NAME=br0
#UUID=f87e55a8-0fb4-4197-8ccc-0d8a671f30d0
UUID=4451286d-e40c-4d8c-915f-7fc12a16d595
DEVICE=br0
ONBOOT=yes
IPADDR=10.50.21.17
PREFIX=26
GATEWAY=10.50.21.1
DNS1=172.20.88.2
NM_CONTROLLED=no

[root@redhat2 :~ ]#  cat ifcfg-br1
STP=yes
BRIDGING_OPTS=priority=32768
TYPE=Bridge
PROXY_METHOD=none
BROWSER_ONLY=no
BOOTPROTO=none
DEFROUTE=no
IPV4_FAILURE_FATAL=no
#IPV6INIT=no
#IPV6_AUTOCONF=no
#IPV6_DEFROUTE=no
#IPV6_FAILURE_FATAL=no
#IPV6_ADDR_GEN_MODE=stable-privacy
IPV6INIT=no
IPV6_AUTOCONF=no
IPV6_DEFROUTE=no
IPV6_FAILURE_FATAL=no
IPV6_ADDR_GEN_MODE=stable-privacy
NAME=br1
UUID=40360c3c-47f5-44ac-bbeb-77f203390d29
DEVICE=br1
ONBOOT=yes
##IPADDR=10.50.21.242
PREFIX=28
##GATEWAY=10.50.21.1
##DNS1=172.20.88.2
NM_CONTROLLED=no

[root@redhat2 :~ ]# cat ifcfg-br2
STP=yes
BRIDGING_OPTS=priority=32768
TYPE=Bridge
PROXY_METHOD=none
BROWSER_ONLY=no
BOOTPROTO=none
DEFROUTE=no
IPV4_FAILURE_FATAL=no
#IPV6INIT=no
#IPV6_AUTOCONF=no
#IPV6_DEFROUTE=no
#IPV6_FAILURE_FATAL=no
#IPV6_ADDR_GEN_MODE=stable-privacy
IPV6INIT=no
IPV6_AUTOCONF=no
IPV6_DEFROUTE=no
IPV6_FAILURE_FATAL=no
IPV6_ADDR_GEN_MODE=stable-privacy
NAME=br2
UUID=fbd5c257-2f66-4f2b-9372-881b783276e0
DEVICE=br2
ONBOOT=yes
##IPADDR=10.50.21.244
PREFIX=28
##GATEWAY=10.50.21.1
##DNS1=172.20.88.2
NM_CONTROLLED=no

[root@redhat2 :~ ]# cat ifcfg-eth0
TYPE=Ethernet
NAME=bond0-slaveeth0
BOOTPROTO=none
#UUID=ee950c07-7eb2-463b-be6e-f97e7ad9d476
DEVICE=eth0
ONBOOT=yes
MASTER=bond0
SLAVE=yes
NM_CONTROLLED=no

[root@redhat2 :~ ]# cat ifcfg-eth1
TYPE=Ethernet
NAME=eth1
UUID=ffec8039-58f0-494a-b335-7a423207c7e6
DEVICE=eth1
ONBOOT=yes
BRIDGE=br1
NM_CONTROLLED=no

[root@redhat2 :~ ]# cat ifcfg-eth2
TYPE=Ethernet
NAME=bond0-slaveeth2
BOOTPROTO=none
#UUID=2c097475-4bef-47c3-b241-f5e7f02b3395
DEVICE=eth2
ONBOOT=yes
MASTER=bond0
SLAVE=yes
NM_CONTROLLED=no


Notice that the bond0 configuration does not have an IP assigned this is done on purpose as we're using the interface channel bonding together with attached bridge for the VM. Usual bonding on a normal physical hardware hosts where no virtualization use is planned is perhaps a better choice. If you however try to set up an IP address in that specific configuration shown here and you try to reboot the machine, you will end up with inacessible machine over the network like I did and you will need to resolve configuration via some kind of ILO / IDRAC interface.

4. Generating UUID for ethernet devices bridges and bonds

One thing to note is the command uuidgen you might need that to generate UID identificators to fit in the new network config files.

Example:
 

[root@redhat2 :~ ]#uuidgen br2
e7995e15-7f23-4ea2-80d6-411add78d703
[root@redhat2 :~ ]# uuidgen br1
05e0c339-5998-414b-b720-7adf91a90103
[root@redhat2 :~ ]# uuidgen br0
e6d7ff74-4c15-4d93-a150-ff01b7ced5fb


5. How to make KVM Virtual Machines see configured Network bridges (modify VM XML)

To make the Virtual machines installed see the bridges I had to

[root@redhat1 :~ ]#virsh edit VM_name1
[root@redhat1 :~ ]#virsh edit VM_name2

[root@redhat2 :~ ]#virsh edit VM_name1
[root@redhat2 :~ ]#virsh edit VM_name2

Find the interface network configuration and change it to something like:

    <interface type='bridge'>
      <mac address='22:53:00:56:5d:ac'/>
      <source bridge='br0'/>
      <model type='virtio'/>
      <address type='pci' domain='0x0000' bus='0x01' slot='0x00' function='0x0'/>
    </interface>
    <interface type='bridge'>
      <mac address='22:53:00:2a:5f:01'/>
      <source bridge='br1'/>
      <model type='virtio'/>
      <address type='pci' domain='0x0000' bus='0x07' slot='0x00' function='0x0'/>
    </interface>
    <interface type='bridge'>
      <mac address='22:34:00:4a:1b:6c'/>
      <source bridge='br2'/>
      <model type='virtio'/>
      <address type='pci' domain='0x0000' bus='0x08' slot='0x00' function='0x0'/>
    </interface>


6. Testing the bond  is up and works fine

# ip addr show bond0
The result is the following:


4: bond0: <BROADCAST,MULTICAST,MASTER,UP,LOWER_UP> mtu 1500 qdisc noqueue state UP group default qlen 1000
    link/ether 52:54:00:cb:25:82 brd ff:ff:ff:ff:ff:ff


The bond should be visible in the normal network interfaces with ip address show or /sbin/ifconfig


# cat /proc/net/bonding/bond0
Ethernet Channel Bonding Driver: v3.7.1 (April 27, 2011)

Bonding Mode: fault-tolerance (active-backup)
Primary Slave: None
Currently Active Slave: eth0
MII Status: up
MII Polling Interval (ms): 100
Up Delay (ms): 0
Down Delay (ms): 0

Slave Interface: eth2
MII Status: up
Speed: 10000 Mbps
Duplex: full
Link Failure Count: 0
Permanent HW addr: 00:0c:29:ab:2a:fa
Slave queue ID: 0


According to the output eth0 is the active slave.

The active slaves device files (eth0 in this case) is found in virtual file system /sys/

# find /sys -name *eth0
/sys/devices/pci0000:00/0000:00:15.0/0000:03:00.0/net/eth0
/sys/devices/virtual/net/bond0/lower_eth0
/sys/class/net/eth0


You can remove a bond member say eth0 by 


 cd to the pci* directory
Example: /sys/devices/pci000:00/000:00:15.0


# echo 1 > remove


At this point the eth0 device directory structure that was previously located under /sys/devices/pci000:00/000:00:15.0 is no longer there.  It was removed and the device no longer exists as seen by the OS.

You can verify this is the case with a simple ifconfig which will no longer list the eth0 device.
You can also repeat the cat /proc/net/bonding/bond0 command from Step 1 to see that eth0 is no longer listed as active or available.
You can also see the change in the messages file.  It might look something like this:

2021-02-12T14:13:23.363414-06:00 redhat1  device eth0: device has been deleted
2021-02-12T14:13:23.368745-06:00 redhat1 kernel: [81594.846099] bonding: bond0: releasing active interface eth0
2021-02-12T14:13:23.368763-06:00 redhat1 kernel: [81594.846105] bonding: bond0: Warning: the permanent HWaddr of eth0 – 00:0c:29:ab:2a:f0 – is still in use by bond0. Set the HWaddr of eth0 to a different address to avoid conflicts.
2021-02-12T14:13:23.368765-06:00 redhat1 kernel: [81594.846132] bonding: bond0: making interface eth1 the new active one.


Another way to test the bonding is correctly switching between LAN cards on case of ethernet hardware failure is to bring down one of the 2 or more bonded interfaces, lets say you want to switch from active-backup from eth1 to eth2, do:
 

# ip link set dev eth0 down


That concludes the test for fail over on active slave failure.

7. Bringing bond updown (rescan) bond with no need for server reboot

You know bonding is a tedious stuff that sometimes breaks up badly so only way to fix the broken bond seems to be a init 6 (reboot) cmd but no actually that is not so.

You can also get the deleted device back with a simple pci rescan command:

# echo 1 > /sys/bus/pci/rescan


The eth0 interface should now be back
You can see that it is back with an ifconfig command, and you can verify that the bond sees it with this command:

# cat /proc/net/bonding/bond0


That concludes the test of the bond code seeing the device when it comes back again.

The same steps can be repeated only this time using the eth1 device and file structure to fail the active slave in the bond back over to eth0.

8. Testing the bond with ifenslave command (ifenslave command examples)

Below is a set of useful information to test the bonding works as expected with ifenslave command  comes from "iputils-20071127" package

– To show information of all the inerfaces

                  # ifenslave -a
                  # ifenslave –all-interfaces 


– To change the active slave

                  # ifenslave -c bond0 eth1
                  # ifenslave –change-active bond0 eth1 


– To remove the slave interface from the bonding device

                  # ifenslave -d eth1
                  # ifenslave –detach bond0 eth1 


– To show master interface info

                  # ifenslave bond0 


– To set the bond device down and automatically release all the slaves

                  # ifenslave bond1 down 

– To get the usage info

                  # ifenslave -u
                  # ifenslave –usage 

– To set to verbose mode

                  # ifenslave -v
                  # ifenslave –verbose 

9. Testing the bridge works fine

Historically over the years all kind of bridges are being handled with the brctl part of bridge-utils .deb / .rpm installable package.

The classical way to check a bridge is working is to do

# brctl show
# brctl show br0; brctl show br1; brctl show br2

# brctl showmacs br0
 

etc.

Unfortunately with redhat 8 this command is no longer available so to get information about configured bridges you need to use instead:


# bridge link show
3:eth0: <BROADCAST,MULTICAST,UP,LOWER_UP> mtu 1500 master bridge0 state forwarding priority 32 cost 100
4:eth2: <BROADCAST,MULTICAST,UP,LOWER_UP> mtu 1500 master bridge0 state listening priority 32 cost 100


10. Troubleshooting network connectivity issues on bond bridges and LAN cards

Testing the bond connection and bridges can route proper traffic sometimes is a real hassle so here comes at help the good old tcpdump

If you end up with issues with some of the ethernet interfaces between HV1 and HV2 to be unable to talk to each other and you have some suspiciousness that some colleague from the network team has messed up a copper (UTP) cable or there is a connectivity fiber optics issues. To check the VLAN tagged traffic headers on the switch you can listen to each and every bond0 and br0, br1, br2 eth0, eth1, eth2, eth3 configured on the server like so:

# tcpdump -i bond0 -nn -e vlan


Some further investigation on where does a normal ICMP traffic flows once everything is setup is a normal thing to do, hence just try to route a normal ping via the different server interfaces:

# ping -I bond0 DSTADDR

# ping -i eth0 DSTADDR

# ping -i eth1 DSTADDR

# ping -i eth2 DSTADDR


After conducting the ping do the normal for network testing big ICMP packages (64k) ping to make sure there are no packet losses etc., e.g:

# ping -I eth3 -s 64536  DSTADDR


If for 10 – 20 seconds the ping does not return package losses then you should be good.

Report haproxy node switch script useful for Zabbix or other monitoring

Tuesday, June 9th, 2020

zabbix-monitoring-logo
For those who administer corosync clustered haproxy and needs to build monitoring in case if the main configured Haproxy node in the cluster is changed, I've developed a small script to be integrated with zabbix-agent installed to report to a central zabbix server via a zabbix proxy.
The script  is very simple it assumed DC1 variable is the default used haproxy node and DC2 and DC3 are 2 backup nodes. The script is made to use crm_mon which is not installed by default on each server by default so if you'll be using it you'll have to install it first, but anyways the script can easily be adapted to use pcs cmd instead.

Below is the bash shell script:

UserParameter=active.dc,f=0; for i in $(sudo /usr/sbin/crm_mon -n -1|grep -i 'Node ' |awk '{ print $2 }'); do ((f++)); DC[$f]="$i"; done; \
DC=$(sudo /usr/sbin/crm_mon -n -1 | grep 'Current DC' | awk '{ print $1 " " $2 " " $3}' | awk '{ print $3 }'); \
if [ “$DC” == “${DC[1]}” ]; then echo “1 Default DC Switched to ${DC[1]}”; elif [ “$DC” == “${DC[2]}” ]; then \
echo "2 Default DC Switched to ${DC[2]}”; elif [ “$DC” == “${DC[3]}” ]; then echo “3 Default DC: ${DC[3]}"; fi


To configure it with zabbix monitoring it can be configured via UserParameterScript.

The way I configured  it in Zabbix is as so:


1. Create the userpameter_active_node.conf

Below script is 3 nodes Haproxy cluster

# cat > /etc/zabbix/zabbix_agentd.d/userparameter_active_node.conf

UserParameter=active.dc,f=0; for i in $(sudo /usr/sbin/crm_mon -n -1|grep -i 'Node ' |awk '{ print $2 }'); do ((f++)); DC[$f]="$i"; done; \
DC=$(sudo /usr/sbin/crm_mon -n -1 | grep 'Current DC' | awk '{ print $1 " " $2 " " $3}' | awk '{ print $3 }'); \
if [ “$DC” == “${DC[1]}” ]; then echo “1 Default DC Switched to ${DC[1]}”; elif [ “$DC” == “${DC[2]}” ]; then \
echo "2 Default DC Switched to ${DC[2]}”; elif [ “$DC” == “${DC[3]}” ]; then echo “3 Default DC: ${DC[3]}"; fi

Once pasted to save the file press CTRL + D


The version of the script with 2 nodes slightly improved is like so:
 

UserParameter=active.dc,f=0; for i in $(sudo /usr/sbin/crm_mon -n -1|grep -i 'Node ' |awk '{ print $2 }' | sed -e 's#:##g'); do DC_ARRAY[$f]=”$i”; ((f++)); done; GET_CURR_DC=$(sudo /usr/sbin/crm_mon -n -1 | grep ‘Current DC’ | awk ‘{ print $1 ” ” $2 ” ” $3}’ | awk ‘{ print $3 }’); if [ “$GET_CURR_DC” == “${DC_ARRAY[0]}” ]; then echo “1 Default DC ${DC_ARRAY[0]}”; fi; if [ “$GET_CURR_DC” == “${DC_ARRAY[1]}” ]; then echo “2 Default Current DC Switched to ${DC_ARRAY[1]} Please check “; fi; if [ -z “$GET_CURR_DC” ] || [ -z “$DC_ARRAY[1]” ]; then printf "Error something might be wrong with HAProxy Cluster on  $HOSTNAME "; fi;


The haproxy_active_DC_zabbix.sh script with a bit of more comments as explanations is available here 
2. Configure access for /usr/sbin/crm_mon for zabbix user in sudoers


# vim /etc/sudoers

zabbix          ALL=NOPASSWD: /usr/sbin/crm_mon


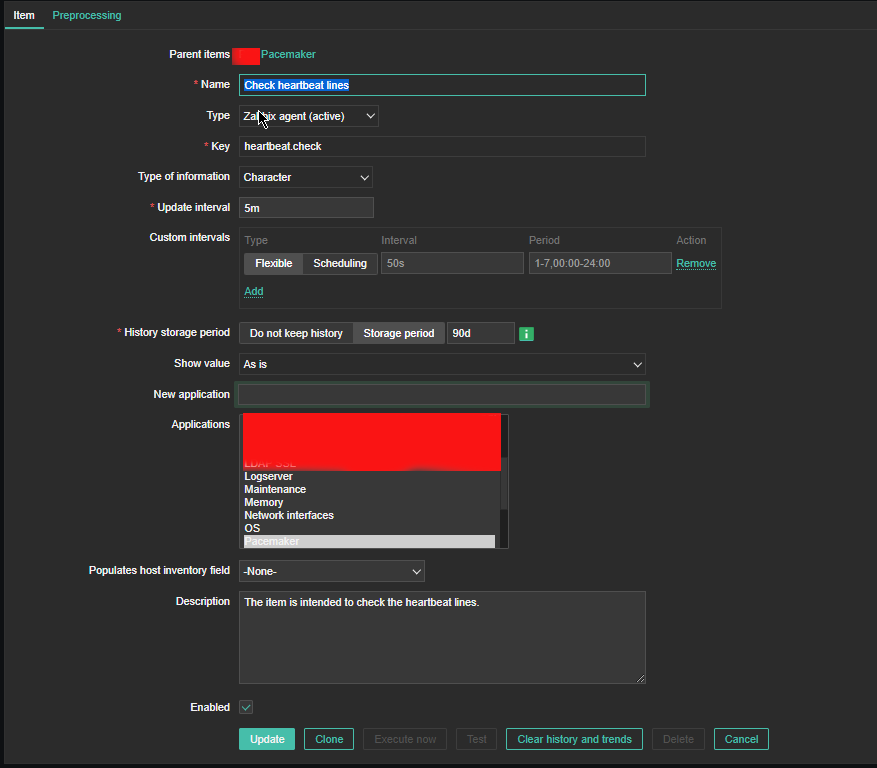
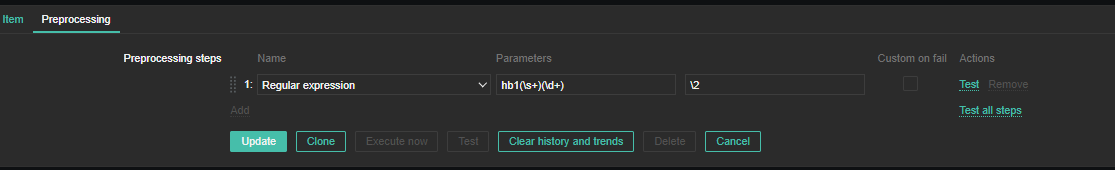
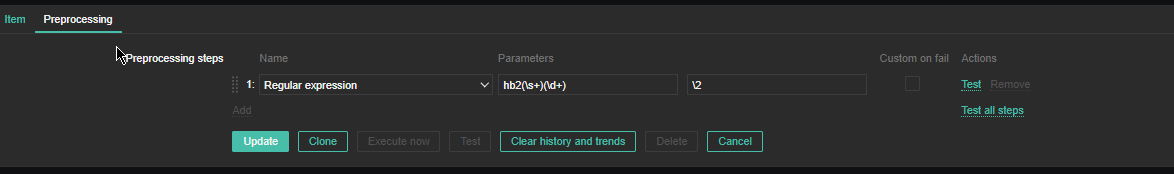
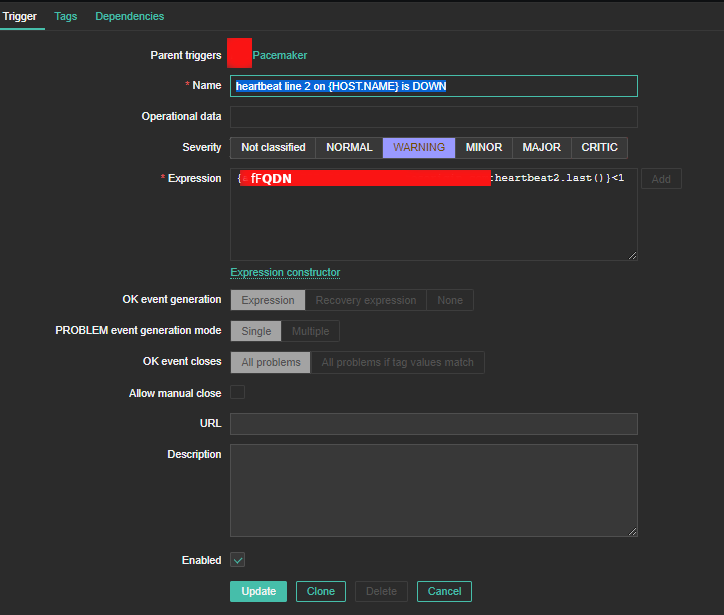
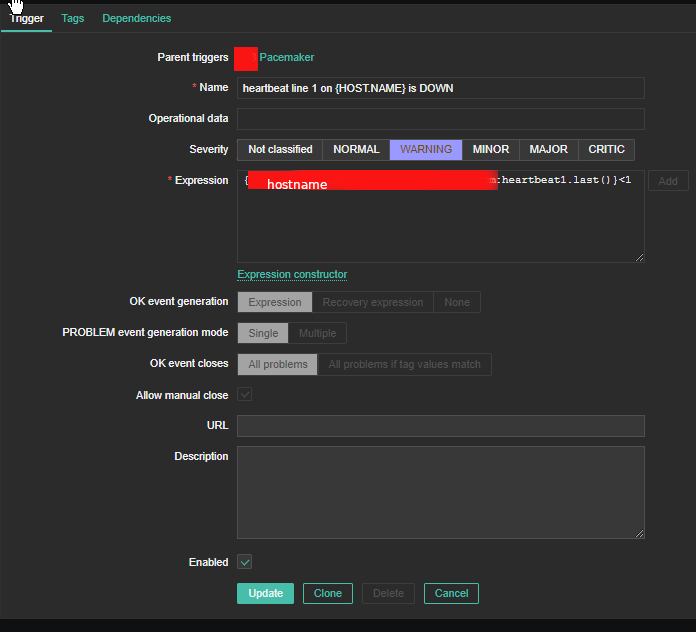
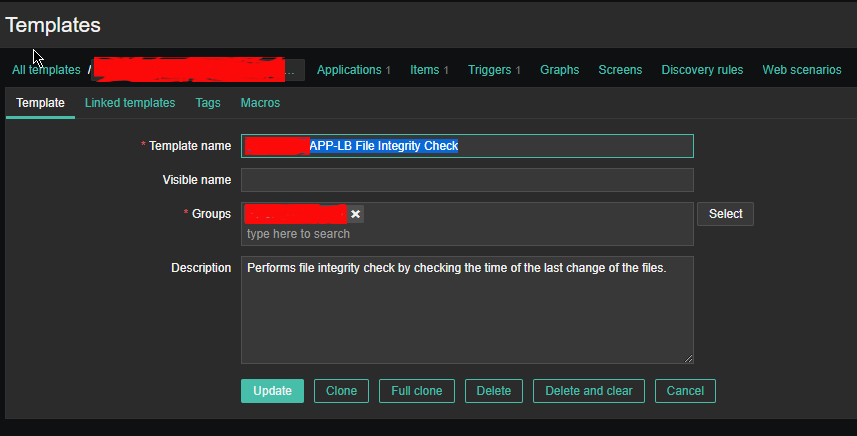
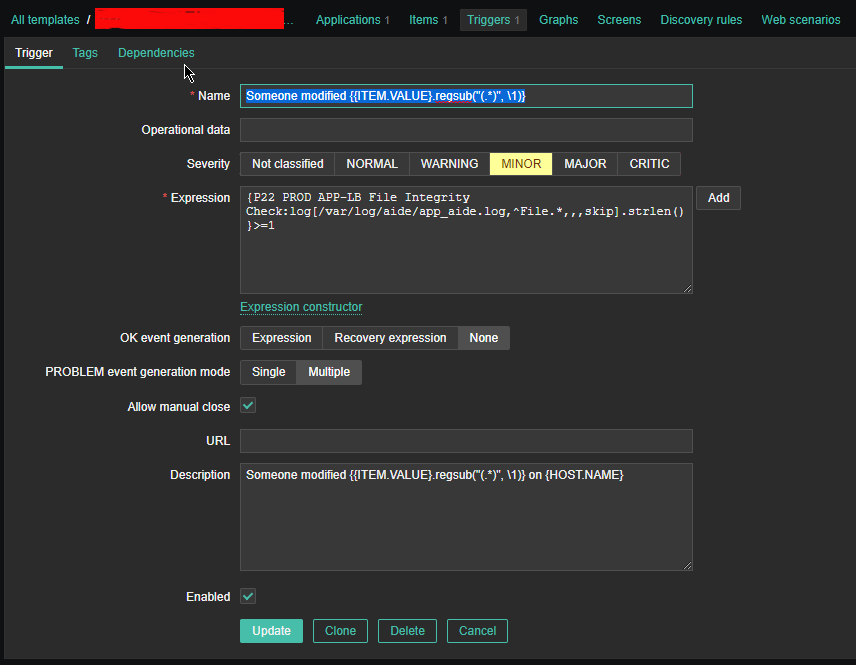
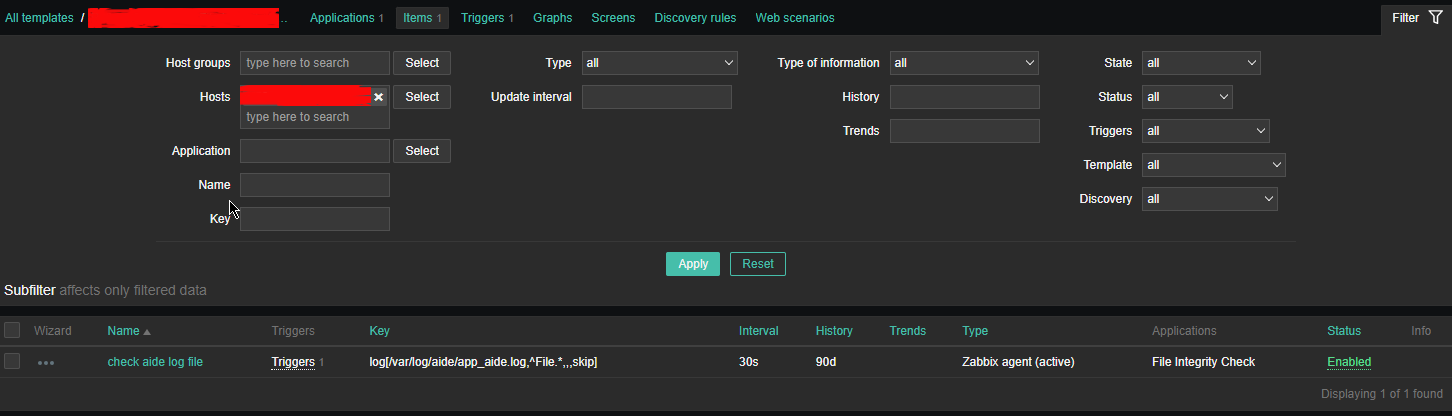
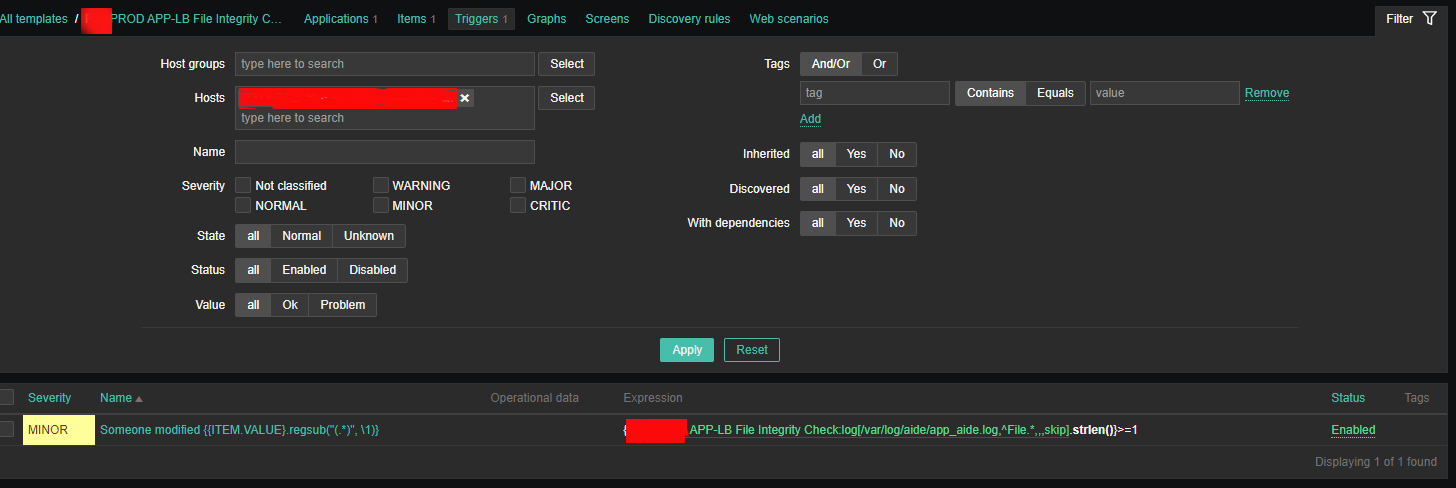
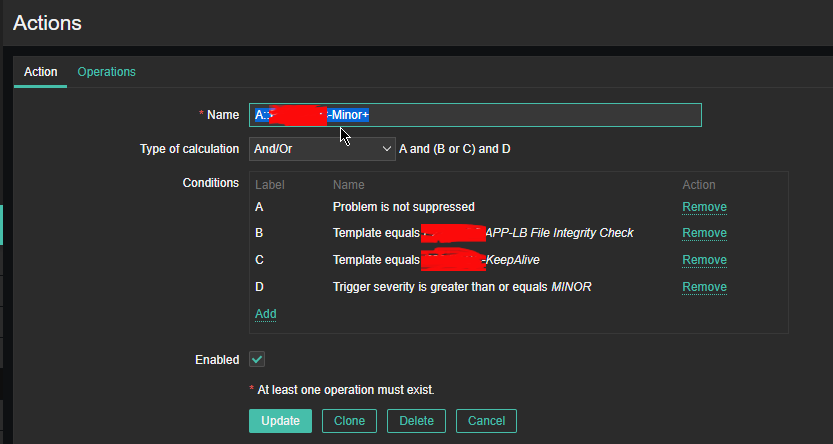
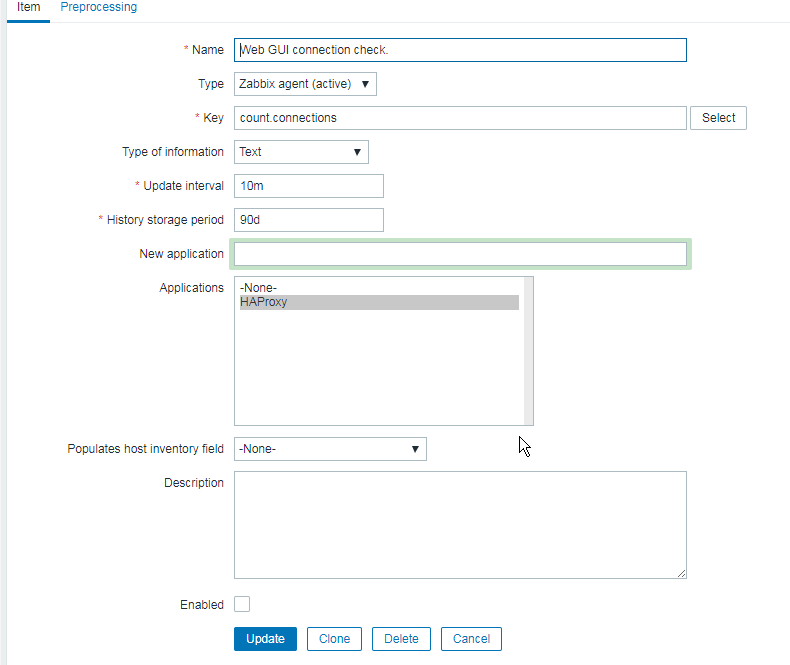
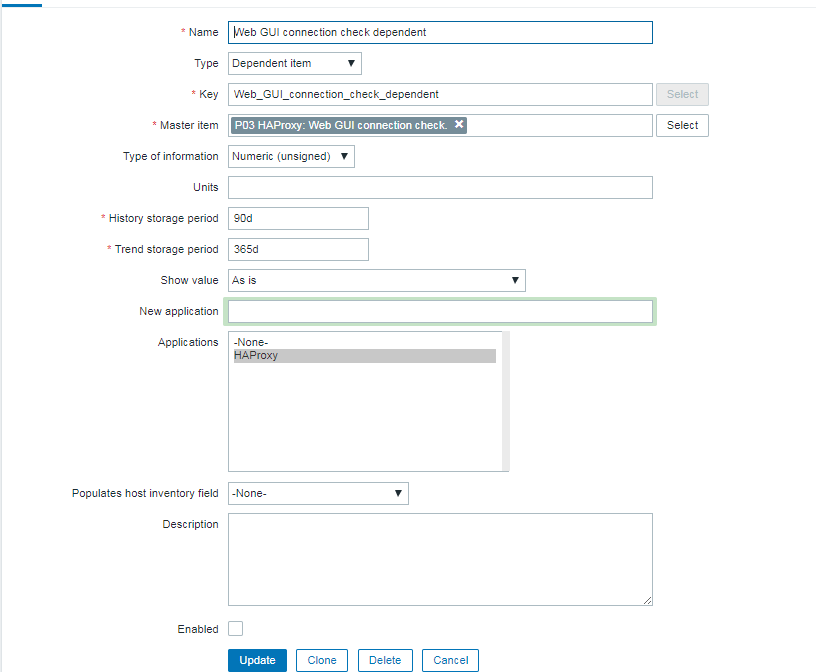
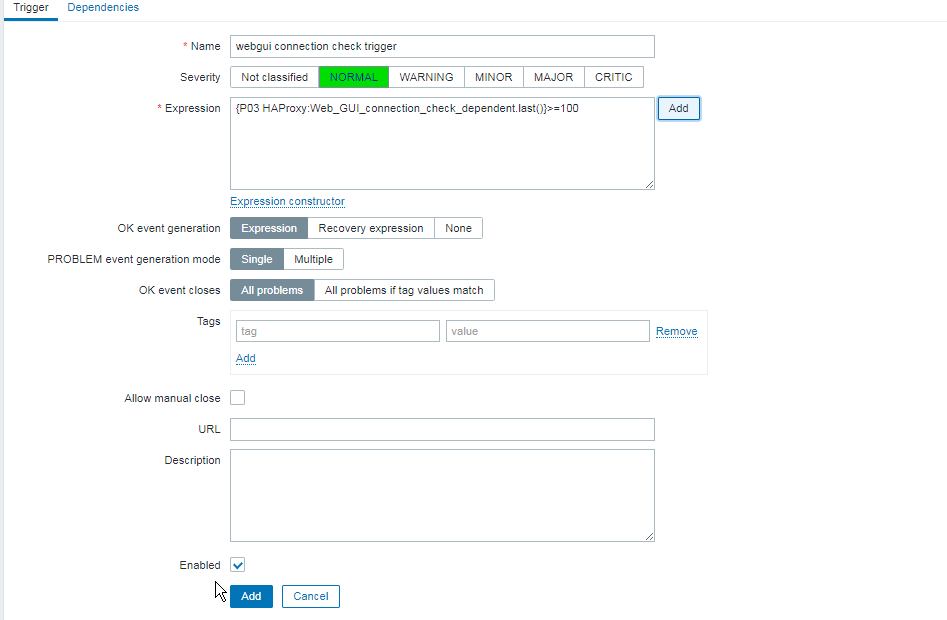
3. Configure in Zabbix for active.dc key Trigger and Item

active-node-switch1

OSCommerce how to change / reset lost admin password

Monday, October 16th, 2017

reset-forgotten-lost-oscommerce-password-howto-Os_commerce-logo.svg

How to change / reset OSCommerce lost / forgotten admin password?

The password in OSCommerce is kept in table "admin", so to reset password connect to MySQL with mysql cli client.

First thing to do is to generate the new hash string, you can do that with a simple php script using the md5(); function


root@pcfreak:/var/www/files# cat 1.php
<?
$pass=md5('password');
echo $pass;
?>


root@pcfreak:/var/www/files# php 1.php
5f4dcc3b5aa765d61d8327deb882cf99
root@pcfreak:/var/www/files#


Our just generated string (for text password password) is hash: 5f4dcc3b5aa765d61d8327deb882cf99

Next to update the new hash string into SQL, we connect to MySQL:


$ mysql -u root -p


And issue following command to modify the encrypted hash string:


UPDATE `DB`.`admin` SET `admin_password` = '5f4dcc3b5aa765d61d8327deb882cf99' WHERE `admin`.`admin_id` = 6;

MobaXTerm: A good gnome-terminal like tabbed SSH client for Windows / Windows Putty Tabs Alternative

Wednesday, November 13th, 2013

Mobaxterm ssh client putty MS Windows alternative with tabs suitable for ex linux users

mobaxterm with tabbed ssh connections screenshot best putty windows ssh client alternative now

Last 10+ years I worked on GNU / Linux as Desktop. Last 7 years most of my SSH connections were managed from GNOME and I'm quite used to gnome-terminal ssh tabbing. In my new Employee Hewlett Packard. I'm forced to work on Microsoft Windows 7 and thus I used for a month or so Putty and Kitty fork from version 0.63 of PuTTY advertising itself as the best telnet / SSH client in the world. Both of the two lack tabbing and have interface which is pretty unfamiliar to me. As I'm so used to using native UNIX terminal. Fortunately a colleague of mine Ivelin was using an SSH client called MobaXTerm which very much did emulation similar to my favourite gnome-terminal. MobaXterm is not free software / open source app but this doesn't matter so much to me as anyways I'm running a non-free Win OS on my desktop. What makes MobaXterm so attractive is its rich functionality (cosmic years infront of Putty).

Here is website description of MobaXterm quoted from its website:

MobaXterm is an enhanced terminal for Windows with an X11 server, a tabbed SSH client and several other network tools for remote computing (VNC, RDP, telnet, rlogin). MobaXterm brings all the essential Unix commands to Windows desktop, in a single portable exe file which works out of the box.

Overall list of features MobaXterm offers are;

  •     multitab terminal with embedded Unix commands (ls, cd, cat, sed, grep, awk, rsync, wget, …)

  •     embedded X11 server for easily exporting your Unix/Linux display

  •     a session manager with several network utilities: SSH, RDP, VNC, Telnet, Rlogin, FTP, SFTP and XDMCP

  •     passwords management for SSH, RDP, VNC, SFTP (on demand password saving)

  •     easy graphical file transfer using drag and drop during SSH sessions

  •     advanced SSH tunnels creation tool (graphical port forwarding builder)

  •     tasks automation using scripts or macros

Mobaxterm is portable just like Putty so its useful to use on HOP stations to servers like used in big companies like HP. Featured embedded Unix commands (e.g., ls, cd, cat, sed, grep, awk, rsync, wget) gives a feeling like you're working on pure Linux console making people addicted to Linux / BSD quite confortable. Some other very useful terminal emulator functions are support for anti-aliasing session manager (save / remember passwords for ssh sessions in Crypted format so much missing in Putty) and it even supports basic macros.
Basic UNIX commands embedded in MobaXterm are taken and ported from Cygwin projectLinux-like environment for Windows making it possible to port software running on POSIX systems (such as Linux, BSD, and Unix systems) to Windows. A very cool think is also MobaXterm gives you a Linux like feel of console navigation in between basic files installed from Cygwin. Some downside I found is program menus which look at first glimpse a bit confusing especially for people used to simplicity of gnome-terminal. Once logged in to remote host via ssh command the program offers you to log you in also via SFTP protocol listing in parallel small window with possibility to navigate / copy / move etc. between server files in SFTP session which at times is pretty useful as it saves you time to use some external SFTP connector tools like  WinSCP.

From Tools configuration menu, there are few precious tools as well;
         – embedded text editor MobaTextEditor
         – MobaFoldersDiff (Able to show diffeernces between directories)
         – AsciiTable (Complete List of Ascii table with respective codes and characters)
         – Embedded simple Calculator
         – List open network ports – GUI Tool to list all open ports on Windows localhost
         – Network packets capture – A Gui tool showing basic info like from UNIX's tcpdump!
         – Ability to start quickly on local machine (TFTP, FTP, SFTP / SSH server, Telnet server, NFS server, VNC Server and even simple implementation of HTTP server)

Mobaxterm list of tools various stuff

         Mobaxterm run various services quickly on Windows servers management screenshot

Below are few screenshots to get you also idea about what kind of configuration MobaXterm supports
  mobaxterm terminal configuration settings screenshot

mobaxterm better putty alternative x11 configuration tab screenshot

mobaxterm windows ssh client for linux users configuration ssh tab screenshot

mobaxterm-putty-alternative-for-windows-configuration-display-screenshot
MobaXTerm Microsoft Windows ssh client configuration misc menu screenshot
To configure and use Telnet, RSH, RDP, VNC, FTP etc. Sessions use the Sessions tab on top menu.

One very handy thing is MobaXterm supports export of remote UNIX display with no requirement to install special Xserver like already a bit obsolete Xming – X server for Windows.
The X Display Manager Control Protocol (XCMCP) is a key feature of the X11 architecture. Together with XDMCP, the X network protocol allows distributed operation of the X server and X display manager. The requesting X server runs on the client (usually as an X terminal), thus providing a login service, that why the X server ported to MobaXterm from Cygwin also supports XDMCP. If, for example, you want to start a VNC session with a remote VNC server, all you have to do is enter the remote VNC server’s IP address in the VNC area; the default VNC port is already registered.

Accessing the remote Windows server via RDP (Remote Desktop Protocol) is also a piece of cake. Once you establish a session to RDP or other Proto it is possible to save this session so later you just choose between session to access. The infamous (X11 Port Forwarding) or creation of SSH encrypted tunnels between hosts to transfer data securily or hide your hostname is also there.

MobaXterm is undoubtedly a very useful and versatile tool. Functionally, the software is well mannered, and Windows users who want to sniff a little Linux/Unix air can get a good idea of how Linux works. A closer look reveals that anything you can do with MobaXterm can be achieved directly with freely available tools (Cygwin) and Unix tools ported from Cygwin. However, although Cygwin provides a non-Posix environment for Windows, it doesn’t offer a decent terminal, which is one thing Moba-Xterm has going for it.

Admittedly, in pure vanilla Cygwin, you can start an X server automatically and then use xterm, but xterm lacks good-quality fonts, whereas MobaXterm conveniently lets you integrate a font server.

How to make a mysql root user to login interactive with mysql cli passwordless

Wednesday, June 29th, 2011

MySQL Logo Passwordless root login .my.cnf

I’m using access to the mysql servers via localhost with mysql cli on daily basis.
With time I’ve figured out that it’s pretty unahandy to always login with my root mysql password, I mean each time to enter it, e.g.:

root@mysql-server:~# mysql -u root
Enter password:
...

Thus to make my life a way easier I decided to store my mysql root password in order to allow my root admin user to be able to login to my mysql server without asking for password. This saves time and nerves, as I’m not supposed to look up for the password file I store my server mysql root pass.

To allow my mysql cli interface, to login passwordless to the SQL server I had to create the file /root/.my.cnf readable only for my root user and store my MySQL username and password there.

Here is a sample /root/.my.cnf file:

root@mysql-server:~# cat /root/.my.cnf
[client]
user="root"
pass="mysecretMySQLPasswordgoeshere"

Now next time I use the mysql console interface to access my mysql server I don’t have to supply the password, here is how easier is the mysql login afterwards:

root@mysql-server:~# mysql -u root
Welcome to the MySQL monitor. Commands end with ; or g.
Your MySQL connection id is 3520
Server version: 5.0.77 Source distribution

Type ‘help;’ or ‘h’ for help. Type ‘c’ to clear the buffer.

mysql>

The only downside of using .my.cnf to store permanently the mysql server root and password is from security standpoint.
If for instance somebody roots my servers, where I have stored my root user/pwds in .my.cnf , he will be able immediately to get access to the MySQL server.

Another possible security flaw with using the mysql passwordless login “trick” is if somebody forgets to set proper file permissions to, .my.cnf

Once again the file should possess the permissons of:

root@mysql-server:~# ls -al /root/.my.cnf
-rw------- 1 root root 90 Apr 2 00:05 /root/.my.cnf

Any other permissons might allow non-privileged users to read the file and gain unathorized admin access to the SQL server.
 

How to disable spammer domain in QMAIL mail server with badmailto variable

Thursday, July 12th, 2012

I've recently noticed one of the qmail SMTP servers I adminster had plenty of logged spammer emails originating from yahoo.com.tw destined to reache some random looking like emails (probably unexisting) again to *@yahoo.com.tw

The spam that is tried by the spammer is probably a bounce spam, since it seems there is no web-form or anything wrong with the qmail server that might be causing the spam troubles.
As a result some of the emails from the well configured qmail (holding SPF checks), having a correct existing MX, PTR record and even having configured Domain Keys (DKIM) started being marked, whether emails are sent to *@yahoo.com legit emails.

To deal with the shits, since we don't have any Taiwanese (tw) clients, I dediced to completely prohibit any emails destined to be sent via the mail server to *@yahoo.com.tw. This is done via /var/qmail/control/badmailto qmail control variable;

Here is content of /var/qmail/control/badmailto after banning outgoing emails to yahoo.com.tw;;;

qmail:~# cat /var/qmail/control/badmailto
[!%#:\*\^]
[\(\)]
[\{\}]
@.*@
*@yahoo.com.tw

The first 4 lines are default rules, which are solving a lot of badmailto common sent emails. Thanks God after a qmail restart:

qmail:~# qmailct restart
....

Checking in /var/log/qmail-sent/current, there are no more outgoing *@yahoo.com.tw destined emails. Problem solved …