There are plenty of ways to track graphically server performance in Web (Nagios, Munin, Zabbix, OpenNMS) etc.
Though Munin and Nagios is a great choice for people who prefer simplicity in installation and maintanenance. If you're looking for customizable reports and time windows history on how server (network, cpu, memory, hdd or services) behaved you will probably need to consider using Cacti.
Cacti is a complete network graphing solution designed to harness the power of RRDTool's data storage and graphing functionality. Cacti provides a fast poller, advanced graph templating, multiple data acquisition methods, and user management features out of the box. All of this is wrapped in an intuitive, easy to use interface that makes sense for LAN-sized installations up to complex networks with hundreds of devices.
Cacti is very much like Munin except Cacti gives you the possibility to select and show statistics for periods in time, making it very convenient to check how server/servers services performed historically in time.
Cacti is a bunch of PHP scripts that gives a nice frontend to the famous RRDTool, it stores all gathered service statistics information in a MySQL database. Web frontend queries the SQL to craete graphs and populate them with data . Cacti has SNMP protocol support for those used to creating traffic graphs with MRTG.
Its easily extendable, there is a "tree view", which allows you to put graphs onto a hierarchical tree for organizational purposes, there is a user based management tool built in so you can add users and give them rights to certain areas of cacti. You can create users that can change graph parameters, while others can only view graphs. Each user also maintains their own settings when it comes to viewing graphs.
Cacti has prebuilt packages for major Linux distributions as well as FreeBSD ports.
Native packages are available via distros repositories for:
Fedora, Debian, SuSE and Gentoo Linux
To work properly Cacti depends on following external packages to be installed:
- Apache HTTPD
- MySQL
- PHP
- RRDTool
- Net-Snmp
- PHP-MySQL module
- PHP-Snmp module
1. Install Cacti on Debian 7 or Ubuntu Linux
On Debian based distributions Installation of Cacti is super easy. If you're a debian admin it will save you time:
Cacti package is very well crafted on Debian to have it installed all you have to do is apt-get it:
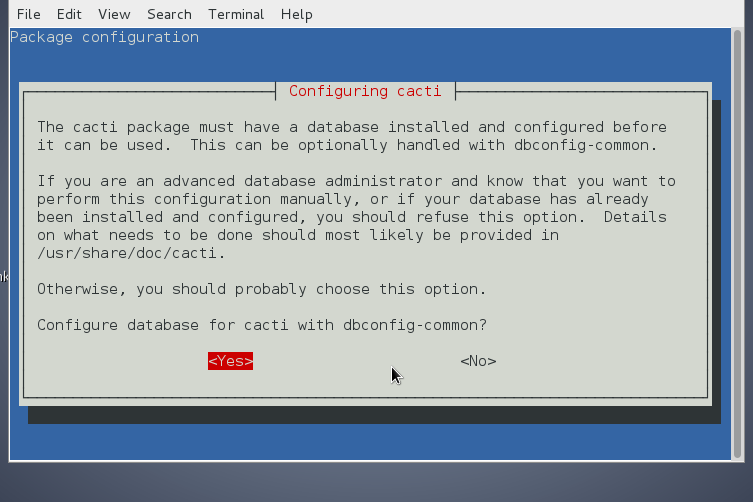
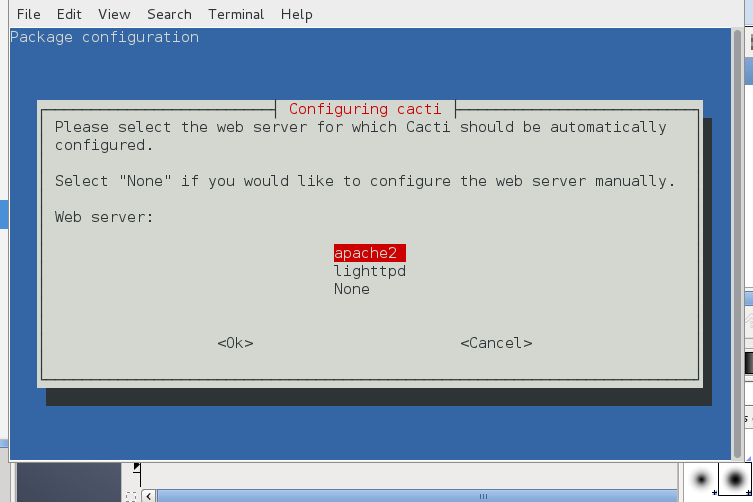
apt-get install --yes cacti snmpd
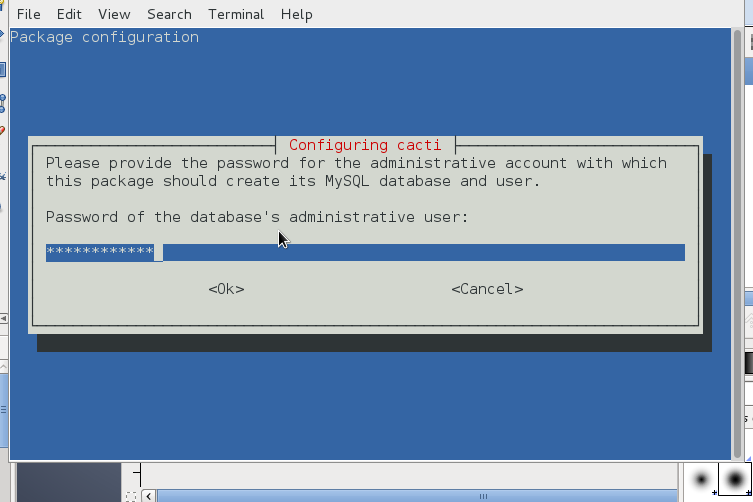
You will be prompted a couple of screens requiring you to fill in your MySQL root password (necessery for connection and import of cacti.sql database and tables skele and creation of new user with which cacti will query the db-server.)
mv /etc/snmp/snmpd.conf /etc/snmp/snmpd.conf.bak
vi /etc/snmp/snmpd.conf
# this will make snmpd listen on all interfaces
agentAddress udp:161
# a read only community 'myCommunity' and the source network is defined
rocommunity myCommunity 192.168.10.5
rocommunity myCommunity 127.0.0.1
sysLocation Earth
sysContact email@your-domain.com
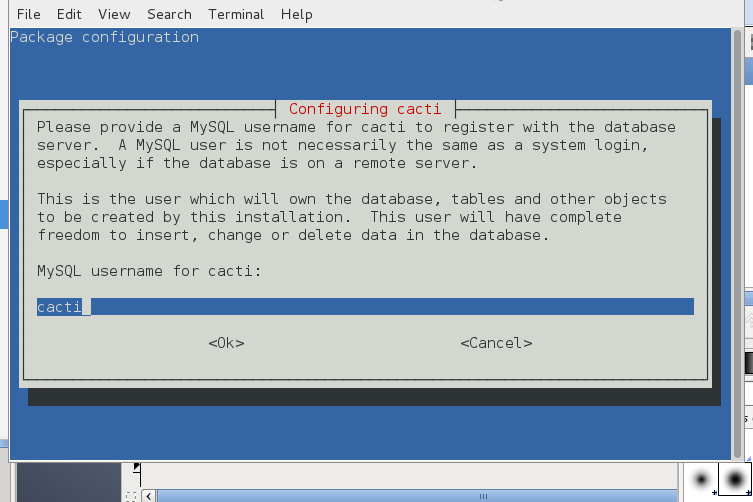
You will be next prompted to fill in user and password for cacti user, type whatever you like it to be and save the password somewhere for later use.
After installing it Cacti cron will automatically be added to collect cacti statistics on every 5 minutes, e.g.:
cat /etc/cron.d/cacti
MAILTO=root
*/5 * * * * www-data php /usr/share/cacti/site/poller.php >/dev/null 2>/var/log/cacti/poller-error.log
Cacti Cron job script has to run multiple times until Cacti Graphics gets generated so wait for it 5, 10 minutes or run it manually with www-data user credentials
poller.php is making queries to MySQl and connecting to SNMP service on localhost querying information for configured monitoring from Console
rrd data is stored in /var/lib/cacti/rra
You will have to also create manually following files which will be used by cactito store rrd data.
In case of issues with cacti check that permissionsof filesinthere are correct
To do su run:
su www-data -s /bin/sh
touch /var/lib/cacti/rra/localhost_mem_buffers_3.rrd

/var/lib/cacti/rra/localhost_load_1min_5.rrd

/var/lib/cacti/rra/localhost_users_6.rrd

/var/lib/cacti/rra/localhost_proc_7.rrd
2. Install Cacti on Fedora / CentOS Linux
Installation on Fedora is a little pain in the ass as there is plenty of things to do manually to have cacti working
a) Install pre-required RPM packages
yum -y install mysql-server mysql php-mysql php-pear php-common php-gd php-devel php php-mbstring php-cli php-snmp php-pear-Net-SMTP php-mysql httpd net-snmp-utils php-snmp net-snmp-libs
Note! that if you already have a server with Apache + PHP configured many of above packages will report to be installed.
Whether mysql-server was not existing previously, change your MySQL password to a new-one
mysqladmin -u root password NEWPASSWORD
Create database for Cacti to store collected data:
mysql -u root -p -e 'create database cacti'
Connect to mysql server and create cacti user:
mysql> GRANT ALL ON cacti.* TO cacti@localhost IDENTIFIED BY 'very-secret-password';

mysql> FLUSH privileges;
Create SNMP configuration for Cacti and start SNMP
vi /etc/snmp/snmpd.conf
and paste into it:
com2sec local localhost public
group MyRWGroup v1 local
group MyRWGroup v2c local
group MyRWGroup usm local
view all included .1 80
access MyRWGroup "" any noauth exact all all none
syslocation Unknown (edit /etc/snmp/snmpd.conf)
syscontact Root (configure /etc/snmp/snmp.local.conf)
pass .1.3.6.1.4.1.4413.4.1 /usr/bin/ucd5820stat
Start SNMPD and make it start automatically on Fedora boot
# /etc/init.d/snmpd start

# chkconfig snmpd on
Test whether SNMP server is properly working and returning info:
snmpwalk -v 1 -c public localhost IP-MIB::ipAdEntIfIndex
You should get output like:
IP-MIB::ipAdEntIfIndex.192.168.10.5 = INTEGER: 2
IP-MIB::ipAdEntIfIndex.217.xx.xx.xxx = INTEGER: 3
IP-MIB::ipAdEntIfIndex.127.0.0.1 = INTEGER: 1
Install Cacti package:
yum -y install cacti
Import Cacti initial SQL data:
– Check in RPM package where is default cacti.sql
rpm -ql cacti | grep cacti.sql
/usr/share/doc/cacti-0.8.7i/cacti.sql
mysql -u cacti -p very-secret-password < /usr/share/doc/cacti-0.8.7i/cacti.sql
Configure Cacti:
vi /etc/cacti/db.php
/* make sure these values refect your actual database/host/user/password */
$database_type = "mysql";
$database_default = "cacti";
$database_hostname = "localhost";
$database_username = "cacti";
$database_password = "very-secret-password";
$database_port = "3306";
A small note to make here is Cacti can be configured to also work with MariaDB backend but, I haven't tried it so far …
Set Cacti cronjob to periodically update cacti stats
vi /etc/cron.d/cacti
*/5 * * * * cacti /usr/bin/php /usr/share/cacti/poller.php > /dev/null 2>&1
Make Cacti accessible from Web – add cacti alias in Apache
vi /etc/httpd/conf.d/cacti.conf
#
# Cacti: An rrd based graphing tool
#
Alias /cacti /usr/share/cacti
<Directory /usr/share/cacti/>
Order Deny,Allow
Deny from all
Allow from 10.0.0.0/8
</Directory>
Restart Apache to load new config
/etc/init.d/httpd restart
3. Install Cacti on Gentoo Linux
Modify your /etc/make.conf so USE="" options looks like this:
USE="symlink mmx sse sse2 bash-completion vhosts xml sockets snmp"
Install Cacti, PHP and Apache and webapp-config with emerge (Gentoo package manager)
emerge apache php cacti webapp-config
Hopefully all should get installed properly, if you get an error like "Could not read settings from webapp-config" run:
cd /etc/

etc-update
Create a vhost if you don’t already have one and then run the following. Then install cacti to the vhost using webapp-config. Remember to change the -h option to reflect the name of your vhost and that you may need to set a different cacti version number if cacti has been updated since I posted this article.
webapp-config -I -h yourdomain.com -d cacti cacti 0.8.7e-r1
mysqladmin -p --user=root create cacti mysql -p --user=root cacti < /var/www/yourdomain.com/htdocs/cacti/cacti.sql mysql -p --user=root mysql GRANT ALL ON cacti.* TO cactiuser@localhost IDENTIFIED BY 'somepassword'; flush privileges;
Add a cron entry to your tab to get Cacti to update. Add the following entry to your crontab updating the path as needed
crontab -u root -e
And paste
*/5 * * * * apache /usr/bin/php /var/www/yourdomain.com/htdocs/cacti/poller.php > /dev/null 2>&1
Now open in a browser:
http://yourdomain.com/cacti
Login with user / pass admin / admin
After logging, Click Graphs tab (located on left top) corner and after a while your should see the graphs start to be drawn.
3. Install Cacti on OpenSuSE
Install Cacti from Yast suse package manager. A very good complete instructions on OpenSuSE installation is here
4. Configuring Cacti to draw statistics for host
So far so good now Cacti is installed but to make it generate its configuration its necessery to do some configuration tampering.
Cacti's configuration is pretty obscure and it needs time and a couple of tries until you have learned how to configure statistics generation.
Cacti's web interface is divided by two major parts Console (From which all kind of configuration is done) and Graphs (From here all confugured graphs can be expected, and information for time periods setted services, memory, CPU, hard drive, etc. can be obtained).
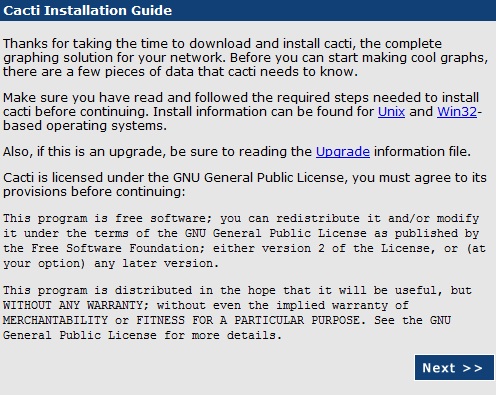
To Complete Cacti installation and configuration using a web-browser
Access URL:
http://your-domain.com/cacti/
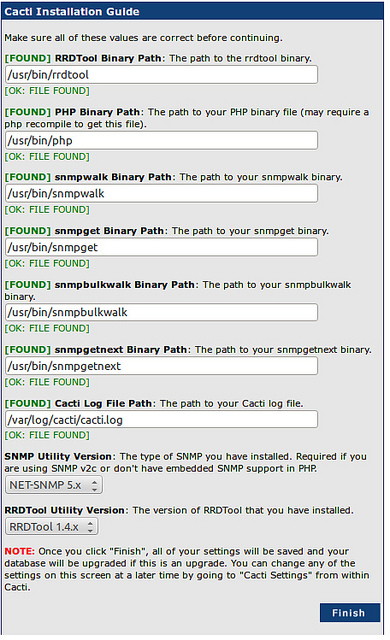
By default Cacti is configured to have user admin with password admin. Login to Cacti and you will be prompted to change default password – set it to whatever you like.
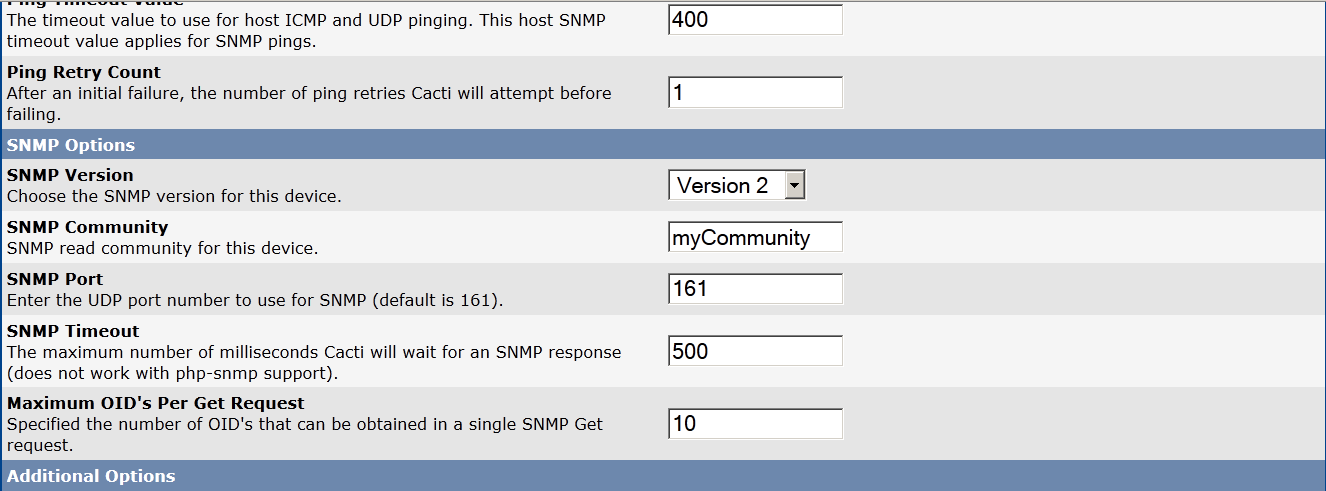
Configure Cacti to do SNMP data collection
Cacti will use SNMP protocol to obtain server traffic statistics and visualize them.
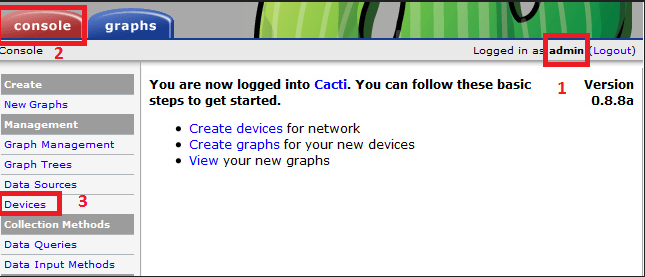
Click on:
Devices -> Add
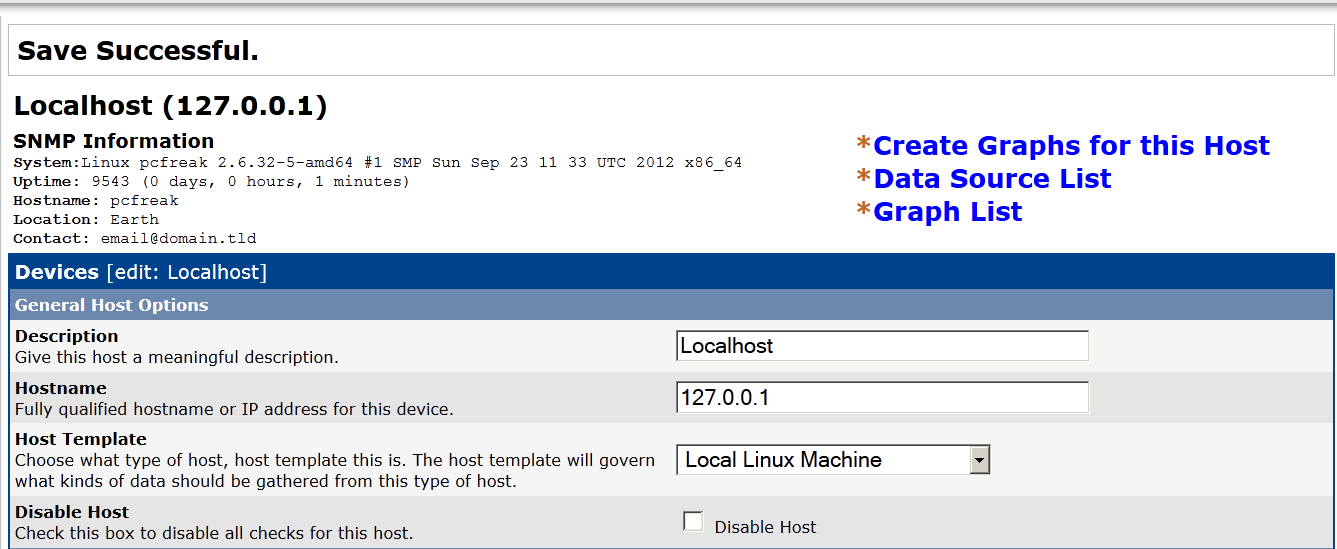
Fill in only fields (and let the rest as it is):
Description: Pc-freak.net
hostname: 127.0.0.1
Select for SNMP Version (drop down menu): SNMP Version 2
and then click on
Create button (located right down)
Here I've used localhost (127.0.0.1) as a hostname, because localhost server is to be monitored for remote monitoring of cacti set the REMOTE IP or hostname instead.
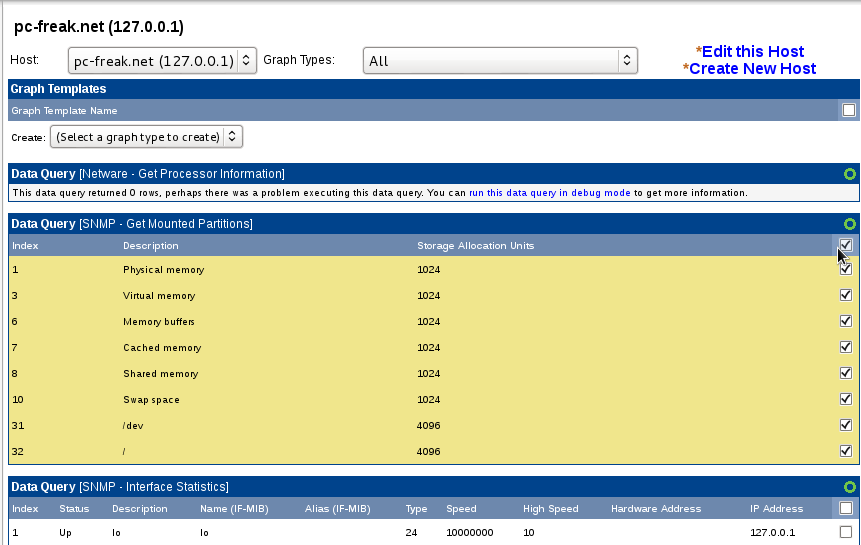
In field Associated Data queries add Data query for:
SNMP – Get Mounted Partitions
SNMP – Get Process Information
SNMP – Interface statistisc
P.S. Use the Add button for all this ..
Create SNMP graphs collection for first time
Click on Create Graphs for this Host see – top right side.

Select on SNMP – Interface Statistics
Choose a graph type (for exmp. In/Out bytes with total bandwidth)
To Finalize click Create button
Create Graphs for this host
Creating Graph Trees
Use Console -> Graph Trees -> Add -> Sample Tree
Choose:
Setting type: Manual Ordering (No Sorting)
Tree Item Type: Graph
Graph: Server Name – Traffic eth0
Then press Create (button)
To verify the graphs are drawed corretly in a while go to:
Graphs -> Sample Tree (or whatever you named the tree during creation)
Interface Graphs and 64-bit Counters
By default, Cacti uses 32-bit counters in SNMP queries. 32-bit counters are sufficient for most bandwidth graphs, but they do not work correctly for graphs greater than 100 Mbps. If it is known that the bandwidth will exceed more than 100 Mbps, it is always advisable to use 64-bit counters. Using 64-bit counters is not hard at all.
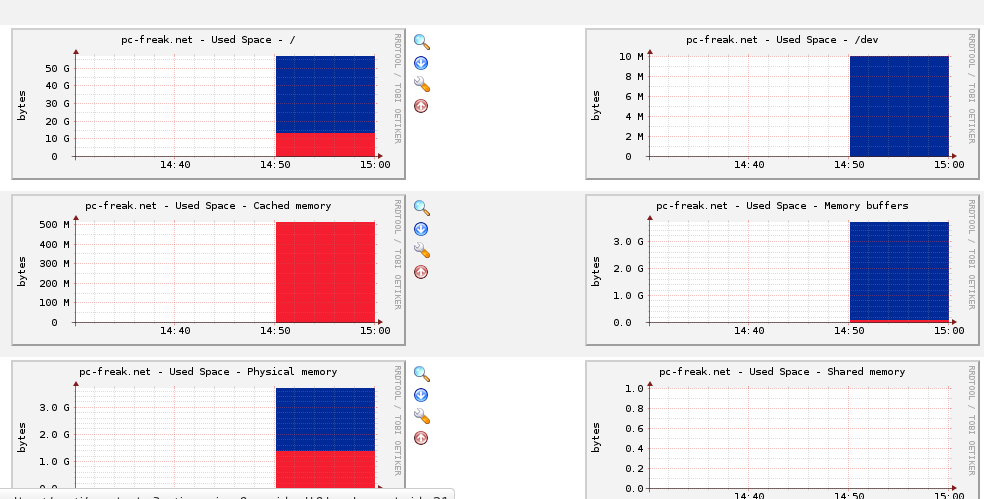
Note! It takes usually around 15 minutes for Cacti to populate new graphs. There is no option to run cacti on cron manually but you have to wait
After some time of Cacti running, you will end up with nice graphics like this:
If you get some issues and even after 15 / 20 minutes you still don't have the graphics drawed to debug the issues check for errors in:
/var/log/apache2/error.log – If there are missing rra files this should be logged here
/var/log/cacti/cacti.log
/var/log/cacti/poller-error.log – If the reason for not drawing the graphics is permissions errors will be here
/var/log/rrd.log – should contain rrd related errors
Important thing to mention is Cacti is requiring php exec() option to be functional. On hosts which has disabled exec(); function for security reasons cacti will fail to produce graphs.
References and thanks to:
http://xmodulo.com/2013/11/monitor-linux-servers-snmp-cacti.html

http://openmaniak.com/cacti_tutorial.php http://www.cacti.net/

http://www.debianhelp.co.uk/cacti.htm