Posts Tagged ‘How to’

How to update expiring OpenSSL certificates without downtime on haproxy Pacemaker / Corosync PCS Cluster

Tuesday, July 19th, 2022

pcm-active-passive-scheme-corosync-pacemaker-openssl-renew-fix-certificate

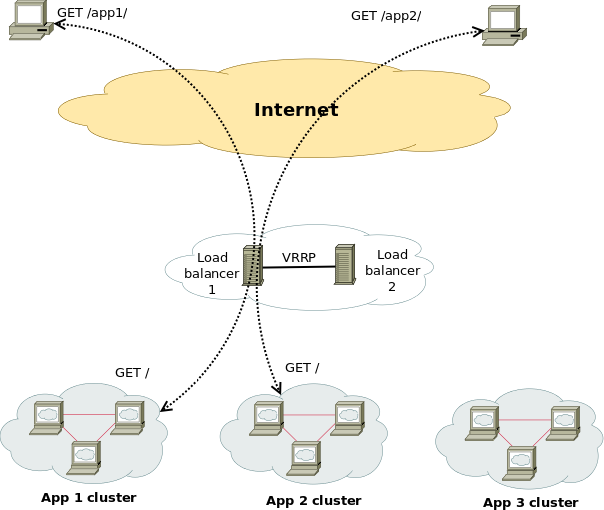
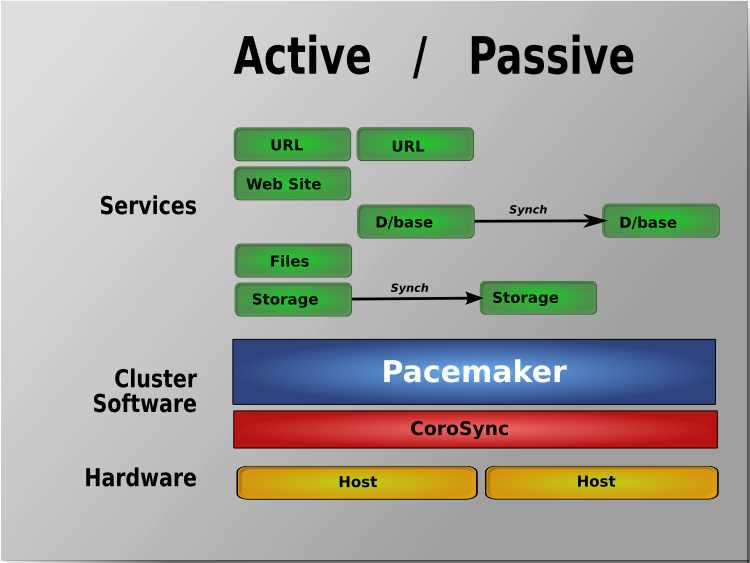
Lets say you have a running PCS Haproxy cluster with 2 nodes and you have already a configuration in haproxy with a running VIP IP and this proxies
are tunneling traffic to a webserver such as Apache or directly to an Application and you end up in the situation where the configured certificates,
are about to expire soon. As you can guess having the cluster online makes replacing the old expiring SSL certificate with a new one relatively easy
task. But still there are a couple of steps to follow which seems easy but systemizing them and typing them down takes some time and effort.
In short you need to check the current certificates installed on the haproxy inside the Haproxy configuration files,
in my case the haproxy cluster was running 2 haproxy configs haproxyprod.cfg and haproxyqa.cfg and the certificates configured are places inside this
configuration.

Hence to do the certificate update, I had to follow few steps:

A. Find the old certificate key or generate a new one that will be used later together with the CSR (Certificate Request File) to generate the new Secure Socket Layer
certificate pair.
B. Either use the old .CSR (this is usually placed inside the old .CRT certificate file) or generate a new one
C. Copy those .CSR file to the Copy / Paste buffer and place it in the Website field on the step to fill in a CSR for the new certificate on the Domain registrer
such as NameCheap / GoDaddy / BlueHost / Entrust etc.
D. Registrar should then be able to generate files like the the new ServerCertificate.crt, Public Key Root Certificate Authority etc.
E. You should copy and store these files in some database for future perhaps inside some database such as .xdb
for example you can se the X – Certificate and Key management xca (google for xca download).
F. Copy this certificate and place it on the top of the old .crt file that is configured on the haproxies for each domain for which you have configured it on node2
G. standby node1 so the cluster sends the haproxy traffic to node2 (where you should already have the new configured certificate)
H. Prepare the .crt file used by haproxy by including the new ServerCertificate.crt content on top of the file on node1 as well
I. unstandby node1
J. Check in browser by accessing the URL the certificate is the new one based on the new expiry date that should be extended in future
K. Check the status of haproxy
L. If necessery check /var/log/haproxy.log on both clusters to check all works as expected

haserver_cluster_sample

Below are the overall commands to use to complete below jobs

Old extracted keys and crt files are located under /home/username/new-certs

1. Check certificate expiry start / end dates


[root@haproxy-serv01 certs]# openssl s_client -connect 10.40.18.88:443 2>/dev/null| openssl x509 -noout -enddate
notAfter=Aug 12 12:00:00 2022 GMT

2. Find Certificate location taken from /etc/haproxy/haproxyprod.cfg / /etc/haproxy/haproxyqa.cfg

# from Prod .cfg
   bind 10.40.18.88:443 ssl crt /etc/haproxy/certs/www.your-domain.com.crt ca-file /etc/haproxy/certs/ccnr-ca-prod.crt 
 

# from QA .cfg

    bind 10.50.18.87:443 ssl crt /etc/haproxy/certs/test.your-domain.com.crt ca-file /etc/haproxy/certs

3. Check  CRT cert expiry


# for haproxy-serv02 qa :443 listeners

[root@haproxy-serv01 certs]# openssl s_client -connect 10.50.18.87:443 2>/dev/null| openssl x509 -noout -enddate 
notAfter=Dec  9 13:24:00 2029 GMT


[root@haproxy-serv01 certs]# openssl x509 -enddate -noout -in /etc/haproxy/certs/www.your-domain.com.crt
notAfter=Aug 12 12:00:00 2022 GMT

[root@haproxy-serv01 certs]# openssl x509 -noout -dates -in /etc/haproxy/certs/www.your-domain.com.crt 
notBefore=May 13 00:00:00 2020 GMT
notAfter=Aug 12 12:00:00 2022 GMT


[root@haproxy-serv01 certs]# openssl x509 -noout -dates -in /etc/haproxy/certs/other-domain.your-domain.com.crt 
notBefore=Dec  6 13:52:00 2019 GMT
notAfter=Dec  9 13:52:00 2022 GMT

4. Check public website cert expiry in a Chrome / Firefox or Opera browser

In a Chrome browser go to updated URLs:

https://www.your-domain/login

https://test.your-domain/login

https://other-domain.your-domain/login

and check the certs

5. Login to one of haproxy nodes haproxy-serv02 or haproxy-serv01

Check what crm_mon (the cluster resource manager) reports of the consistancy of cluster and the belonging members
you should get some output similar to below:

[root@haproxy-serv01 certs]# crm_mon
Stack: corosync
Current DC: haproxy-serv01 (version 1.1.23-1.el7_9.1-9acf116022) – partition with quorum
Last updated: Fri Jul 15 16:39:17 2022
Last change: Thu Jul 14 17:36:17 2022 by root via cibadmin on haproxy-serv01

2 nodes configured
6 resource instances configured

Online: [ haproxy-serv01 haproxy-serv02 ]

Active resources:

 ccnrprodlbvip  (ocf::heartbeat:IPaddr2):       Started haproxy-serv01
 ccnrqalbvip    (ocf::heartbeat:IPaddr2):       Started haproxy-serv01
 Clone Set: haproxyqa-clone [haproxyqa]
     Started: [ haproxy-serv01 haproxy-serv02 ]
 Clone Set: haproxyprod-clone [haproxyprod]
     Started: [ haproxy-serv01 haproxy-serv02 ]


6. Create backup of existing certificates before proceeding to regenerate expiring
On both haproxy-serv01 / haproxy-serv02 run:


# cp -vrpf /etc/haproxy/certs/ /home/username/etc-haproxy-certs_bak_$(date +%d_%y_%m)/


7. Find the .key file etract it from latest version of file CCNR-Certificates-DB.xdb

Extract passes from XCA cert manager (if you're already using XCA if not take the certificate from keypass or wherever you have stored it.

+ For XCA cert manager ccnrlb pass
Find the location of the certificate inside the .xdb place etc.

+++++ www.your-domain.com.key file +++++

—–BEGIN PUBLIC KEY—–

—–END PUBLIC KEY—–


# Extracted from old file /etc/haproxy/certs/www.your-domain.com.crt
 

—–BEGIN RSA PRIVATE KEY—–

—–END RSA PRIVATE KEY—–


+++++

8. Renew Generate CSR out of RSA PRIV KEY and .CRT

[root@haproxy-serv01 certs]# openssl x509 -noout -fingerprint -sha256 -inform pem -in www.your-domain.com.crt
SHA256 Fingerprint=24:F2:04:F0:3D:00:17:84:BE:EC:BB:54:85:52:B7:AC:63:FD:E4:1E:17:6B:43:DF:19:EA:F4:99:L3:18:A6:CD

# for haproxy-serv01 prod :443 listeners

[root@haproxy-serv02 certs]# openssl x509 -x509toreq -in www.your-domain.com.crt -out www.your-domain.com.csr -signkey www.your-domain.com.key


9. Move (Standby) traffic from haproxy-serv01 to ccnrl0b2 to test cert works fine

[root@haproxy-serv01 certs]# pcs cluster standby haproxy-serv01


10. Proceed the same steps on haproxy-serv01 and if ok unstandby

[root@haproxy-serv01 certs]# pcs cluster unstandby haproxy-serv01


11. Check all is fine with openssl client with new certificate


Check Root-Chain certificates:

# openssl verify -verbose -x509_strict -CAfile /etc/haproxy/certs/ccnr-ca-prod.crt -CApath  /etc/haproxy/certs/other-domain.your-domain.com.crt{.pem?)
/etc/haproxy/certs/other-domain.your-domain.com.crt: OK

# openssl verify -verbose -x509_strict -CAfile /etc/haproxy/certs/thawte-ca.crt -CApath  /etc/haproxy/certs/www.your-domain.com.crt
/etc/haproxy/certs/www.your-domain.com.crt: OK

################# For other-domain.your-domain.com.crt ##############
Do the same

12. Check cert expiry on /etc/haproxy/certs/other-domain.your-domain.com.crt

# for haproxy-serv02 qa :15443 listeners
[root@haproxy-serv01 certs]# openssl s_client -connect 10.40.18.88:15443 2>/dev/null| openssl x509 -noout -enddate
notAfter=Dec  9 13:52:00 2022 GMT

[root@haproxy-serv01 certs]#  openssl x509 -enddate -noout -in /etc/haproxy/certs/other-domain.your-domain.com.crt 
notAfter=Dec  9 13:52:00 2022 GMT


Check also for 
+++++ other-domain.your-domain.com..key file +++++
 

—–BEGIN PUBLIC KEY—–

—–END PUBLIC KEY—–


# Extracted from /etc/haproxy/certs/other-domain.your-domain.com.crt
 

—–BEGIN RSA PRIVATE KEY—–

—–END RSA PRIVATE KEY—–


+++++

13. Standby haproxy-serv01 node 1

[root@haproxy-serv01 certs]# pcs cluster standby haproxy-serv01

14. Renew Generate CSR out of RSA PRIV KEY and .CRT for second domain other-domain.your-domain.com

# for haproxy-serv01 prod :443 renew listeners
[root@haproxy-serv02 certs]# openssl x509 -x509toreq -in other-domain.your-domain.com.crt  -out domain-certificate.com.csr -signkey domain-certificate.com.key


And repeat the same steps e.g. fill the CSR inside the domain registrer and get the certificate and move to the proxy, check the fingerprint if necessery
 

[root@haproxy-serv01 certs]# openssl x509 -noout -fingerprint -sha256 -inform pem -in other-domain.your-domain.com.crt
SHA256 Fingerprint=60:B5:F0:14:38:F0:1C:51:7D:FD:4D:C1:72:EA:ED:E7:74:CA:53:A9:00:C6:F1:EB:B9:5A:A6:86:73:0A:32:8D


15. Check private key's SHA256 checksum

# openssl pkey -in terminals-priv.KEY -pubout -outform pem | sha256sum
# openssl x509 -in other-domain.your-domain.com.crt -pubkey -noout -outform pem | sha256sum

# openssl pkey -in  www.your-domain.com.crt-priv-KEY -pubout -outform pem | sha256sum

# openssl x509 -in  www.your-domain.com.crt -pubkey -noout -outform pem | sha256sum


16. Check haproxy config is okay before reload cert


# haproxy -c -V -f /etc/haproxy/haproxyprod.cfg
Configuration file is valid


# haproxy -c -V -f /etc/haproxy/haproxyqa.cfg
Configuration file is valid

Good so next we can the output of status of certificate

17.Check old certificates are reachable via VIP IP address

Considering that the cluster VIP Address is lets say 10.40.18.88 and running one of the both nodes cluster to check it do something like:
 

# curl -vvI https://10.40.18.88:443|grep -Ei 'start date|expire date'


As output you should get the old certificate


18. Reload Haproxies for Prod and QA on node1 and node2

You can reload the haproxy clusters processes gracefully something similar to kill -HUP but without loosing most of the current established connections with below cmds:

Login on node1 (haproxy-serv01) do:

# /usr/sbin/haproxy -f /etc/haproxy/haproxyprod.cfg -D -p /var/run/haproxyprod.pid  -sf $(cat /var/run/haproxyprod.pid)
# /usr/sbin/haproxy -f /etc/haproxy/haproxyqa.cfg -D -p /var/run/haproxyqa.pid  -sf $(cat /var/run/haproxyqa.pid)

repeat the same commands on haproxy-serv02 host

19.Check new certificates online and the the haproxy logs

# curl -vvI https://10.50.18.88:443|grep -Ei 'start date|expire date'

*       start date: Jul 15 08:19:46 2022 GMT
*       expire date: Jul 15 08:19:46 2025 GMT


You should get the new certificates Issueing start date and expiry date.

On both nodes (if necessery) do:

# tail -f /var/log/haproxy.log

How to monitor Haproxy Application server backends with Zabbix userparameter autodiscovery scripts

Friday, May 13th, 2022

zabbix-backend-monitoring-logo

Haproxy is doing quite a good job in High Availability tasks where traffic towards multiple backend servers has to be redirected based on the available one to sent data from the proxy to. 

Lets say haproxy is configured to proxy traffic for App backend machine1 and App backend machine2.

Usually in companies people configure a monitoring like with Icinga or Zabbix / Grafana to keep track on the Application server is always up and running. Sometimes however due to network problems (like burned Network Switch / router or firewall misconfiguration) or even an IP duplicate it might happen that Application server seems to be reporting reachable from some monotoring tool on it but unreachable from  Haproxy server -> App backend machine2 but reachable from App backend machine1. And even though haproxy will automatically switch on the traffic from backend machine2 to App machine1. It is a good idea to monitor and be aware that one of the backends is offline from the Haproxy host.
In this article I'll show you how this is possible by using 2 shell scripts and userparameter keys config through the autodiscovery zabbix legacy feature.
Assumably for the setup to work you will need to have as a minimum a Zabbix server installation of version 5.0 or higher.

1. Create the required  haproxy_discovery.sh  and haproxy_stats.sh scripts 

You will have to install the two scripts under some location for example we can put it for more clearness under /etc/zabbix/scripts

[root@haproxy-server1 ]# mkdir /etc/zabbix/scripts

[root@haproxy-server1 scripts]# vim haproxy_discovery.sh 
#!/bin/bash
#
# Get list of Frontends and Backends from HAPROXY
# Example: ./haproxy_discovery.sh [/var/lib/haproxy/stats] FRONTEND|BACKEND|SERVERS
# First argument is optional and should be used to set location of your HAPROXY socket
# Second argument is should be either FRONTEND, BACKEND or SERVERS, will default to FRONTEND if not set
#
# !! Make sure the user running this script has Read/Write permissions to that socket !!
#
## haproxy.cfg snippet
#  global
#  stats socket /var/lib/haproxy/stats  mode 666 level admin

HAPROXY_SOCK=""/var/run/haproxy/haproxy.sock
[ -n “$1” ] && echo $1 | grep -q ^/ && HAPROXY_SOCK="$(echo $1 | tr -d '\040\011\012\015')"

if [[ “$1” =~ (25[0-5]|2[0-4][0-9]|[01]?[0-9][0-9]?)\.(25[0-5]|2[0-4][0-9]|[01]?[0-9][0-9]?)\.(25[0-5]|2[0-4][0-9]|[01]?[0-9][0-9]?)\.(25[0-5]|2[0-4][0-9]|[01]?[0-9][0-9]?):[0-9]{1,5} ]];
then
    HAPROXY_STATS_IP="$1"
    QUERYING_METHOD="TCP"
fi

QUERYING_METHOD="${QUERYING_METHOD:-SOCKET}"

query_stats() {
    if [[ ${QUERYING_METHOD} == “SOCKET” ]]; then
        echo "show stat" | socat ${HAPROXY_SOCK} stdio 2>/dev/null
    elif [[ ${QUERYING_METHOD} == “TCP” ]]; then
        echo "show stat" | nc ${HAPROXY_STATS_IP//:/ } 2>/dev/null
    fi
}

get_stats() {
        echo "$(query_stats)" | grep -v "^#"
}

[ -n “$2” ] && shift 1
case $1 in
        B*) END="BACKEND" ;;
        F*) END="FRONTEND" ;;
        S*)
                for backend in $(get_stats | grep BACKEND | cut -d, -f1 | uniq); do
                        for server in $(get_stats | grep "^${backend}," | grep -v BACKEND | grep -v FRONTEND | cut -d, -f2); do
                                serverlist="$serverlist,\n"'\t\t{\n\t\t\t"{#BACKEND_NAME}":"'$backend'",\n\t\t\t"{#SERVER_NAME}":"'$server'"}'
                        done
                done
                echo -e '{\n\t"data":[\n’${serverlist#,}’]}'
                exit 0
        ;;
        *) END="FRONTEND" ;;
esac

for frontend in $(get_stats | grep "$END" | cut -d, -f1 | uniq); do
    felist="$felist,\n"'\t\t{\n\t\t\t"{#'${END}'_NAME}":"'$frontend'"}'
done
echo -e '{\n\t"data":[\n’${felist#,}’]}'


[root@haproxy-server1 scripts]# vim haproxy_stats.sh 
#!/bin/bash
set -o pipefail

if [[ “$1” = /* ]]
then
  HAPROXY_SOCKET="$1"
  shift 0
else
  if [[ “$1” =~ (25[0-5]|2[0-4][0-9]|[01]?[0-9][0-9]?)\.(25[0-5]|2[0-4][0-9]|[01]?[0-9][0-9]?)\.(25[0-5]|2[0-4][0-9]|[01]?[0-9][0-9]?)\.(25[0-5]|2[0-4][0-9]|[01]?[0-9][0-9]?):[0-9]{1,5} ]];
  then
    HAPROXY_STATS_IP="$1"
    QUERYING_METHOD="TCP"
    shift 1
  fi
fi

pxname="$1"
svname="$2"
stat="$3"

DEBUG=${DEBUG:-0}
HAPROXY_SOCKET="${HAPROXY_SOCKET:-/var/run/haproxy/haproxy.sock}"
QUERYING_METHOD="${QUERYING_METHOD:-SOCKET}"
CACHE_STATS_FILEPATH="${CACHE_STATS_FILEPATH:-/var/tmp/haproxy_stats.cache}"
CACHE_STATS_EXPIRATION="${CACHE_STATS_EXPIRATION:-1}" # in minutes
CACHE_INFO_FILEPATH="${CACHE_INFO_FILEPATH:-/var/tmp/haproxy_info.cache}" ## unused
CACHE_INFO_EXPIRATION="${CACHE_INFO_EXPIRATION:-1}" # in minutes ## unused
GET_STATS=${GET_STATS:-1} # when you update stats cache outsise of the script
SOCAT_BIN="$(which socat)"
NC_BIN="$(which nc)"
FLOCK_BIN="$(which flock)"
FLOCK_WAIT=15 # maximum number of seconds that "flock" waits for acquiring a lock
FLOCK_SUFFIX='.lock'
CUR_TIMESTAMP="$(date '+%s')"

debug() {
  [ “${DEBUG}” -eq 1 ] && echo "DEBUG: $@" >&2 || true
}

debug "SOCAT_BIN        => $SOCAT_BIN"
debug "NC_BIN           => $NC_BIN"
debug "FLOCK_BIN        => $FLOCK_BIN"
debug "FLOCK_WAIT       => $FLOCK_WAIT seconds"
debug "CACHE_FILEPATH   => $CACHE_FILEPATH"
debug "CACHE_EXPIRATION => $CACHE_EXPIRATION minutes"
debug "HAPROXY_SOCKET   => $HAPROXY_SOCKET"
debug "pxname   => $pxname"
debug "svname   => $svname"
debug "stat     => $stat"

# check if socat is available in path
if [ “$GET_STATS” -eq 1 ] && [[ $QUERYING_METHOD == “SOCKET” && -z “$SOCAT_BIN” ]] || [[ $QUERYING_METHOD == “TCP” &&  -z “$NC_BIN” ]]
then
  echo 'ERROR: cannot find socat binary'
  exit 126
fi

# if we are getting stats:
#   check if we can write to stats cache file, if it exists
#     or cache file path, if it does not exist
#   check if HAPROXY socket is writable
# if we are NOT getting stats:
#   check if we can read the stats cache file
if [ “$GET_STATS” -eq 1 ]
then
  if [ -e “$CACHE_FILEPATH” ] && [ ! -w “$CACHE_FILEPATH” ]
  then
    echo 'ERROR: stats cache file exists, but is not writable'
    exit 126
  elif [ ! -w ${CACHE_FILEPATH%/*} ]
  then
    echo 'ERROR: stats cache file path is not writable'
    exit 126
  fi
  if [[ $QUERYING_METHOD == “SOCKET” && ! -w $HAPROXY_SOCKET ]]
  then
    echo "ERROR: haproxy socket is not writable"
    exit 126
  fi
elif [ ! -r “$CACHE_FILEPATH” ]
then
  echo 'ERROR: cannot read stats cache file'
  exit 126
fi

# index:name:default
MAP="
1:pxname:@
2:svname:@
3:qcur:9999999999
4:qmax:0
5:scur:9999999999
6:smax:0
7:slim:0
8:stot:@
9:bin:9999999999
10:bout:9999999999
11:dreq:9999999999
12:dresp:9999999999
13:ereq:9999999999
14:econ:9999999999
15:eresp:9999999999
16:wretr:9999999999
17:wredis:9999999999
18:status:UNK
19:weight:9999999999
20:act:9999999999
21:bck:9999999999
22:chkfail:9999999999
23:chkdown:9999999999
24:lastchg:9999999999
25:downtime:0
26:qlimit:0
27:pid:@
28:iid:@
29:sid:@
30:throttle:9999999999
31:lbtot:9999999999
32:tracked:9999999999
33:type:9999999999
34:rate:9999999999
35:rate_lim:@
36:rate_max:@
37:check_status:@
38:check_code:@
39:check_duration:9999999999
40:hrsp_1xx:@
41:hrsp_2xx:@
42:hrsp_3xx:@
43:hrsp_4xx:@
44:hrsp_5xx:@
45:hrsp_other:@
46:hanafail:@
47:req_rate:9999999999
48:req_rate_max:@
49:req_tot:9999999999
50:cli_abrt:9999999999
51:srv_abrt:9999999999
52:comp_in:0
53:comp_out:0
54:comp_byp:0
55:comp_rsp:0
56:lastsess:9999999999
57:last_chk:@
58:last_agt:@
59:qtime:0
60:ctime:0
61:rtime:0
62:ttime:0
"

_STAT=$(echo -e "$MAP" | grep :${stat}:)
_INDEX=${_STAT%%:*}
_DEFAULT=${_STAT##*:}

debug "_STAT    => $_STAT"
debug "_INDEX   => $_INDEX"
debug "_DEFAULT => $_DEFAULT"

# check if requested stat is supported
if [ -z “${_STAT}” ]
then
  echo "ERROR: $stat is unsupported"
  exit 127
fi

# method to retrieve data from haproxy stats
# usage:
# query_stats "show stat"
query_stats() {
    if [[ ${QUERYING_METHOD} == “SOCKET” ]]; then
        echo $1 | socat ${HAPROXY_SOCKET} stdio 2>/dev/null
    elif [[ ${QUERYING_METHOD} == “TCP” ]]; then
        echo $1 | nc ${HAPROXY_STATS_IP//:/ } 2>/dev/null
    fi
}

# a generic cache management function, that relies on 'flock'
check_cache() {
  local cache_type="${1}"
  local cache_filepath="${2}"
  local cache_expiration="${3}"  
  local cache_filemtime
  cache_filemtime=$(stat -c '%Y' "${cache_filepath}" 2> /dev/null)
  if [ $((cache_filemtime+60*cache_expiration)) -ge ${CUR_TIMESTAMP} ]
  then
    debug "${cache_type} file found, results are at most ${cache_expiration} minutes stale.."
  elif "${FLOCK_BIN}" –exclusive –wait "${FLOCK_WAIT}" 200
  then
    cache_filemtime=$(stat -c '%Y' "${cache_filepath}" 2> /dev/null)
    if [ $((cache_filemtime+60*cache_expiration)) -ge ${CUR_TIMESTAMP} ]
    then
      debug "${cache_type} file found, results have just been updated by another process.."
    else
      debug "no ${cache_type} file found, querying haproxy"
      query_stats "show ${cache_type}" > "${cache_filepath}"
    fi
  fi 200> "${cache_filepath}${FLOCK_SUFFIX}"
}

# generate stats cache file if needed
get_stats() {
  check_cache 'stat' "${CACHE_STATS_FILEPATH}" ${CACHE_STATS_EXPIRATION}
}

# generate info cache file
## unused at the moment
get_info() {
  check_cache 'info' "${CACHE_INFO_FILEPATH}" ${CACHE_INFO_EXPIRATION}
}

# get requested stat from cache file using INDEX offset defined in MAP
# return default value if stat is ""
get() {
  # $1: pxname/svname
  local _res="$("${FLOCK_BIN}" –shared –wait "${FLOCK_WAIT}" "${CACHE_STATS_FILEPATH}${FLOCK_SUFFIX}" grep $1 "${CACHE_STATS_FILEPATH}")"
  if [ -z “${_res}” ]
  then
    echo "ERROR: bad $pxname/$svname"
    exit 127
  fi
  _res="$(echo $_res | cut -d, -f ${_INDEX})"
  if [ -z “${_res}” ] && [[ “${_DEFAULT}” != “@” ]]
  then
    echo "${_DEFAULT}"  
  else
    echo "${_res}"
  fi
}

# not sure why we'd need to split on backslash
# left commented out as an example to override default get() method
# status() {
#   get "^${pxname},${svnamem}," $stat | cut -d\  -f1
# }

# this allows for overriding default method of getting stats
# name a function by stat name for additional processing, custom returns, etc.
if type get_${stat} >/dev/null 2>&1
then
  debug "found custom query function"
  get_stats && get_${stat}
else
  debug "using default get() method"
  get_stats && get "^${pxname},${svname}," ${stat}
fi


! NB ! Substitute in the script /var/run/haproxy/haproxy.sock with your haproxy socket location

You can download the haproxy_stats.sh here and haproxy_discovery.sh here

2. Create the userparameter_haproxy_backend.conf

[root@haproxy-server1 zabbix_agentd.d]# cat userparameter_haproxy_backend.conf 
#
# Discovery Rule
#

# HAProxy Frontend, Backend and Server Discovery rules
UserParameter=haproxy.list.discovery[*],sudo /etc/zabbix/scripts/haproxy_discovery.sh SERVER
UserParameter=haproxy.stats[*],sudo /etc/zabbix/scripts/haproxy_stats.sh  $2 $3 $4

# support legacy way

UserParameter=haproxy.stat.downtime[*],sudo /etc/zabbix/scripts/haproxy_stats.sh  $2 $3 downtime

UserParameter=haproxy.stat.status[*],sudo /etc/zabbix/scripts/haproxy_stats.sh  $2 $3 status

UserParameter=haproxy.stat.last_chk[*],sudo /etc/zabbix/scripts/haproxy_stats.sh  $2 $3 last_chk


3. Create new simple template for the Application backend Monitoring and link it to monitored host

create-configuration-template-backend-monitoring

create-template-backend-monitoring-macros


Go to Configuration -> Hosts (find the host) and Link the template to it


4. Restart Zabbix-agent, in while check autodiscovery data is in Zabbix Server

[root@haproxy-server1 ]# systemctl restart zabbix-agent


Check in zabbix the userparameter data arrives, it should not be required to add any Items or Triggers as autodiscovery zabbix feature should automatically create in the server what is required for the data regarding backends to be in.

To view data arrives go to Zabbix config menus:

Configuration -> Hosts -> Hosts: (lookup for the haproxy-server1 hostname)

zabbix-discovery_rules-screenshot

The autodiscovery should have automatically created the following prototypes

zabbix-items-monitoring-prototypes
Now if you look inside Latest Data for the Host you should find some information like:

HAProxy Backend [backend1] (3 Items)
        
HAProxy Server [backend-name_APP/server1]: Connection Response
2022-05-13 14:15:04            History
        
HAProxy Server [backend-name/server2]: Downtime (hh:mm:ss)
2022-05-13 14:13:57    20:30:42        History
        
HAProxy Server [bk_name-APP/server1]: Status
2022-05-13 14:14:25    Up (1)        Graph
        ccnrlb01    HAProxy Backend [bk_CCNR_QA_ZVT] (3 Items)
        
HAProxy Server [bk_name-APP3/server1]: Connection Response
2022-05-13 14:15:05            History
        
HAProxy Server [bk_name-APP3/server1]: Downtime (hh:mm:ss)
2022-05-13 14:14:00    20:55:20        History
        
HAProxy Server [bk_name-APP3/server2]: Status
2022-05-13 14:15:08    Up (1)

To make alerting in case if a backend is down which usually you would like only left thing is to configure an Action to deliver alerts to some email address.

Webserver farm behind Load Balancer Proxy or how to preserve incoming internet IP to local net IP Apache webservers by adding additional haproxy header with remoteip

Monday, April 18th, 2022

logo-haproxy-apache-remoteip-configure-and-check-to-have-logged-real-ip-address-inside-apache-forwarded-from-load-balancer

Having a Proxy server for Load Balancing is a common solutions to assure High Availability of Web Application service behind a proxy.
You can have for example 1 Apache HTTPD webservers serving traffic Actively on one Location (i.e. one city or Country) and 3 configured in the F5 LB or haproxy to silently keep up and wait for incoming connections as an (Active Failure) Backup solution

Lets say the Webservers usually are set to have local class C IPs as 192.168.0.XXX or 10.10.10.XXX and living in isolated DMZed well firewalled LAN network and Haproxy is configured to receive traffic via a Internet IP 109.104.212.13 address and send the traffic in mode tcp via a NATTed connection (e.g. due to the network address translation the source IP of the incoming connections from Intenet clients appears as the NATTed IP 192.168.1.50.

The result is that all incoming connections from haproxy -> webservers will be logged in Webservers /var/log/apache2/access.log wrongly as incoming from source IP: 192.168.1.50, meaning all the information on the source Internet Real IP gets lost.

load-balancer-high-availailibility-haproxy-apache
 

How to pass Real (Internet) Source IPs from Haproxy "mode tcp" to Local LAN Webservers  ?
 

Usually the normal way to work around this with Apache Reverse Proxies configured is to use HTTP_X_FORWARDED_FOR variable in haproxy when using HTTP traffic application that is proxied (.e.g haproxy.cfg has mode http configured), you have to add to listen listener_name directive or frontend Frontend_of_proxy

option forwardfor
option http-server-close

However unfortunately, IP Header preservation with X_FORWADED_FOR  HTTP-Header is not possible when haproxy is configured to forward traffic using mode tcp.

Thus when you're forced to use mode tcp to completely pass any traffic incoming to Haproxy from itself to End side, the solution is to
 

  • Use mod_remoteip infamous module that is part of standard Apache installs both on apache2 installed from (.deb) package  or httpd rpm (on redhats / centos).


1. Configure Haproxies to send received connects as send-proxy traffic


The idea is very simple all the received requests from outside clients to Haproxy are to be send via the haproxy to the webserver in a PROXY protocol string, this is done via send-proxy

             send-proxy  – send a PROXY protocol string

Rawly my current /etc/haproxy/haproxy.cfg looks like this:
 

global
        log /dev/log    local0
        log /dev/log    local1 notice
        chroot /var/lib/haproxy
        user haproxy
        group haproxy
        daemon
        maxconn 99999
        nbproc          1
        nbthread 2
        cpu-map         1 0
        cpu-map         2 1


defaults
        log     global
       mode    tcp


        timeout connect 5000
        timeout connect 30s
        timeout server 10s

    timeout queue 5s
    timeout tunnel 2m
    timeout client-fin 1s
    timeout server-fin 1s

                option forwardfor

    retries                 15


frontend http-in
                mode tcp

                option tcplog
        log global

                option logasap
                option forwardfor
                bind 109.104.212.130:80
    fullconn 20000
default_backend http-websrv
backend http-websrv
        balance source
                maxconn 3000

stick match src
    stick-table type ip size 200k expire 30m
        stick on src


        server ha1server-1 192.168.0.205:80 check send-proxy weight 254 backup
        server ha1server-2 192.168.1.15:80 check send-proxy weight 255
        server ha1server-3 192.168.2.30:80 check send-proxy weight 252 backup
        server ha1server-4 192.168.1.198:80 check send-proxy weight 253 backup
                server ha1server-5 192.168.0.1:80 maxconn 3000 check send-proxy weight 251 backup


frontend https-in
                mode tcp

                option tcplog
                log global

                option logasap
                option forwardfor
        maxconn 99999
           bind 109.104.212.130:443
        default_backend https-websrv
                backend https-websrv
        balance source
                maxconn 3000
        stick on src
    stick-table type ip size 200k expire 30m


                server ha1server-1 192.168.0.205:443 maxconn 8000 check send-proxy weight 254 backup
                server ha1server-2 192.168.1.15:443 maxconn 10000 check send-proxy weight 255
        server ha1server-3 192.168.2.30:443 maxconn 8000 check send-proxy weight 252 backup
        server ha1server-4 192.168.1.198:443 maxconn 10000 check send-proxy weight 253 backup
                server ha1server-5 192.168.0.1:443 maxconn 3000 check send-proxy weight 251 backup

listen stats
    mode http
    option httplog
    option http-server-close
    maxconn 10
    stats enable
    stats show-legends
    stats refresh 5s
    stats realm Haproxy\ Statistics
    stats admin if TRUE


After preparing your haproxy.cfg and reloading haproxy in /var/log/haproxy.log you should have the Real Source IPs logged in:
 

root@webserver:~# tail -n 10 /var/log/haproxy.log
Apr 15 22:47:34 pcfr_hware_local_ip haproxy[2914]: 159.223.65.16:58735 [15/Apr/2022:22:47:34.586] https-in https-websrv/ha1server-2 1/0/+0 +0 — 7/7/7/7/0 0/0
Apr 15 22:47:34 pcfr_hware_local_ip haproxy[2914]: 20.113.133.8:56405 [15/Apr/2022:22:47:34.744] https-in https-websrv/ha1server-2 1/0/+0 +0 — 7/7/7/7/0 0/0
Apr 15 22:47:35 pcfr_hware_local_ip haproxy[2914]: 54.36.148.248:15653 [15/Apr/2022:22:47:35.057] https-in https-websrv/ha1server-2 1/0/+0 +0 — 7/7/7/7/0 0/0
Apr 15 22:47:35 pcfr_hware_local_ip haproxy[2914]: 185.191.171.35:26564 [15/Apr/2022:22:47:35.071] https-in https-websrv/ha1server-2 1/0/+0 +0 — 8/8/8/8/0 0/0
Apr 15 22:47:35 pcfr_hware_local_ip haproxy[2914]: 213.183.53.58:42984 [15/Apr/2022:22:47:35.669] https-in https-websrv/ha1server-2 1/0/+0 +0 — 6/6/6/6/0 0/0
Apr 15 22:47:35 pcfr_hware_local_ip haproxy[2914]: 159.223.65.16:54006 [15/Apr/2022:22:47:35.703] https-in https-websrv/ha1server-2 1/0/+0 +0 — 7/7/7/7/0 0/0
Apr 15 22:47:36 pcfr_hware_local_ip haproxy[2914]: 192.241.113.203:30877 [15/Apr/2022:22:47:36.651] https-in https-websrv/ha1server-2 1/0/+0 +0 — 4/4/4/4/0 0/0
Apr 15 22:47:36 pcfr_hware_local_ip haproxy[2914]: 185.191.171.9:6776 [15/Apr/2022:22:47:36.683] https-in https-websrv/ha1server-2 1/0/+0 +0 — 5/5/5/5/0 0/0
Apr 15 22:47:36 pcfr_hware_local_ip haproxy[2914]: 159.223.65.16:64310 [15/Apr/2022:22:47:36.797] https-in https-websrv/ha1server-2 1/0/+0 +0 — 6/6/6/6/0 0/0
Apr 15 22:47:36 pcfr_hware_local_ip haproxy[2914]: 185.191.171.3:23364 [15/Apr/2022:22:47:36.834] https-in https-websrv/ha1server-2 1/1/+1 +0 — 7/7/7/7/0 0/0


2. Enable remoteip proxy protocol on Webservers

Login to each Apache HTTPD and to enable remoteip module run:
 

# a2enmod remoteip


On Debians, the command should produce a right symlink to mods-enabled/ directory
 

# ls -al /etc/apache2/mods-enabled/*remote*
lrwxrwxrwx 1 root root 31 Mar 30  2021 /etc/apache2/mods-enabled/remoteip.load -> ../mods-available/remoteip.load


3. Modify remoteip.conf file and allow IPs of haproxies or F5s


Configure RemoteIPTrustedProxy for every Source IP of haproxy to allow it to send X-Forwarded-For header to Apache,

Here are few examples, from my apache working config on Debian 11.2 (Bullseye):
 

webserver:~# cat remoteip.conf
RemoteIPHeader X-Forwarded-For
RemoteIPTrustedProxy 192.168.0.1
RemoteIPTrustedProxy 192.168.0.205
RemoteIPTrustedProxy 192.168.1.15
RemoteIPTrustedProxy 192.168.0.198
RemoteIPTrustedProxy 192.168.2.33
RemoteIPTrustedProxy 192.168.2.30
RemoteIPTrustedProxy 192.168.0.215
#RemoteIPTrustedProxy 51.89.232.41

On RedHat / Fedora other RPM based Linux distrubutions, you can do the same by including inside httpd.conf or virtualhost configuration something like:
 

<IfModule remoteip_module>
      RemoteIPHeader X-Forwarded-For
      RemoteIPInternalProxy 192.168.0.0/16
      RemoteIPTrustedProxy 192.168.0.215/32
</IfModule>


4. Enable RemoteIP Proxy Protocol in apache2.conf / httpd.conf or Virtualhost custom config
 

Modify both haproxy / haproxies config as well as enable the RemoteIP module on Apache webservers (VirtualHosts if such used) and either in <VirtualHost> block or in main http config include:

RemoteIPProxyProtocol On


5. Change default configured Apache LogFormat

In Domain Vhost or apache2.conf / httpd.conf

Default logging Format will be something like:
 

LogFormat "%h %l %u %t \"%r\" %>s %O \"%{Referer}i\" \"%{User-Agent}i\"" combined


or
 

LogFormat "%v:%p %h %l %u %t \"%r\" %>s %O \"%{Referer}i\" \"%{User-Agent}i\"" combined


Once you find it in /etc/apache2/apache2.conf / httpd.conf or Vhost, you have to comment out this by adding shebang infont of sentence make it look as follows:
 

LogFormat "%v:%p %a %l %u %t \"%r\" %>s %O \"%{Referer}i\" \"%{User-Agent}i\"" vhost_combined
LogFormat "%a %l %u %t \"%r\" %>s %O \"%{Referer}i\" \"%{User-Agent}i\"" combined
LogFormat "%a %l %u %t \"%r\" %>s %O" common
LogFormat "%{Referer}i -> %U" referer
LogFormat "%{User-agent}i" agent


The Changed LogFormat instructs Apache to log the client IP as recorded by mod_remoteip (%a) rather than hostname (%h). For a full explanation of all the options check the official HTTP Server documentation page apache_mod_config on Custom Log Formats.

and reload each Apache server.

on Debian:

# apache2ctl -k reload

On CentOS

# systemctl restart httpd


6. Check proxy protocol is properly enabled on Apaches


remoteip module will enable Apache to expect a proxy connect header passed to it otherwise it will respond with Bad Request, because it will detect a plain HTML request instead of Proxy Protocol CONNECT, here is the usual telnet test to fetch the index.htm page.

root@webserver:~# telnet localhost 80
Trying 127.0.0.1…
Connected to localhost.
Escape character is '^]'.
GET / HTTP/1.1

HTTP/1.1 400 Bad Request
Date: Fri, 15 Apr 2022 19:04:51 GMT
Server: Apache/2.4.51 (Debian)
Content-Length: 312
Connection: close
Content-Type: text/html; charset=iso-8859-1

<!DOCTYPE HTML PUBLIC "-//IETF//DTD HTML 2.0//EN">
<html><head>
<title>400 Bad Request</title>
</head><body>
<h1>Bad Request</h1>
<p>Your browser sent a request that this server could not understand.<br />
</p>
<hr>
<address>Apache/2.4.51 (Debian) Server at grafana.pc-freak.net Port 80</address>
</body></html>
Connection closed by foreign host.


root@webserver:~# telnet localhost 80
Trying 127.0.0.1…
Connected to localhost.
Escape character is '^]'.
HEAD / HTTP/1.1

HTTP/1.1 400 Bad Request
Date: Fri, 15 Apr 2022 19:05:07 GMT
Server: Apache/2.4.51 (Debian)
Connection: close
Content-Type: text/html; charset=iso-8859-1

Connection closed by foreign host.


To test it with telnet you can follow the Proxy CONNECT syntax and simulate you're connecting from a proxy server, like that:
 

root@webserver:~# telnet localhost 80
Trying 127.0.0.1…
Connected to localhost.
Escape character is '^]'.
CONNECT localhost:80 HTTP/1.0

HTTP/1.1 301 Moved Permanently
Date: Fri, 15 Apr 2022 19:13:38 GMT
Server: Apache/2.4.51 (Debian)
Location: https://zabbix.pc-freak.net
Cache-Control: max-age=900
Expires: Fri, 15 Apr 2022 19:28:38 GMT
Content-Length: 310
Connection: close
Content-Type: text/html; charset=iso-8859-1

<!DOCTYPE HTML PUBLIC "-//IETF//DTD HTML 2.0//EN">
<html><head>
<title>301 Moved Permanently</title>
</head><body>
<h1>Moved Permanently</h1>
<p>The document has moved <a href="https://zabbix.pc-freak.net">here</a>.</p>
<hr>
<address>Apache/2.4.51 (Debian) Server at localhost Port 80</address>
</body></html>
Connection closed by foreign host.

You can test with curl simulating the proxy protocol CONNECT with:

root@webserver:~# curl –insecure –haproxy-protocol https://192.168.2.30

<!DOCTYPE HTML PUBLIC "-//W3C//DTD HTML 4.01 Transitional//EN"
"http://w3.org/TR/html4/loose.dtd">
<html>
<head>
<meta name="generator" content="pc-freak.net tidy">
<script src="https://ssl.google-analytics.com/urchin.js" type="text/javascript">
</script>
<script type="text/javascript">
_uacct = "UA-2102595-3";
urchinTracker();
</script>
<script type="text/javascript">
var gaJsHost = (("https:" == document.location.protocol) ? "https://ssl." : "http://");
document.write(unescape("%3Cscript src='" + gaJsHost + "google-analytics.com/ga.js' type='text/javascript'%3E%3C/script%3E"));
</script>
<script type="text/javascript">
try {
var pageTracker = _gat._getTracker("UA-2102595-6");
pageTracker._trackPageview();
} catch(err) {}
</script>


      –haproxy-protocol
              (HTTP) Send a HAProxy PROXY protocol v1 header at the beginning of the connection. This is used by some load balancers and reverse proxies
              to indicate the client's true IP address and port.

              This option is primarily useful when sending test requests to a service that expects this header.

              Added in 7.60.0.


7. Check apache log if remote Real Internet Source IPs are properly logged
 

root@webserver:~# tail -n 10 /var/log/apache2/access.log

213.183.53.58 – – [15/Apr/2022:22:18:59 +0300] "GET /proxy/browse.php?u=https%3A%2F%2Fsteamcommunity.com%2Fmarket%2Fitemordershistogram%3Fcountry HTTP/1.1" 200 12701 "https://www.pc-freak.net" "Mozilla/5.0 (Windows NT 10.0; Win64; x64; rv:98.0) Gecko/20100101 Firefox/98.0"
88.198.48.184 – – [15/Apr/2022:22:18:58 +0300] "GET /blog/iq-world-rank-country-smartest-nations/?cid=1330192 HTTP/1.1" 200 29574 "-" "Mozilla/5.0 (compatible; DataForSeoBot/1.0; +https://dataforseo.com/dataforseo-bot)"
213.183.53.58 – – [15/Apr/2022:22:19:00 +0300] "GET /proxy/browse.php?u=https%3A%2F%2Fsteamcommunity.com%2Fmarket%2Fitemordershistogram%3Fcountry
HTTP/1.1" 200 9080 "https://www.pc-freak.net" "Mozilla/5.0 (Windows NT 10.0; Win64; x64; rv:98.0) Gecko/20100101 Firefox/98.0"
159.223.65.16 – – [15/Apr/2022:22:19:01 +0300] "POST //blog//xmlrpc.php HTTP/1.1" 200 5477 "-" "Mozilla/5.0 (Windows NT 10.0; Win64; x64) AppleWebKit/537.36 (KHTML, like Gecko) Chrome/89.0.4389.114 Safari/537.36"
159.223.65.16 – – [15/Apr/2022:22:19:02 +0300] "POST //blog//xmlrpc.php HTTP/1.1" 200 5477 "-" "Mozilla/5.0 (Windows NT 10.0; Win64; x64) AppleWebKit/537.36 (KHTML, like Gecko) Chrome/89.0.4389.114 Safari/537.36"
213.91.190.233 – – [15/Apr/2022:22:19:02 +0300] "POST /blog/wp-admin/admin-ajax.php HTTP/1.1" 200 1243 "https://www.pc-freak.net/blog/wp-admin/post.php?post=16754&action=edit" "Mozilla/5.0 (Windows NT 6.1; Win64; x64; rv:89.0) Gecko/20100101 Firefox/89.0"
46.10.215.119 – – [15/Apr/2022:22:19:02 +0300] "GET /images/saint-Paul-and-Peter-holy-icon.jpg HTTP/1.1" 200 134501 "https://www.google.com/" "Mozilla/5.0 (Windows NT 10.0; Win64; x64) AppleWebKit/537.36 (KHTML, like Gecko) Chrome/100.0.4896.75 Safari/537.36 Edg/100.0.1185.39"
185.191.171.42 – – [15/Apr/2022:22:19:03 +0300] "GET /index.html.latest/tutorials/tutorials/penguins/vestnik/penguins/faith/vestnik/ HTTP/1.1" 200 11684 "-" "Mozilla/5.0 (compatible; SemrushBot/7~bl; +http://www.semrush.com/bot.html)"

116.179.37.243 – – [15/Apr/2022:22:19:50 +0300] "GET /blog/wp-content/cookieconsent.min.js HTTP/1.1" 200 7625 "https://www.pc-freak.net/blog/how-to-disable-nginx-static-requests-access-log-logging/" "Mozilla/5.0 (compatible; Baiduspider-render/2.0; +http://www.baidu.com/search/spider.html)"
116.179.37.237 – – [15/Apr/2022:22:19:50 +0300] "GET /blog/wp-content/plugins/google-analytics-dashboard-for-wp/assets/js/frontend-gtag.min.js?ver=7.5.0 HTTP/1.1" 200 8898 "https://www.pc-freak.net/blog/how-to-disable-nginx-static-requests-access-log-logging/" "Mozilla/5.0 (compatible; Baiduspider-render/2.0; +http://www.baidu.com/search/spider.html)"


You see from above output remote Source IPs in green are properly logged, so haproxy Cluster is correctly forwarding connections passing on in the Haproxy generated Initial header the Real IP of its remote connect IPs.


Sum it up, What was done?


HTTP_X_FORWARD_FOR is impossible to set, when haproxy is used on mode tcp and all traffic is sent as received from TCP IPv4 / IPv6 Network stack, e.g. modifying any HTTP sent traffic inside the headers is not possible as this might break up the data.

Thus Haproxy was configured to send all its received data by sending initial proxy header with the X_FORWARDED usual Source IP data, then remoteip Apache module was used to make Apache receive and understand haproxy sent Header which contains the original Source IP via the send-proxy functionality and example was given on how to test the remoteip on Webserver is working correctly.

Finally you've seen how to check configured haproxy and webserver are able to send and receive the End Client data with the originator real source IP correctly and those Internet IP is properly logged inside both haproxy and apaches.

How to remove GNOME environment and Xorg server on CentOS 7 / 8 / 9 Linux

Wednesday, April 13th, 2022

centos-linux-remove-gnome-gui-remove-howto-logo

If you have installed recent version of CentOS, you have noticed by default the Installator did setup Xserver and GNOME as Graphical Environment as well the surrounding GUI Administration tools. That's really not needed on "headless" monitorless Linux servers as this wastes up for nothing a very tiny amount of the machine CPU and RAM and Disk resource on keeping services up and running. Even worse a Graphical Environment on a Production server poses a security breach as their are much more services running on the OS that could be potentially hacked.

Removal of GUI across CentOS is similar but slightly differs. Hence in this article, I'll show how it can be removed on CentOS Linux 7 / 8 and 9. Removal of Graphics is usual operation for sysadmins thus there is plenty of info on the net,how this is done on CentOS 7 and COS 8 but unfortunately as of time of writting this article, couldn't find anything on the net on how to Remove GUI environment on CentOS 9.

The reason for this article is mostly for documentation purposes for myself

First list the available meta-package groups installed on the OS:

1. List machine installed package groups


yum-groupinstall-gnome

[root@centos ~]# yum grouplist
Last metadata expiration check: 3:55:48 ago on Mon 11 Apr 2022 03:26:06 AM EDT.
Available Environment Groups:
   Server
   Minimal Install
   Workstation
   KDE Plasma Workspaces
   Custom Operating System
   Virtualization Host
Installed Environment Groups:
   Server with GUI
Installed Groups:
   Container Management
   Headless Management
Available Groups:
   Legacy UNIX Compatibility
   Console Internet Tools
   Development Tools
   .NET Development
   Graphical Administration Tools
   Network Servers
   RPM Development Tools
   Scientific Support
   Security Tools
   Smart Card Support
   System Tools
   Fedora Packager


On CentOS 8 and CentOS 9 to list the installed package groups, you can use also:

[root@centos ~]# dnf grouplist

Installed Environment Groups:
   Server with GUI

2. Remove GNOME and Xorg GUIs on CentOS 7

[root@centos ~]# yum groupremove "Server with GUI" –skip-broken

[root@centos ~]# yum groupremove "GNOME Desktop" -y

3. Remove GNOME and X on CentOS 8

[root@centos ~]# dnf groupremove 'X Window System' 'GNOME' -y

4. Remove Graphical Environment on CentOS 9


centos9-linux-groupremove-command-screenshot

[root@centos ~]# yum groupremove GNOME 'Graphical Administration Tools' -y


Removing Groups:
 GNOME

Transaction Summary
====================================================
Remove  123 Packages

Freed space: 416 M
Is this ok [y/N]: y
Is this ok [y/N]: y
Running transaction check
Transaction check succeeded.
Running transaction test
Transaction test succeeded.


  xorg-x11-drv-libinput-1.0.1-3.el9.x86_64
  xorg-x11-server-Xorg-1.20.11-10.el9.x86_64
  xorg-x11-server-Xwayland-21.1.3-2.el9.x86_64
  xorg-x11-server-common-1.20.11-10.el9.x86_64
  xorg-x11-server-utils-7.7-44.el9.x86_64
  xorg-x11-xauth-1:1.1-10.el9.x86_64
  xorg-x11-xinit-1.4.0-11.el9.x86_64

Complete!


Graphical Administration Tools – is a group of tools that 

Or alternatively you can do

[root@centos ~]# yum remove gnome* xorg* -y


5. Change the Graphical boot to text multiuser

[root@centos ~]# systemctl set-default multi-user.target


6. Install GNOME / X GUI on the CentOS 7 / 8 / 9

Sometimes GNOME Desktop environment and Xorg are missing on previously delpoyed installs but you need it back for some reason.For example it was earlier removed a year ago on the server as it was not needed, but the machine use type changes and now you need to have installed an Oracle Server / Oracle Client which usually depends on having at least a minimal working version of X environment ont the Linux.


To install back the GNOME and X back on the machine:

[root@centos ~]# yum groupistall "Server with GUI" –skip-broken

[root@centos9 network-scripts]# yum groupinstall "Server with GUI" –skip-broken
Last metadata expiration check: 0:09:26 ago on Mon 11 Apr 2022 07:43:11 AM EDT.
No match for group package "insights-client"
No match for group package "redhat-release"
No match for group package "redhat-release-eula"
Dependencies resolved.
===================================================
 Package                                       Arch       Version              Repository     Size
===================================================
Installing group/module packages:
 NetworkManager-wifi                           x86_64     1:1.37.2-1.el9       baseos         75 k
 cheese                                        x86_64     2:3.38.0-6.el9       appstream      96 k
 chrome-gnome-shell                            x86_64     10.1-14.el9          appstream      33 k
 eog                                           x86_64     40.3-2.el9           appstream     3.6 M
 evince                                        x86_64     40.4-4.el9           appstream     2.8 M
 evince-nautilus                               x86_64     40.4-4.el9           appstream      20 k
 gdm                                           x86_64     1:40.1-13.el9        appstream     894 k
 gnome-bluetooth                               x86_64     1:3.34.5-3.el9       appstream      44 k
 gnome-calculator                              x86_64     40.1-2.el9           appstream     1.4 M
 gnome-characters                              x86_64     40.0-3.el9           appstream     236 k
 gnome-classic-session                         noarch     40.6-1.el9           appstream      36 k
 gnome-color-manager                           x86_64     3.36.0-7.el9         appstream     1.1 M
 gnome-control-center                          x86_64     40.0-22.el9          appstream     5.7 M
 gnome-disk-utility                            x86_64     40.2-2.el9           appstream     1.1 M
 gnome-font-viewer                             x86_64     40.0-3.el9           appstream     233 k
 gnome-initial-setup                           x86_64     40.1-2.el9           appstream     1.1 M
 gnome-logs                                    x86_64     3.36.0-6.el9         appstream     416 k

Installing dependencies:
 cheese-libs                                   x86_64     2:3.38.0-6.el9       appstream     941 k
 clutter                                       x86_64     1.26.4-7.el9         appstream     1.1 M
 clutter-gst3                                  x86_64     3.0.27-7.el9         appstream      85 k
 clutter-gtk                                   x86_64     1.8.4-13.el9         appstream      47 k
 cogl                                          x86_64     1.22.8-5.el9         appstream     505 k
 colord-gtk                                    x86_64     0.2.0-7.el9          appstream      33 k
 dbus-daemon                                   x86_64     1:1.12.20-5.el9      appstream     202 k
 dbus-tools                                    x86_64     1:1.12.20-5.el9      baseos         52 k
 evince-previewer                              x86_64     40.4-4.el9           appstream      29 k

Installing weak dependencies:
 gnome-tour                                    x86_64     40.1-1.el9           appstream     722 k
 nm-connection-editor                          x86_64     1.26.0-1.el9         appstream     838 k
 p11-kit-server                                x86_64     0.24.1-2.el9         appstream     199 k
 pinentry-gnome3                               x86_64     1.1.1-8.el9          appstream      41 k
Installing Environment Groups:
 Server with GUI
Installing Groups:
 base-x
 Container Management
 core
 fonts
 GNOME
 guest-desktop-agents
 Hardware Monitoring Utilities
 hardware-support
 Headless Management
 Internet Browser
 multimedia
 networkmanager-submodules
 print-client
 Server product core
 standard

Transaction Summary
=======================================================
Install  114 Packages

Total download size: 96 M
Installed size: 429 M
Is this ok [y/N]: y

or yum groupinstall GNOME

[root@centos9 ~]# yum grouplist
Last metadata expiration check: 3:55:48 ago on Mon 11 Apr 2022 03:26:06 AM EDT.
Available Environment Groups:

Installed Environment Groups:
   Server with GUI

Next you should change the OS default run level to 5 to make CentOS automatically start the Xserver and gdm.

To see the list of available default Login targets do:


[root@centos ~]# find / -name "runlevel*.target"
/usr/lib/systemd/system/runlevel0.target
/usr/lib/systemd/system/runlevel1.target
/usr/lib/systemd/system/runlevel2.target
/usr/lib/systemd/system/runlevel3.target
/usr/lib/systemd/system/runlevel4.target
/usr/lib/systemd/system/runlevel5.target
/usr/lib/systemd/system/runlevel6.target

The meaning of each runlevel is as follows:

Run Level Target Units Description
0 runlevel0.target, poweroff.target Shut down and power off
1 runlevel1.target, rescue.target Set up a rescue shell
2,3,4 runlevel[234].target, multi- user.target Set up a nongraphical multi-user shell
5 runlevel5.target, graphical.target Set up a graphical multi-user shell
6 runlevel6.target, reboot.target Shut down and reboot the system


If this does not work you can try:

yum-groupinstall-gnome

[root@centos ~]#  yum -y groups install "GNOME Desktop"


7. To check the OS configured boot target
 

[root@centos ~]# systemctl get-default
multi-user.target


multi-user.target is a mode of operation that is text mode only with multiple logins supported on tty and remotely.

To change it to graphical

[root@centos ~]# systemctl set-default graphical.target


or simply link it yourself
 

[root@centos ~]# ln -sf /lib/systemd/system/runlevel5.target /etc/systemd/system/default.target

[root@centos ~]# reboot


If the X was not used so far ever, you will get a few graphial screens to accept the License Information and Finish the configuration,i .e.

1. Accept the license by clicking on the “LICENSE INFORMATION“.

2. Tick mark the “accept the license agreement” and click on “Done“.

3. Click on “FINISH CONFIGURATION” to complete the setup.
And voila GDM (Graphical Login) Greater should shine up.
 

You could also go the manual route by adding an .xinitrc file in your home directory (instead of making the graphical login screen the default, as done above with the sudo systemctl set-default graphical.target command). To do this, issue the command:

[root@centos ~]# echo "exec gnome-session" >> ~/.xinitrc


How to disable Windows pagefile.sys and hiberfil.sys to temporary or permamently save disk space if space is critically low

Monday, March 28th, 2022

howto-pagefile-hiberfil.sys-remove-reduce-increase-increase-size-windows-logo

Sometimes you have to work with Windows 7 / 8 / 10 PCs  etc. that has a very small partition C:\
drive or othertimes due to whatever the disk got filled up with time and has only few megabytes left
and this totally broke up the windows performance as Windows OS becomes terribly sluggish and even
simple things as opening Internet Browser (Chrome / Firefox / Opera ) or Windows Explorer stones the PC performance.

You might of course try to use something like Spacesniffer tool (a great tool to find lost data space on PC s short description on it is found in my previous article how to
delete temporary Internet Files and Folders to to speed up and free disk space
 ) or use CCleaner to clean up a bit the pc.
Sometimes this is not enough though or it is not possible to do at all the main
partition disk C:\ is anyhow too much low (only 30-50MB are available on HDD) or the Physical or Virtual Machine containing the OS is filled with important data
and you couldn't risk to remove anything including Internet Temporary files, browsing cookies … whatever.

Lets say you are the fate chosen guy as sysadmin to face this uneasy situation and have no easy
way to add disk space from another present free space partition or could not add a new SATA hard drive
SSD drive, what should you do?
 

The solution wipe off pagefile.sys and hiberfil.sys

Usually every Windows installation has a pagefile.sys and hiberfil.sys.

  • pagefile.sys – is the default file that is used as a swap file, immediately once the machine runs out of memory. For Unix / Linux users better understanding pagefile.sys is the equivallent of Linux's swap partition. Of course as the pagefile is in a file and not in separate partition the swapping in Windows is perhaps generally worse than in Linux.
  • hiberfil.sys – is used to store data from the machine on machine Hibernation (for those who use the feature)


Pagefile.sys which depending on the configured RAM memory on the OS could takes up up to 5 – 8 GB, there hanging around doing nothing but just occupying space. Thus a temporary workaround that could free you some space even though it will degrade performance and on servers and production machines this is not a good solution on just user machines, where you temporary need to free space any other important task you can free up space
by seriously reducing the preconfigured default size of pagefile.sys (which usually is 1.5 times the active memory on the OS – hence if you have 4GB you would have a 6Gigabytes of pagefile.sys).

Other possibility especially on laptop and movable devices running Win OS is to disable hiberfil.sys, read below how this is done.


The temporary solution here is to simply free space by either reducing the pagefile.sys or completely disabling it


1. Disable pagefile.sys on Windows XP, Windows 7 / 8 / 10 / 11


The GUI interface to disable pagefile across all NT based Windows OS-es is quite similar, the only difference is newer versions of Windows has slightly more options.


1.1 Disable pagefile on Windows XP


Quickest way is to find pagefile.sys settings from GUI menus

1. Computer (My Computer) – right click mouse
2. Properties (System Preperties will appear)
3. Advanced (tab) 
4. Settings
5. Advanced (tab)
6. Change button

windows-xp-pagefile-disable-screenshot

1.2 Disable pagefile on Windows 7


advanced-system-settings-control-panel-system-and-security-screenshot

windows-system-properties-screenshot-properties-advanced-change-Virtual-memory-pagefile-screenshot

system-properties-performance-options
 

Once applied you'll be required to reboot the PC

How-to-turn-off-Virtual-Memory-Paging_File-in-Windows-7-restart


1.3 Disable Increase / Decrease pagefile.sys on Windows 10 / Win 11
 

open-system-properties-advanced-win10

win10-performance-options-menu-screenshot

configure-virtual-memory-win-10-screenshot


1.4 Make Windows clear pagefile.sys on shutdown

On home PCs it might be useful thing to clear up ( nullify) pagefile.sys on shutdown, that could save you some disk space on every reboot, until file continuously grows to its configured Maximum.

Run

regedit

Modify registry key at location


HKEY_LOCAL_MACHINE\SYSTEM\CurrentControlSet\Control\Session Manager\Memory Management

windows-clean-up-pagefile-sys-file-on-shutdown-or-reboot-registry-editor-value-screenshot

You can apply the value also via a registry file you can get the Enable Clearpagefile at shutdown here .reg.
 

2. Manipulating pagefile.sys size and file delete from command line with wmic tool 

For scripting purposes you might want to use the wmic pagefile which can do increase / decrase or delete the file without GUI, that is very helpful if you have to admin a Windows Domain (Active Directory)
 

[hipo.WINDOWS-PC] ➤ wmic pagefile /?

PAGEFILE – Virtual memory file swapping management.

HINT: BNF for Alias usage.
(<alias> [WMIObject] | [] | [] ) [].

USAGE:

PAGEFILE ASSOC []
PAGEFILE CREATE <assign list>
PAGEFILE DELETE
PAGEFILE GET [] []
PAGEFILE LIST [] []


[hipo.WINDOWS-PC] ➤ wmic pagefile
AllocatedBaseSize  Caption          CurrentUsage  Description      InstallDate                Name             PeakUsage  Status  TempPageFile
4709               C:\pagefile.sys  499           C:\pagefile.sys  20200912061902.938000+180  C:\pagefile.sys  525                FALSE


[hipo.WINDOWS-PC] ➤ wmic pagefile list /format:list

AllocatedBaseSize=4709
CurrentUsage=499
Description=C:\pagefile.sys
InstallDate=20200912061902.938000+180
Name=C:\pagefile.sys
PeakUsage=525
Status=
TempPageFile=FALSE

wmic-pagefile-command-line-tool-for-windows-default-output-screenshot


  • To change the Initial Size or Maximum Size of Pagefile use:
     

➤ wmic pagefileset where name="C:\\pagefile.sys" set InitialSize=2048,MaximumSize=2048

  • To move the pagefile / change location of pagefile to less occupied disk drive partition (i.e. D:\ drive)


    Sometimes you might have multiple drives on the PC and some of them might be having multitudes of gigabytes while main drive C:\ could be fully occupied due to initial install bad drive organization, in that case a good work arount to save you space so you can work normally with the server is just to temporary or permanently move pagefile to another drive.

wmic pagefileset where name="D:\\pagefile.sys" set InitialSize=2048,MaximumSize=2048


!! CONSIDER !!! 

That if you have the option to move the pagefile.sys for best performance it is advicable to place the file inside another physical disk, preferrably a Solid State Drive one, SATA disks are too slow and reduced Input / Output disk operations will lead to degraded performance, if there is lack of memory (i.e. pagefile.sys is actively open read and wrote in).
 

  • To delete pagefile.sys 
     

➤ wmic pagefileset where name="C:\\pagefile.sys" delete


If for some reason you prefer to not use wmic but simple del command you can delete pagefile.sys also by:

Removing file default "Hidden" and "system" file attributes – set for security reasons as the file is a system file usually not touched by user. This will save you from "permission denied" errors:
 

➤ attrib -s -h %systemdrive%\pagefile.sys


Delete the file:
 

➤ del /a /q %systemdrive%\pagefile.sys


3. Disable hibernation on Windows 7 / 8 and Win 10 / 11

Disabling hibernation file hiberfil.sys can also free up some space, especially if the hibernation has been actively used before and the file is written with data. Of course, that is more common on notebooks.
Windows hibernation has significantly improved over time though i didn't have very pleasant experience in the past and I prefer to disable it just in case.
 

3.1 Disable Windows 7 / 8 / 10 / 11 hibernation from GUI 

Disable it through:

Control Panel -> All Control Panel Items -> Power Options -> Edit Plan Settings -> Change advanced power settings


 like shown in below screenshot:

Windqows-power-options-Advanced-settings-Allow-Hybrid-sleep-option-menu-screenshot


3.2 Disable Windows 7 / 8 / 10 / 11 hibernation from command line

Disable hibernation Is done in the same way through the powercfg.exe command, to disable it
if you're cut of disk space and you want to save space from it:

run as Administrator in Command Line Windows (cmd.exe)
 

powercfg.exe /hibernate off

If you later need to switch on hibernation
 

powercfg.exe /hibernate on


disable-hiberfile-windows-screenshot

3.3 Disable Windows hibernation on legacy Windows XP

On XP to disable hibernation open

1. Power Options Properties
2. Select Hibernate
3. Select Enable Hibernation to clear the checkbox and disable Hibernation mode. 
4. Select OK to apply the change.

Close the Power Options Properties box. 

enable-disable-hibernate-windows-xp-menu-screenshot

To sum it up

We have learned some basics on Windows swapping and hibernation and i've tried to give some insight on how thiese files if misconfigured could lead to degraded Win OS performance. In any case using SSD as of 2022 to store both files is a best practice for machines that has plenty of memory always try to completely disable / remove the files. It was shown how  to manage pagefile.sys and hiberfil.sys across Windows Operating Systems different versions both from GUI and via command line as well as how you can configure pagefile.sys to be cleared up on pc reboot.
 

How to filter dhcp traffic between two networks running separate DHCP servers to prevent IP assignment issues and MAC duplicate addresses

Tuesday, February 8th, 2022

how-to-filter-dhcp-traffic-2-networks-running-2-separate-dhcpd-servers-to-prevent-ip-assignment-conflicts-linux
Tracking the Problem of MAC duplicates on Linux routers
 

If you have two networks that see each other and they're not separated in VLANs but see each other sharing a common netmask lets say 255.255.254.0 or 255.255.252.0, it might happend that there are 2 dhcp servers for example (isc-dhcp-server running on 192.168.1.1 and dhcpd running on 192.168.0.1 can broadcast their services to both LANs 192.168.1.0.1/24 (netmask 255.255.255.0) and Local Net LAN 192.168.1.1/24. The result out of this is that some devices might pick up their IP address via DHCP from the wrong dhcp server.

Normally if you have a fully controlled little or middle class home or office network (10 – 15 electronic devices nodes) connecting to the LAN in a mixed moth some are connected via one of the Networks via connected Wifi to 192.168.1.0/22 others are LANned and using static IP adddresses and traffic is routed among two ISPs and each network can see the other network, there is always a possibility of things to go wrong. This is what happened to me so this is how this post was born.

The best practice from my experience so far is to define each and every computer / phone / laptop host joining the network and hence later easily monitor what is going on the network with something like iptraf-ng / nethogs  / iperf – described in prior  how to check internet spepeed from console and in check server internet connectivity speed with speedtest-cliiftop / nload or for more complex stuff wireshark or even a simple tcpdump. No matter the tools network monitoring is only part on solving network issues. A very must have thing in a controlled network infrastructure is defining every machine part of it to easily monitor later with the monitoring tools. Defining each and every host on the Hybrid computer networks makes administering the network much easier task and  tracking irregularities on time is much more likely. 

Since I have such a hybrid network here hosting a couple of XEN virtual machines with Linux, Windows 7 and Windows 10, together with Mac OS X laptops as well as MacBook Air notebooks, I have followed this route and tried to define each and every host based on its MAC address to pick it up from the correct DHCP1 server  192.168.1.1 (that is distributing IPs for Internet Provider 1 (ISP 1), that is mostly few computers attached UTP LAN cables via LiteWave LS105G Gigabit Switch as well from DHCP2 – used only to assigns IPs to servers and a a single Wi-Fi Access point configured to route incoming clients via 192.168.0.1 Linux NAT gateway server.

To filter out the unwanted IPs from the DHCPD not to propagate I've so far used a little trick to  Deny DHCP MAC Address for unwanted clients and not send IP offer for them.

To give you more understanding,  I have to clear it up I don't want to have automatic IP assignments from DHCP2 / LAN2 to DHCP1 / LAN1 because (i don't want machines on DHCP1 to end up with IP like 192.168.0.50 or DHCP2 (to have 192.168.1.80), as such a wrong IP delegation could potentially lead to MAC duplicates IP conflicts. MAC Duplicate IP wrong assignments for those older or who have been part of administrating large ISP network infrastructures  makes the network communication unstable for no apparent reason and nodes partially unreachable at times or full time …

However it seems in the 21-st century which is the century of strangeness / computer madness in the 2022, technology advanced so much that it has massively started to break up some good old well known sysadmin standards well documented in the RFCs I know of my youth, such as that every electronic equipment manufactured Vendor should have a Vendor Assigned Hardware MAC Address binded to it that will never change (after all that was the idea of MAC addresses wasn't it !). 
Many mobile devices nowadays however, in the developers attempts to make more sophisticated software and Increase Anonimity on the Net and Security, use a technique called  MAC Address randomization (mostly used by hackers / script kiddies of the early days of computers) for their Wi-Fi Net Adapter OS / driver controlled interfaces for the sake of increased security (the so called Private WiFi Addresses). If a sysadmin 10-15 years ago has seen that he might probably resign his profession and turn to farming or agriculture plant growing, but in the age of digitalization and "cloud computing", this break up of common developed network standards starts to become the 'new normal' standard.

I did not suspected there might be a MAC address oddities, since I spare very little time on administering the the network. This was so till recently when I accidently checked the arp table with:

Hypervisor:~# arp -an
192.168.1.99     5c:89:b5:f2:e8:d8      (Unknown)
192.168.1.99    00:15:3e:d3:8f:76       (Unknown)

..


and consequently did a network MAC Address ARP Scan with arp-scan (if you never used this little nifty hacker tool I warmly recommend it !!!)
If you don't have it installed it is available in debian based linuces from default repos to install

Hypervisor:~# apt-get install –yes arp-scan


It is also available on CentOS / Fedora / Redhat and other RPM distros via:

Hypervisor:~# yum install -y arp-scan


Hypervisor:~# arp-scan –interface=eth1 192.168.1.0/24

192.168.1.19    00:16:3e:0f:48:05       Xensource, Inc.
192.168.1.22    00:16:3e:04:11:1c       Xensource, Inc.
192.168.1.31    00:15:3e:bb:45:45       Xensource, Inc.
192.168.1.38    00:15:3e:59:96:8e       Xensource, Inc.
192.168.1.34    00:15:3e:d3:8f:77       Xensource, Inc.
192.168.1.60    8c:89:b5:f2:e8:d8       Micro-Star INT'L CO., LTD
192.168.1.99     5c:89:b5:f2:e8:d8      (Unknown)
192.168.1.99    00:15:3e:d3:8f:76       (Unknown)

192.168.x.91     02:a0:xx:xx:d6:64        (Unknown)
192.168.x.91     02:a0:xx:xx:d6:64        (Unknown)  (DUP: 2)

N.B. !. I found it helpful to check all available interfaces on my Linux NAT router host.

As you see the scan revealed, a whole bunch of MAC address mess duplicated MAC hanging around, destroying my network topology every now and then 
So far so good, the MAC duplicates and strangely hanging around MAC addresses issue, was solved relatively easily with enabling below set of systctl kernel variables.
 

1. Fixing Linux ARP common well known Problems through disabling arp_announce / arp_ignore / send_redirects kernel variables disablement


Linux answers ARP requests on wrong and unassociated interfaces per default. This leads to the following two problems:

ARP requests for the loopback alias address are answered on the HW interfaces (even if NOARP on lo0:1 is set). Since loopback aliases are required for DSR (Direct Server Return) setups this problem is very common (but easy to fix fortunately).

If the machine is connected twice to the same switch (e.g. with eth0 and eth1) eth2 may answer ARP requests for the address on eth1 and vice versa in a race condition manner (confusing almost everything).

This can be prevented by specific arp kernel settings. Take a look here for additional information about the nature of the problem (and other solutions): ARP flux.

To fix that generally (and reboot safe) we  include the following lines into


Hypervisor:~# cp -rpf /etc/sysctl.conf /etc/sysctl.conf_bak_07-feb-2022
Hypervisor:~# cat >> /etc/sysctl.conf

# LVS tuning
net.ipv4.conf.lo.arp_ignore=1
net.ipv4.conf.lo.arp_announce=2
net.ipv4.conf.all.arp_ignore=1
net.ipv4.conf.all.arp_announce=2

net.ipv4.conf.all.send_redirects=0
net.ipv4.conf.eth0.send_redirects=0
net.ipv4.conf.eth1.send_redirects=0
net.ipv4.conf.default.send_redirects=0

Press CTRL + D simultaneusly to Write out up-pasted vars.


To read more on Load Balancer using direct routing and on LVS and the arp problem here


2. Digging further the IP conflict / dulicate MAC Problems

Even after this arp tunings (because I do have my Hypervisor 2 LAN interfaces connected to 1 switch) did not resolved the issues and still my Wireless Connected devices via network 192.168.1.1/24 (ISP2) were randomly assigned the wrong range IPs 192.168.0.XXX/24 as well as the wrong gateway 192.168.0.1 (ISP1).
After thinking thoroughfully for hours and checking the network status with various tools and thanks to the fact that my wife has a MacBook Air that was always complaining that the IP it tried to assign from the DHCP was already taken, i"ve realized, something is wrong with DHCP assignment.
Since she owns a IPhone 10 with iOS and this two devices are from the same vendor e.g. Apple Inc. And Apple's products have been having strange DHCP assignment issues from my experience for quite some time, I've thought initially problems are caused by software on Apple's devices.
I turned to be partially right after expecting the logs of DHCP server on the Linux host (ISP1) finding that the phone of my wife takes IP in 192.168.0.XXX, insetad of IP from 192.168.1.1 (which has is a combined Nokia Router with 2.4Ghz and 5Ghz Wi-Fi and LAN router provided by ISP2 in that case Vivacom). That was really puzzling since for me it was completely logical thta the iDevices must check for DHCP address directly on the Network of the router to whom, they're connecting. Guess my suprise when I realized that instead of that the iDevices does listen to the network on a wide network range scan for any DHCPs reachable baesd on the advertised (i assume via broadcast) address traffic and try to connect and take the IP to the IP of the DHCP which responds faster !!!! Of course the Vivacom Chineese produced Nokia router responded DHCP requests and advertised much slower, than my Linux NAT gateway on ISP1 and because of that the Iphone and iOS and even freshest versions of Android devices do take the IP from the DHCP that responds faster, even if that router is not on a C class network (that's invasive isn't it??). What was even more puzzling was the automatic MAC Randomization of Wifi devices trying to connect to my ISP1 configured DHCPD and this of course trespassed any static MAC addresses filtering, I already had established there.

Anyways there was also a good think out of tthat intermixed exercise 🙂 While playing around with the Gigabit network router of vivacom I found a cozy feature SCHEDULEDING TURNING OFF and ON the WIFI ACCESS POINT  – a very useful feature to adopt, to stop wasting extra energy and lower a bit of radiation is to set a swtich off WIFI AP from 12:30 – 06:30 which are the common sleeping hours or something like that.
 

3. What is MAC Randomization and where and how it is configured across different main operating systems as of year 2022?

Depending on the operating system of your device, MAC randomization will be available either by default on most modern mobile OSes or with possibility to have it switched on:

  • Android Q: Enabled by default 
  • Android P: Available as a developer option, disabled by default
  • iOS 14: Available as a user option, disabled by default
  • Windows 10: Available as an option in two ways – random for all networks or random for a specific network

Lately I don't have much time to play around with mobile devices, and I do not my own a luxury mobile phone so, the fact this ne Androids have this MAC randomization was unknown to me just until I ended a small mess, based on my poor configured networks due to my tight time constrains nowadays.

Finding out about the new security feature of MAC Randomization, on all Android based phones (my mother's Nokia smartphone and my dad's phone, disabled the feature ASAP:


4. Disable MAC Wi-Fi Ethernet device Randomization on Android

MAC Randomization creates a random MAC address when joining a Wi-Fi network for the first time or after “forgetting” and rejoining a Wi-Fi network. It Generates a new random MAC address after 24 hours of last connection.

Disabling MAC Randomization on your devices. It is done on a per SSID basis so you can turn off the randomization, but allow it to function for hotspots outside of your home.

  1. Open the Settings app
  2. Select Network and Internet
  3. Select WiFi
  4. Connect to your home wireless network
  5. Tap the gear icon next to the current WiFi connection
  6. Select Advanced
  7. Select Privacy
  8. Select "Use device MAC"
     

5. Disabling MAC Randomization on MAC iOS, iPhone, iPad, iPod

To Disable MAC Randomization on iOS Devices:

Open the Settings on your iPhone, iPad, or iPod, then tap Wi-Fi or WLAN


  1. Tap the information button next to your network
  2. Turn off Private Address
  3. Re-join the network


Of course next I've collected their phone Wi-Fi adapters and made sure the included dhcp MAC deny rules in /etc/dhcp/dhcpd.conf are at place.

The effect of the MAC Randomization for my Network was terrible constant and strange issues with my routings and networks, which I always thought are caused by the openxen hypervisor Virtualization VM bugs etc.

That continued for some months now, and the weird thing was the issues always started when I tried to update my Operating system to the latest packetset, do a reboot to load up the new piece of software / libraries etc. and plus it happened very occasionally and their was no obvious reason for it.


6. How to completely filter dhcp traffic between two network router hosts
IP 192.168.0.1 / 192.168.1.1 to stop 2 or more configured DHCP servers
on separate networks see each other

To prevent IP mess at DHCP2 server side (which btw is ISC DHCP server, taking care for IP assignment only for the Servers on the network running on Debian 11 Linux), further on I had to filter out any DHCP UDP traffic with iptables completely.
To prevent incorrect route assignments assuming that you have 2 networks and 2 routers that are configurred to do Network Address Translation (NAT)-ing Router 1: 192.168.0.1, Router 2: 192.168.1.1.

You have to filter out UDP Protocol data on Port 67 and 68 from the respective source and destination addresses.

In firewall rules configuration files on your Linux you need to have some rules as:

# filter outgoing dhcp traffic from 192.168.1.1 to 192.168.0.1
-A INPUT -p udp -m udp –dport 67:68 -s 192.168.1.1 -d 192.168.0.1 -j DROP
-A OUTPUT -p udp -m udp –dport 67:68 -s 192.168.1.1 -d 192.168.0.1 -j DROP
-A FORWARD -p udp -m udp –dport 67:68 -s 192.168.1.1 -d 192.168.0.1 -j DROP

-A INPUT -p udp -m udp –dport 67:68 -s 192.168.0.1 -d 192.168.1.1 -j DROP
-A OUTPUT -p udp -m udp –dport 67:68 -s 192.168.0.1 -d 192.168.1.1 -j DROP
-A FORWARD -p udp -m udp –dport 67:68 -s 192.168.0.1 -d 192.168.1.1 -j DROP

-A INPUT -p udp -m udp –sport 67:68 -s 192.168.1.1 -d 192.168.0.1 -j DROP
-A OUTPUT -p udp -m udp –sport 67:68 -s 192.168.1.1 -d 192.168.0.1 -j DROP
-A FORWARD -p udp -m udp –sport 67:68 -s 192.168.1.1 -d 192.168.0.1 -j DROP


You can download also filter_dhcp_traffic.sh with above rules from here


Applying this rules, any traffic of DHCP between 2 routers is prohibited and devices from Net: 192.168.1.1-255 will no longer wrongly get assinged IP addresses from Network range: 192.168.0.1-255 as it happened to me.


7. Filter out DHCP traffic based on MAC completely on Linux with arptables

If even after disabling MAC randomization on all devices on the network, and you know physically all the connecting devices on the Network, if you still see some weird MAC addresses, originating from a wrongly configured ISP traffic router host or whatever, then it is time to just filter them out with arptables.

## drop traffic prevent mac duplicates due to vivacom and bergon placed in same network – 255.255.255.252
dchp1-server:~# arptables -A INPUT –source-mac 70:e2:83:12:44:11 -j DROP


To list arptables configured on Linux host

dchp1-server:~# arptables –list -n


If you want to be paranoid sysadmin you can implement a MAC address protection with arptables by only allowing a single set of MAC Addr / IPs and dropping the rest.

dchp1-server:~# arptables -A INPUT –source-mac 70:e2:84:13:45:11 -j ACCEPT
dchp1-server:~# arptables -A INPUT  –source-mac 70:e2:84:13:45:12 -j ACCEPT


dchp1-server:~# arptables -L –line-numbers
Chain INPUT (policy ACCEPT)
1 -j DROP –src-mac 70:e2:84:13:45:11
2 -j DROP –src-mac 70:e2:84:13:45:12

Once MACs you like are accepted you can set the INPUT chain policy to DROP as so:

dchp1-server:~# arptables -P INPUT DROP


If you later need to temporary, clean up the rules inside arptables on any filtered hosts flush all rules inside INPUT chain, like that
 

dchp1-server:~#  arptables -t INPUT -F

How to disable appArmor automatically installed and loaded after Linux Debian 10 to 11 Upgrade. Disable Apparmour on Deb based Linux

Friday, January 28th, 2022

check-apparmor-status-linux-howto-disable-Apparmor_on-debian-ubuntu-mint-and-other-deb-based-linux-distributions

I've upgraded recently all my machines from Debian Buster Linux 10 to Debian 11 Bullseye (if you wonder what Bullseye is) this is one of the heroes of Disneys Toy Stories which are used for a naming of General Debian Distributions.
After the upgrade most of the things worked expected, expect from some stuff like MariaDB (MySQL) and other weirdly behaving services. After some time of investigation being unable to find out what was causing the random issues observed on the machines. I finally got the strange daemon improper functioning and crashing was caused by AppArmor.

AppArmor ("Application Armor") is a Linux kernel security module that allows the system administrator to restrict programs' capabilities with per-program profiles. Profiles can allow capabilities like network access, raw socket access, and the permission to read, write, or execute files on matching paths. AppArmor supplements the traditional Unix discretionary access control (DAC) model by providing mandatory access control (MAC). It has been partially included in the mainline Linux kernel since version 2.6.36 and its development has been supported by Canonical since 2009.

The general idea of apparmor is wonderful as it could really strengthen system security, however it should be setup on install time and not setup on update time. For one more time I got convinced myself that upgrading from version to version to keep up to date with security is a hard task and often the results are too much unexpected and a better way to upgrade from General version to version any modern Linux / Unix distribution (and their forked mobile equivalents Android etc.) is to just make a copy of the most important configuration, setup the services on a freshly new installed machine be it virtual or a physical Server and rebuild the whole system from scratch, test and then run the system in production, substituting the old server general version with the new machine. 

The rest is leading to so much odd issues like this time with AppArmors causing distractions on the servers hosted applications.

But enough rent if you're unlucky and unwise enough to try to Upgrade Debian / Ubuntu 20, 21 / Mint 18, 19 etc. or whatever Deb distro from older general release to a newer One. Perhaps the best first thing to do onwards is stop and remove AppArmor (those who are hardcore enthusiasts could try to enable the failing services due to apparmor), by disabling the respective apparmor hardening profile but i did not have time to waste on stupid stuff and experiment so I preferred to completely stop it. 

To identify the upgrade oddities has to deal with apparmors service enabled security protections you should be able to find respective records inside /var/log/messages as well as in /var/log/audit/audit.log


# dmesg

[   64.210463] audit: type=1400 audit(1548120161.662:21): apparmor="DENIED" operation="sendmsg" info="Failed name lookup – disconnected path" error=-13 profile="/usr/sbin/mysqld" name="run/systemd/notify" pid=2527 comm="mysqld" requested_mask="w" denied_mask="w" fsuid=113 ouid=0
[  144.364055] audit: type=1400 audit(1548120241.595:22): apparmor="DENIED" operation="sendmsg" info="Failed name lookup – disconnected path" error=-13 profile="/usr/sbin/mysqld" name="run/systemd/notify" pid=2527 comm="mysqld" requested_mask="w" denied_mask="w" fsuid=113 ouid=0
[  144.465883] audit: type=1400 audit(1548120241.699:23): apparmor="DENIED" operation="sendmsg" info="Failed name lookup – disconnected path" error=-13 profile="/usr/sbin/mysqld" name="run/systemd/notify" pid=2527 comm="mysqld" requested_mask="w" denied_mask="w" fsuid=113 ouid=0
[  144.566363] audit: type=1400 audit(1548120241.799:24): apparmor="DENIED" operation="sendmsg" info="Failed name lookup – disconnected path" error=-13 profile="/usr/sbin/mysqld" name="run/systemd/notify" pid=2527 comm="mysqld" requested_mask="w" denied_mask="w" fsuid=113 ouid=0
[  144.666722] audit: type=1400 audit(1548120241.899:25): apparmor="DENIED" operation="sendmsg" info="Failed name lookup – disconnected path" error=-13 profile="/usr/sbin/mysqld" name="run/systemd/notify" pid=2527 comm="mysqld" requested_mask="w" denied_mask="w" fsuid=113 ouid=0
[  144.767069] audit: type=1400 audit(1548120241.999:26): apparmor="DENIED" operation="sendmsg" info="Failed name lookup – disconnected path" error=-13 profile="/usr/sbin/mysqld" name="run/systemd/notify" pid=2527 comm="mysqld" requested_mask="w" denied_mask="w" fsuid=113 ouid=0
[  144.867432] audit: type=1400 audit(1548120242.099:27): apparmor="DENIED" operation="sendmsg" info="Failed name lookup – disconnected path" error=-13 profile="/usr/sbin/mysqld" name="run/systemd/notify" pid=2527 comm="mysqld" requested_mask="w" denied_mask="w" fsuid=113 ouid=0


1. How to check if AppArmor is running on the system

If you have a system with enabled apparmor you should get some output like:

root@haproxy2:~# apparmor_status 
apparmor module is loaded.
5 profiles are loaded.
5 profiles are in enforce mode.
   /usr/sbin/ntpd
   lsb_release
   nvidia_modprobe
   nvidia_modprobe//kmod
   tcpdump
0 profiles are in complain mode.
1 processes have profiles defined.
1 processes are in enforce mode.
   /usr/sbin/ntpd (387) 
0 processes are in complain mode.
0 processes are unconfined but have a profile defined.


Also if you check the service you will find out that Debian's Major Release upgrade from 10 Buster to 11 BullsEye with.

apt update -y && apt upgrade -y && apt dist-update -y

automatically installed apparmor and started the service, e.g.:

# systemctl status apparmor
● apparmor.service – Load AppArmor profiles
     Loaded: loaded (/lib/systemd/system/apparmor.service; enabled; vendor pres>
     Active: active (exited) since Sat 2022-01-22 23:04:58 EET; 5 days ago
       Docs: man:apparmor(7)
             https://gitlab.com/apparmor/apparmor/wikis/home/
    Process: 205 ExecStart=/lib/apparmor/apparmor.systemd reload (code=exited, >
   Main PID: 205 (code=exited, status=0/SUCCESS)
        CPU: 43ms

яну 22 23:04:58 haproxy2 apparmor.systemd[205]: Restarting AppArmor
яну 22 23:04:58 haproxy2 apparmor.systemd[205]: Reloading AppArmor profiles
яну 22 23:04:58 haproxy2 systemd[1]: Starting Load AppArmor profiles…
яну 22 23:04:58 haproxy2 systemd[1]: Finished Load AppArmor profiles.


# dpkg -l |grep -i apparmor
ii  apparmor                          2.13.6-10                      amd64        user-space parser utility for AppArmor
ii  libapparmor1:amd64                2.13.6-10                      amd64        changehat AppArmor library
ii  libapparmor-perl:amd64               2.13.6-10


In case AppArmor is disabled, you will get something like:

root@pcfrxenweb:~# aa-status 
apparmor module is loaded.
0 profiles are loaded.
0 profiles are in enforce mode.
0 profiles are in complain mode.
0 processes have profiles defined.
0 processes are in enforce mode.
0 processes are in complain mode.
0 processes are unconfined but have a profile defined.


2. How to disable AppArmor for particular running services processes

In my case after the upgrade of a system running a MySQL Server suddenly out of nothing after reboot the Database couldn't load up properly and if I try to restart it with the usual

root@pcfrxen: /# systemctl restart mariadb

I started getting errors like:

DBI connect failed : Can't connect to local MySQL server through socket '/var/run/mysqld/mysqld.sock' (2)

To get an idea of what kind of profile definitions, could be enabled disabled on apparmor enabled system do:
 

root@pcfrxen:/var/log# ls -1 /etc/apparmor.d/
abstractions/
force-complain/
local/
lxc/
lxc-containers
samba/
system_tor
tunables/
usr.bin.freshclam
usr.bin.lxc-start
usr.bin.man
usr.bin.tcpdump
usr.lib.telepathy
usr.sbin.clamd
usr.sbin.cups-browsed
usr.sbin.cupsd
usr.sbin.ejabberdctl
usr.sbin.mariadbd
usr.sbin.mysqld
usr.sbin.named
usr.sbin.ntpd
usr.sbin.privoxy
usr.sbin.squid

Lets say you want to disable any protection AppArmor profile for MySQL you can do it with:

root@pcfrxen:/ #  ln -s /etc/apparmor.d/usr.sbin.mysqld /etc/apparmor.d/disable/
root@pcfrxen:/ # apparmor_parser -R /etc/apparmor.d/usr.sbin.mysqld 


To make the system know you have disabled a profile you should restart apparmor service:
 

root@pcfrxen:/ # systemctl restart apparmor.service


3. Disable completely AppArmor to save your time weird system behavior and hang bangs

In my opinion the best thing to do anyways, especially if you don't run Containerized applications, that runs only one single application / service at at time is to completely disable apparmor, otherwise you would have to manually check each of the running applications before the upgrade and make sure that apparmor did not bring havoc to some of it.
Hence my way was to simple get rid of apparmor by disable and remove the related package completely out of the system to do so:

root@pcfrxen:/ # systemctl stop apparmor
root@pcfrxen:/ # systemctl disable apparmor
root@pcfrxen:/ # apt-get remove -y apparmor

Once  disabled to make the system completely load out anything loaded related to apparmor loaded into system memory, you should do machine reboot.

root@pcfrxen:/ # shutdown -r now

Hopefully if you run into same issue after removal of apparmor most of the things should be working fine after the upgrade. Anyways I had to go through each and every app everywhere and make sure it is working as expected. The major release upgrade has also automatically enabled me some of the already disable services, thus if you have upgraded like me I would advice you do a close check on every enabled / running service everywhere:

root@pcfrxen:/# systemctl list-unit-files|grep -i enabled

Beware of AppArmor  !!! 🙂

How to set up dsmc client Tivoli ( TSM ) release version and process check monitoring with Zabbix

Thursday, December 17th, 2020

zabbix-monitor-dsmc-client-monitor-ibm-tsm-with-zabbix-howto

As a part of Monitoring IBM Spectrum (the new name of IBM TSM) if you don't have the money to buy something like HP Open View monitoring or other kind of paid monitoring system but you use Zabbix open source solution to monitor your Linux server infrastructure and you use Zabbix as a main Services and Servers monitoring platform you will want to monitor at least whether the running Tivoli dsmc backup clients run fine on each of the server (e.g. the dsmc client) runs normally as a backup solution with its common /usr/bin/dsmc process service that connects towards remote IBM TSM server where the actual Data storage is kept.

It might be a kind of weird monitoring to setup to have the tsm version frequently reported to a Zabbix server on a first glimpse, but in reality this is quite useful especially if you want to have a better overview of your multiple servers environment IBM (Spectrum Protect) Storage manager backup solution actual release.
 
So the goal is to have reported dsmc interactive storage manager version as reported from
 

[root@server ~]# dsmc

IBM Spectrum Protect
Command Line Backup-Archive Client Interface
  Client Version 8, Release 1, Level 11.0
  Client date/time: 12/17/2020 15:59:32
(c) Copyright by IBM Corporation and other(s) 1990, 2020. All Rights Reserved.

Node Name: Sub-Hostname.FQDN.COM
Session established with server TSM_SERVER: AIX
  Server Version 8, Release 1, Level 10.000
  Server date/time: 12/17/2020 15:59:34  Last access: 12/17/2020 13:28:01


into zabbix and set reports in case if your sysadmins have changed version of a IBM TSM to a newer version. Thus for non sysadmins and less technical persons as Service Delivery Managers (SDMs) it is much easier to track changes of multiple servers Tivoli version to a newer one.

Enough talk let me next show you how to setup the required with a small UserParameter one liner bash shell script.
 

1. Create TSM Userparameter script


With Userparameter key and content as below:

[root@server ~]# vim /etc/zabbix/zabbix_agentd.d/userparameter_TSM.conf


UserParameter=dsmc.version,cat /var/tsm/sched.log | grep Clie | tail -n 1 | awk '{print $7 " " $8 " " $9 " " $10 " " $11 " " $12 " " $13}'


The script output of TivSM version will be reported as so:

[root@server ~]# cat /var/tsm/sched.log | grep Clie | tail -n 1 | awk '{print $7 " " $8 " " $9 " " $10 " " $11 " " $12 " " $13}'
Client Version 8, Release 1, Level 11.0


If you want to get only a major version report from dsmc:

UserParameter=dsmc.version,cat /var/tsm/sched.log | grep Clie | tail -n 1 | awk '{print $7 " " $8 " " $9}'


The output as a major version you will get is

[root@server ~]# cat /var/tsm/sched.log | grep Clie | tail -n 1 | awk '{print $7 " " $8 " " $9}'
Client Version 8,


2. Restart the zabbix agent to load userparam script

To load above configured Userparameter script we need to restart zabbix-agent client

[root@server ~]# systemctl restart zabbix-agent

[root@server ~]#  systemctl status zabbix-agent
● zabbix-agent.service – Zabbix Agent
   Loaded: loaded (/usr/lib/systemd/system/zabbix-agent.service; enabled; vendor preset: disabled)
   Active: active (running) since Wed 2020-07-22 16:17:17 CEST; 4 months 26 days ago
 Main PID: 7817 (zabbix_agentd)
   CGroup: /system.slice/zabbix-agent.service
           ├─7817 /usr/sbin/zabbix_agentd -c /etc/zabbix/zabbix_agentd.conf
           ├─7818 /usr/sbin/zabbix_agentd: collector [idle 1 sec]
           ├─7819 /usr/sbin/zabbix_agentd: listener #1 [waiting for connection]
           ├─7820 /usr/sbin/zabbix_agentd: listener #2 [waiting for connection]
           ├─7821 /usr/sbin/zabbix_agentd: listener #3 [waiting for connection]
           └─7822 /usr/sbin/zabbix_agentd: active checks #1 [idle 1 sec]


3. Create template for TSM Service check and TSM Version


You will need to create 1 Trigger and 2 Items for the Service check and for TSM version reporting

tsm-service-version-screenshot-zabbix
As you see necessery names / keys to create are:

Name / Key: TSM – Service State proc.num{dsmcad}

Name / key: TSM version dmsc.version


3.1 Create the trigger


Now lets create the trigger that will report the Service State

tsm-service-state-zabbix-screenshot


Linux TSM:proc.num[dsmcad].last()}=0


3.2 Create the Items


zabbix-dsmc-proc-num-item-setting-screenshot-linux


Name: dsmcad
Key: proc.num{dsmcad}


tsm-version-item-zabbix-screenshot
 

Update interval: 1d
History Storage period: 90d
Applications: TSM


3.3 Create Zabbix Action

As usual if you want to receive some Email Alerting or lets say send SMS in case of Trigger is matched create the necessery Action with
instructions on how to solve the problem if there is a Standard Operation Procedure ( SOP ) as often called in the corporate world for that.

That's all folks ! 🙂


How to test RAM Memory for errors in Linux / UNIX OS servers. Find broken memory RAM banks

Friday, December 3rd, 2021

test-ram-memory-for-errors-linux-unix-find-broken-memory-logo


1. Testing the memory with motherboard integrated tools
 

Memory testing has been integral part of Computers for the last 50 years. In the dawn of computers those older perhaps remember memory testing was part of the computer initialization boot. And this memory testing was delaying the boot with some seconds and the user could see the memory numbers being counted up to the amount of memory. With the increased memory modern computers started to have and the annoyance to wait for a memory check program to check the computer hardware memory on modern computers this check has been mitigated or completely removed on some hardware.
Thus under some circumstances sysadmins or advanced computer users might need to check the memory, especially if there is some suspicion for memory damages or if for example a home PC starts crashing with Blue screens of Death on Windows without reason or simply the PC or some old arcane Linux / UNIX servers gets restarted every now and then for now apparent reason. When such circumstances occur it is an idea to start debugging the hardware issue with a simple memory check.

There are multiple ways to test installed memory banks on a server laptop or local home PC both integrated and using external programs.
On servers that is usually easily done from ILO or IPMI or IDRAC access (usually web) interface of the vendor, on laptops and home usage from BIOS or UEFI (Unified Extensible Firmware Interface) acces interface on system boot that is possible as well.

memtest-hp
HP BIOS Setup

An old but gold TIP, more younger people might not know is the


Prolonged SHIFT key press which once held with the user instructs the machine to initiate a memory test before the computer starts reading what is written in the boot loader.

So before anything else from below article it might be a good idea to just try HOLD SHIFT for 15-20 seconds after a complete Shut and ON from the POWER button.

If this test does not triggered or it is triggered and you end up with some corrupted memory but you're not sure which exact Memory bank is really crashing and want to know more on what memory Bank and segments are breaking up you might want to do a more thorough testing. In below article I'll try to explain shortly how this can be done.


2. Test the memory using a boot USB Flash Drive / DVD / CD 
 

Say hello to memtest86+. It is a Linux GRUB boot loader bootable utility that tests physical memory by writing various patterns to it and reading them back. Since memtest86+ runs directly off the hardware it does not require any operating system support for execution. Perhaps it is important to mention that memtest86 (is PassMark memtest86)and memtest86+ (An Advanced Memory diagnostic tool) are different tools, the first is freeware and second one is FOSS software.

To use it all you'll need is some version of Linux. If you don't already have some burned in somewhere at your closet, you might want to burn one.
For Linux / Mac users this is as downloading a Linux distribution ISO file and burning it with

# dd if=/path/to/iso of=/dev/sdbX bs=80M status=progress


Windows users can burn a Live USB with whatever Linux distro or download and burn the latest versionof memtest86+ from https://www.memtest.org/  on Windows Desktop with some proggie like lets say UnetBootIn.
 

2.1. Run memtest86+ on Ubuntu

Many Linux distributions such as Ubuntu 20.0 comes together with memtest86+, which can be easily invoked from GRUB / GRUB2 Kernel boot loader.
Ubuntu has a separate menu pointer for a Memtest.

ubuntu-grub-2-04-boot-loader-memtest86-menu-screenshot

Other distributions RPM based distributions such as CentOS, Fedora Linux, Redhat things differ.

2.2. memtest86+ on Fedora


Fedora used to have the memtest86+ menu at the GRUB boot selection prompt, but for some reason removed it and in newest Fedora releases as of time such as Fedora 35 memtest86+ is preinstalled and available but not visible, to start on  already and to start a memtest memory test tool:

  •   Boot a Fedora installation or Rescue CD / USB. At the prompt, type "memtest86".

boot: memtest86

2.3 memtest86+ on RHEL Linux

The memtest86+tool is available as an RPM package from Red Hat Network (RHN) as well as a boot option from the Red Hat Enterprise Linux rescue disk.
And nowadays Red Hat Enterprise Linux ships by default with the tool.

Prior redhat (now legacy) releases such as on RHEL 5.0 it has to be installed and configure it with below 3 commands.

[root@rhel ~]# yum install memtest86+
[root@rhel ~]# memtest-setup
[root@rhel ~]# grub2-mkconfig -o /boot/grub2/grub.cfg


    Again as with CentOS to boot memtest86+ from the rescue disk, you will need to boot your system from CD 1 of the Red Hat Enterprise Linux installation media, and type the following at the boot prompt (before the Linux kernel is started):

boot: memtest86

memtestx86-8gigabytes-of-memory-boot-screenshot
memtest86+ testing 5 memory slots

As you see all on above screenshot the Memory banks are listed as Slots. There are a number of Tests to be completed until
it can be said for sure memory does not have any faulty cells. 
The

Pass: 0
Errors: 0 

Indicates no errors, so in the end if memtest86 does not find anything this values should stay at zero.
memtest86+ is also usable to detecting issues with temperature of CPU. Just recently I've tested a PC thinking that some memory has defects but it turned out the issue on the Computer was at the CPU's temperature which was topping up at 80 – 82 Celsius.

If you're unfortunate and happen to get some corrupted memory segments you will get some red fields with the memory addresses found to have corrupted on Read / Write test operations:

memtest86-returning-memory-address-errors-screenshot


2.4. Install and use memtest and memtest86+ on Debian / Mint Linux

You can install either memtest86+ or just for the fun put both of them and play around with both of them as they have a .deb package provided out of debian non-free /etc/apt/sources.list repositories.


root@jeremiah:/home/hipo# apt-cache show memtest86 memtest86+
Package: memtest86
Version: 4.3.7-3
Installed-Size: 302
Maintainer: Yann Dirson <dirson@debian.org>
Architecture: amd64
Depends: debconf (>= 0.5) | debconf-2.0
Recommends: memtest86+
Suggests: hwtools, memtester, kernel-patch-badram, grub2 (>= 1.96+20090523-1) | grub (>= 0.95+cvs20040624), mtools
Description-en: thorough real-mode memory tester
 Memtest86 scans your RAM for errors.
 .
 This tester runs independently of any OS – it is run at computer
 boot-up, so that it can test *all* of your memory.  You may want to
 look at `memtester', which allows testing your memory within Linux,
 but this one won't be able to test your whole RAM.
 .
 It can output a list of bad RAM regions usable by the BadRAM kernel
 patch, so that you can still use you old RAM with one or two bad bits.
 .
 This is the last DFSG-compliant version of this software, upstream
 has opted for a proprietary development model starting with 5.0.  You
 may want to consider using memtest86+, which has been forked from an
 earlier version of memtest86, and provides a different set of
 features.  It is available in the memtest86+ package.
 .
 A convenience script is also provided to make a grub-legacy-based
 floppy or image.

Description-md5: 0ad381a54d59a7d7f012972f613d7759
Homepage: http://www.memtest86.com/
Section: misc
Priority: optional
Filename: pool/main/m/memtest86/memtest86_4.3.7-3_amd64.deb
Size: 45470
MD5sum: 8dd2a4c52910498d711fbf6b5753bca9
SHA256: 09178eca21f8fd562806ccaa759d0261a2d3bb23190aaebc8cd99071d431aeb6

Package: memtest86+
Version: 5.01-3
Installed-Size: 2391
Maintainer: Yann Dirson <dirson@debian.org>
Architecture: amd64
Depends: debconf (>= 0.5) | debconf-2.0
Suggests: hwtools, memtester, kernel-patch-badram, memtest86, grub-pc | grub-legacy, mtools
Description-en: thorough real-mode memory tester
 Memtest86+ scans your RAM for errors.
 .
 This tester runs independently of any OS – it is run at computer
 boot-up, so that it can test *all* of your memory.  You may want to
 look at `memtester', which allows to test your memory within Linux,
 but this one won't be able to test your whole RAM.
 .
 It can output a list of bad RAM regions usable by the BadRAM kernel
 patch, so that you can still use your old RAM with one or two bad bits.
 .
 Memtest86+ is based on memtest86 3.0, and adds support for recent
 hardware, as well as a number of general-purpose improvements,
 including many patches to memtest86 available from various sources.
 .
 Both memtest86 and memtest86+ are being worked on in parallel.
Description-md5: aa685f84801773ef97fdaba8eb26436a
Homepage: http://www.memtest.org/

Tag: admin::benchmarking, admin::boot, hardware::storage:floppy,
 interface::text-mode, role::program, scope::utility, use::checking
Section: misc
Priority: optional
Filename: pool/main/m/memtest86+/memtest86+_5.01-3_amd64.deb
Size: 75142
MD5sum: 4f06523532ddfca0222ba6c55a80c433
SHA256: ad42816e0b17e882713cc6f699b988e73e580e38876cebe975891f5904828005


root@jeremiah:/home/hipo# apt-get install –yes memtest86+

root@jeremiah:/home/hipo# apt-get install –yes memtest86

Reading package lists… Done
Building dependency tree       
Reading state information… Done
Suggested packages:
  hwtools kernel-patch-badram grub2 | grub
The following NEW packages will be installed:
  memtest86
0 upgraded, 1 newly installed, 0 to remove and 21 not upgraded.
Need to get 45.5 kB of archives.
After this operation, 309 kB of additional disk space will be used.
Get:1 http://ftp.de.debian.org/debian buster/main amd64 memtest86 amd64 4.3.7-3 [45.5 kB]
Fetched 45.5 kB in 0s (181 kB/s)     
Preconfiguring packages …
Selecting previously unselected package memtest86.
(Reading database … 519985 files and directories currently installed.)
Preparing to unpack …/memtest86_4.3.7-3_amd64.deb …
Unpacking memtest86 (4.3.7-3) …
Setting up memtest86 (4.3.7-3) …
Generating grub configuration file …
Found background image: saint-John-of-Rila-grub.jpg
Found linux image: /boot/vmlinuz-4.19.0-18-amd64
Found initrd image: /boot/initrd.img-4.19.0-18-amd64
Found linux image: /boot/vmlinuz-4.19.0-17-amd64
Found initrd image: /boot/initrd.img-4.19.0-17-amd64
Found linux image: /boot/vmlinuz-4.19.0-8-amd64
Found initrd image: /boot/initrd.img-4.19.0-8-amd64
Found linux image: /boot/vmlinuz-4.19.0-6-amd64
Found initrd image: /boot/initrd.img-4.19.0-6-amd64
Found linux image: /boot/vmlinuz-4.19.0-5-amd64
Found initrd image: /boot/initrd.img-4.19.0-5-amd64
Found linux image: /boot/vmlinuz-4.9.0-8-amd64
Found initrd image: /boot/initrd.img-4.9.0-8-amd64
Found memtest86 image: /boot/memtest86.bin
Found memtest86+ image: /boot/memtest86+.bin
Found memtest86+ multiboot image: /boot/memtest86+_multiboot.bin
File descriptor 3 (pipe:[66049]) leaked on lvs invocation. Parent PID 22581: /bin/sh
done
Processing triggers for man-db (2.8.5-2) …


After this both memory testers memtest86+ and memtest86 will appear next to the option of booting a different version kernels and the Advanced recovery kernels, that you usually get in the GRUB boot prompt.

2.5. Use memtest embedded tool on any Linux by adding a kernel variable

Edit-Grub-Parameters-add-memtest-4-to-kernel-boot

2.4.1. Reboot your computer

# reboot

2.4.2. At the GRUB boot screen (with UEFI, press Esc).

2.4.3 For 4 passes add temporarily the memtest=4 kernel parameter.
 

memtest=        [KNL,X86,ARM,PPC,RISCV] Enable memtest
                Format: <integer>
                default : 0 <disable>
                Specifies the number of memtest passes to be
                performed. Each pass selects another test
                pattern from a given set of patterns. Memtest
                fills the memory with this pattern, validates
                memory contents and reserves bad memory
                regions that are detected.


3. Install and use memtester Linux tool
 

At some condition, memory is the one of the suspcious part, or you just want have a quick test. memtester  is an effective userspace tester for stress-testing the memory subsystem.  It is very effective at finding intermittent and non-deterministic faults.

The advantage of memtester "live system check tool is", you can check your system for errors while it's still running. No need for a restart, just run that application, the downside is that some segments of memory cannot be thoroughfully tested as you already have much preloaded data in it to have the Operating Sytstem running, thus always when possible try to stick to rule to test the memory using memtest86+  from OS Boot Loader, after a clean Machine restart in order to clean up whole memory heap.

Anyhow for a general memory test on a Critical Legacy Server  (if you lets say don't have access to Remote Console Board, or don't trust the ILO / IPMI Hardware reported integrity statistics), running memtester from already booted is still a good idea.


3.1. Install memtester on any Linux distribution from source

wget http://pyropus.ca/software/memtester/old-versions/memtester-4.2.2.tar.gz
# tar zxvf memtester-4.2.2.tar.gz
# cd memtester-4.2.2
# make && make install

3.2 Install on RPM based distros


On Fedora memtester is available from repositories however on many other RPM based distros it is not so you have to install it from source.

[root@fedora ]# yum install -y memtester


3.3. Install memtester on Deb based Linux distributions from source
 

To install it on Debian / Ubuntu / Mint etc. , open a terminal and type:
 

root@linux:/ #  apt install –yes memtester

The general run syntax is:

memtester [-p PHYSADDR] [ITERATIONS]


You can hence use it like so:

hipo@linux:/ $ sudo memtester 1024 5

This should allocate 1024MB of memory, and repeat the test 5 times. The more repeats you run the better, but as a memtester run places a great overall load on the system you either don't increment the runs too much or at least run it with  lowered process importance e.g. by nicing the PID:

hipo@linux:/ $ nice -n 15 sudo memtester 1024 5


  • If you have more RAM like 4GB or 8GB, it is upto you how much memory you want to allocate for testing.
  • As your operating system, current running process might take some amount of RAM, Please check available Free RAM and assign that too memtester.
  • If you are using a 32 Bit System, you cant test more than 4 GB even though you have more RAM( 32 bit systems doesnt support more than 3.5 GB RAM as you all know).
  • If your system is very busy and you still assigned higher than available amount of RAM, then the test might get your system into a deadlock, leads to system to halt, be aware of this.
  • Run the memtester as root user, so that memtester process can malloc the memory, once its gets hold on that memory it will try to apply lock. if specified memory is not available, it will try to reduce required RAM automatically and try to lock it with mlock.
  • if you run it as a regular user, it cant auto reduce the required amount of RAM, so it cant lock it, so it tries to get hold on that specified memory and starts exhausting all system resources.


If you have 8 Gigas of RAM plugged into the PC motherboard you have to multiple 1024*8 this is easily done with bc (An arbitrary precision calculator language) tool:

root@linux:/ # bc -l
bc 1.07.1
Copyright 1991-1994, 1997, 1998, 2000, 2004, 2006, 2008, 2012-2017 Free Software Foundation, Inc.
This is free software with ABSOLUTELY NO WARRANTY.
For details type `warranty'. 
8*1024
8192


 for example you should run:

root@linux:/ # memtester 8192 5

memtester version 4.3.0 (64-bit)
Copyright (C) 2001-2012 Charles Cazabon.
Licensed under the GNU General Public License version 2 (only).

pagesize is 4096
pagesizemask is 0xfffffffffffff000
want 8192MB (2083520512 bytes)
got  8192MB (2083520512 bytes), trying mlock …Loop 1/1:
  Stuck Address       : ok        
  Random Value        : ok
  Compare XOR         : ok
  Compare SUB         : ok
  Compare MUL         : ok
  Compare DIV         : ok
  Compare OR          : ok
  Compare AND         : ok
  Sequential Increment: ok
  Solid Bits          : ok        
  Block Sequential    : ok        
  Checkerboard        : ok        
  Bit Spread          : ok        
  Bit Flip            : ok        
  Walking Ones        : ok        
  Walking Zeroes      : ok        
  8-bit Writes        : ok
  16-bit Writes       : ok

Done.


4. Shell Script to test server memory for corruptions
 

If for some reason the machine you want to run a memory test doesn't have connection to the external network such as the internet and therefore you cannot configure a package repository server and install memtester, the other approach is to use a simple memory test script such as memtestlinux.sh
 

#!/bin/bash
# Downloaded from https://www.srv24x7.com/memtest-linux/
echo "ByteOnSite Memory Test"
cpus=`cat /proc/cpuinfo | grep processor | wc -l`
if [ $cpus -lt 6 ]; then
threads=2
else
threads=$(($cpus / 2))
fi
echo "Detected $cpus CPUs, using $threads threads.."
memory=`free | grep 'Mem:' | awk {'print $2'}`
memoryper=$(($memory / $threads))
echo "Detected ${memory}K of RAM ($memoryper per thread).."
freespace=`df -B1024 . | tail -n1 | awk {'print $4'}`
if [ $freespace -le $memory ]; then
echo You do not have enough free space on the current partition. Minimum: $memory bytes
exit 1
fi
echo "Clearing RAM Cache.."
sync; echo 3 > /proc/sys/vm/drop_cachesfile
echo > dump.memtest.img
echo "Writing to dump file (dump.memtest.img).."
for i in `seq 1 $threads`;
do
# 1044 is used in place of 1024 to ensure full RAM usage (2% over allocation)
dd if=/dev/urandom bs=$memoryper count=1044 >> dump.memtest.img 2>/dev/null &
pids[$i]=$!
echo $i
done
for pid in "${pids[@]}"
do
wait $pid
done

echo "Reading and analyzing dump file…"
echo "Pass 1.."
md51=`md5sum dump.memtest.img | awk {'print $1'}`
echo "Pass 2.."
md52=`md5sum dump.memtest.img | awk {'print $1'}`
echo "Pass 3.."
md53=`md5sum dump.memtest.img | awk {'print $1'}`
if [ “$md51” != “$md52” ]; then
fail=1
elif [ “$md51” != “$md53” ]; then
fail=1
elif [ “$md52” != “$md53” ]; then
fail=1
else
fail=0
fi
if [ $fail -eq 0 ]; then
echo "Memory test PASSED."
else
echo "Memory test FAILED. Bad memory detected."
fi
rm -f dump.memtest.img
exit $fail

Nota Bene !: Again consider the restults might not always be 100% trustable if possible restart the server and test with memtest86+

Consider also its important to make sure prior to script run,  you''ll have enough disk space to produce the dump.memtest.img file – file is created as a test bed for the memory tests and if not scaled properly you might end up with a full ( / ) root directory!


4.1 Other memory test script with dd and md5sum checksum

I found this solution on the well known sysadmin site nixCraft cyberciti.biz, I think it makes sense and quicker.

First find out memory site using free command.
 

# free
             total       used       free     shared    buffers     cached
Mem:      32867436   32574160     293276          0      16652   31194340
-/+ buffers/cache:    1363168   31504268
Swap:            0          0          0


It shows that this server has 32GB memory,
 

# dd if=/dev/urandom bs=32867436 count=1050 of=/home/memtest


free reports by k and use 1050 is to make sure file memtest is bigger than physical memory.  To get better performance, use proper bs size, for example 2048 or 4096, depends on your local disk i/o,  the rule is to make bs * count > 32 GB.
run

# md5sum /home/memtest; md5sum /home/memtest; md5sum /home/memtest


If you see md5sum mismatch in different run, you have faulty memory guaranteed.
The theory is simple, the file /home/memtest will cache data in memory by filling up all available memory during read operation. Using md5sum command you are reading same data from memory.


5. Other ways to test memory / do a machine stress test

Other good tools you might want to check for memory testing is mprime – ftp://mersenne.org/gimps/ 
(https://www.mersenne.org/ftp_root/gimps/)

  •  (mprime can also be used to stress test your CPU)

Alternatively, use the package stress-ng to run all kind of stress tests (including memory test) on your machine.
Perhaps there are other interesting tools for a diagnosis of memory if you know other ones I miss, let me know in the comment section.

How to mask rpcbind on CentOS to prevent rpcbind service from auto start new local server port listener triggered by Security audit port scanner software

Wednesday, December 1st, 2021

how to mute rpcbind on CentOS to prevent rpcbind service from auto start new local server port rpc-remote-procedure-call-picture


Introduction to  THE PROBLEM :
rpcbind TCP/UDP port 111 automatically starting itself out of nothing on CentOS 7 Linux

For server environments that are being monitored regularly for CVI security breaches based on opened TCP / UDP ports with like Qualys (a proprietary business software that helps automate the full spectrum of auditing, compliance and protection of your IT systems and web applications.), perhaps the closest ex-open source equivallent was Nessus Security Scanner or the more modern security audit Linux tools – Intruder (An Effortless Vulnerability Scanner), OpenVAS (Open Vulnerability Assessment Scanner) or even a simple nmap command port scan on TCP IP / UDP protocol for SunRPC default predefined machine port 111.


[root@centos~]# cat /etc/redhat-release
CentOS Linux release 7.9.2009 (Core)


[root@centos~]# grep -i rpcbind /etc/services
sunrpc          111/tcp         portmapper rpcbind      # RPC 4.0 portmapper TCP
sunrpc          111/udp         portmapper rpcbind      # RPC 4.0 portmapper UDP


Note! For those who don't know it or newer to Linux 
/etc/services file
used to be a file with predefiend well known services and their ports in Linux as well as other UNIXes for years now.

So once this scan is triggered you might end up in a very strange situation that the amount of processes on the CentOS Linux server misterously change with +1 as even though disabled systemctl rpcbind.service process will appear running again.
 

[root@centos~]# ps -ef|grep -i rpcbind
rpc        100     1  0 Nov11 ?        00:00:02 /sbin/rpcbind -w
root     29099 22060  0 13:07 pts/0    00:00:00 grep –color=auto -i rpcbind
[root@centos ~]#

By the wayit took us a while to me and my colleagues to identify what was the mysterious reason for triggering rpcbind process on a  gets triggered and rpcbind process appears in process list even though the machine is in a very secured DMZ Lan and there is no cron jobs or any software that does any kind of scheduling that might lead rpcbind to start up like it does.

[root@centos ~]# systemctl list-unit-files|grep -i rpcbind
rpcbind.service                               disabled
rpcbind.socket                                disabled
rpcbind.target                                static


There is absoultely no logic in that a service whose stopped on TCP / UDP 111 on a machine that is lacking no firewall rules such as iptables CHAINs or whatever.

[root@centos~]# systemctl status rpcbind
● rpcbind.service – RPC bind service
   Loaded: loaded (/usr/lib/systemd/system/rpcbind.service; disabled; vendor preset: enabled)
   Active: inactive (dead)


A you can see the service after all seems to have been disabled originally but after some time this output auto-magically was turning to rpcbind.socket enabled:

root@centos ~]# systemctl list-unit-files|grep -i rpcbind
rpcbind.service                               disabled
rpcbind.socket                                enabled
rpcbind.target                                static

Hence to prevent the rpcbind.socket to automatically respawn itself and lead to resurrection of the dead and disabled /sbin/rpcbind


1. Disable listener in  /usr/lib/systemd/system/rpcbind.socket file


And comment all Listen* rows there

[root@centos ~]# vi /usr/lib/systemd/system/rpcbind.socket

[Unit]

Description=RPCbind Server Activation Socket


[Socket]

ListenStream=/var/run/rpcbind.sock


# RPC netconfig can't handle ipv6/ipv4 dual sockets

BindIPv6Only=ipv6-only

#ListenStream=0.0.0.0:111

#ListenDatagram=0.0.0.0:111

#ListenStream=[::]:111

#ListenDatagram=[::]:111


[Install]

WantedBy=sockets.target

2. Mask rpcbind.socket and, sure /etc/systemd/system/rpcbind.socket links to /dev/null

Mute completely rpcbind.socket (this is systemd option "feature" to link service to /dev/null)

[root@centos ~]# systemctl mask rpcbind.socket


Hence, the link from /etc/systemd/system/rpcbind.socket must be linked to /dev/null

[root@centos ~]# ls -l /etc/systemd/system/rpcbind.socket
lrwxrwxrwx 1 root root 9 Jan 27  2020 /etc/systemd/system/rpcbind.socket -> /dev/null


Voila ! That should be it rpcbind should not hang around anymore among other processes.