Posts Tagged ‘information’

How to count number of ESTABLISHED state TCP connections to a Windows server

Wednesday, March 13th, 2024

count-netstat-established-connections-on-windows-server-howto-windows-logo-debug-network-issues-windows

Even if you have the background of a Linux system administrator, sooner or later you will have have to deal with some Windows hosts, thus i'll blog in this article shortly on how the established TCP if it happens you will have to administarte a Windows hosts or help a windows sysadmin noobie 🙂

In Linux it is pretty easy to check the number of established conenctions, because of the wonderful command wc (word count). with a simple command like:
 

$ netstat -etna |wc -l


Then you will get the number of active TCP connections to the machine and based on that you can get an idea on how busy the server is.

But what if you have to deal with lets say a Microsoft Windows 2012 /2019 / 2020 or 2022 Server, assuming you logged in as Administrator and you see the machine is quite loaded and runs multiple Native Windows Administrator common services such as IIS / Active directory Failover Clustering, Proxy server etc.
How can you identify the established number of connections via a simple command in cmd.exe?

1.Count ESTABLISHED TCP connections from Windows Command Line

Here is the answer, simply use netstat native windows command and combine it with find, like that and use the /i (ignores the case of characters when searching the string) /c (count lines containing the string) options

C:\Windows\system32>netstat -p TCP -n|  find /i "ESTABLISHED" /c
1268

Voila, here are number of established connections, only 1268 that is relatively low.
However if you manage Windows servers, and you get some kind of hang ups as part of the monitoring, it is a good idea to setup a script based on this simple command for at least Windows Task Scheduler (the equivallent of Linux's crond service) to log for Peaks in Established connections to see whether Server crashes are not related to High Rise in established connections.
Even better if company uses Zabbix / Nagios, OpenNMS or other  old legacy monitoring stuff like Joschyd even as of today 2024 used in some big of the TOP IT companies such as SAP (they were still using it about 4 years ago for their SAP HANA Cloud), you can set the script to run and do a Monitoring template or Alerting rules to draw you graphs and Trigger Alerts if your connections hits a peak, then you at least might know your Windows server is under a "Hackers" Denial of Service attack or there is something happening on the network, like Cisco Network Infrastructure Switch flappings or whatever.

Perhaps an example script you can use if you decide to implement the little nestat established connection checks Monitoring in Zabbix is the one i've writen about in the previous article "Calculate established connection from IP address with shell script and log to zabbix graphic".

2. Few Useful netstat options for the Windows system admin
 

C:\Windows\System32> netstat -bona


netstat-useful-arguments-for-the-windows-system-administrator

Cmd.exe will lists executable files, local and external IP addresses and ports, and the state in list form. You immediately see which programs have created connections or are listening so that you can find offenders quickly.

b – displays the executable involved in  creating the connection.
o – displays the owning process ID.
n – displays address and port numbers.
a – displays all connections and listening ports.

As you can see in the screenshot, by using netstat -bona you get which process has binded to which local address and the Process ID PID of it, that is pretty useful in debugging stuff.

3. Use a Third Party GUI tool to debug more interactively connection issues

If you need to keep an eye in interactive mode, sometimes if there are issues CurrPorts tool can be of a great help

currports-windows-network-connections-diagnosis-cports

CurrPorts Tool own Description

CurrPorts is network monitoring software that displays the list of all currently opened TCP/IP and UDP ports on your local computer. For each port in the list, information about the process that opened the port is also displayed, including the process name, full path of the process, version information of the process (product name, file description, and so on), the time that the process was created, and the user that created it.
In addition, CurrPorts allows you to close unwanted TCP connections, kill the process that opened the ports, and save the TCP/UDP ports information to HTML file , XML file, or to tab-delimited text file.
CurrPorts also automatically mark with pink color suspicious TCP/UDP ports owned by unidentified applications (Applications without version information and icons).

Sum it up

What we learned is how to calculate number of established TCP connections from command line, useful for scripting, how you can use netstat to display the process ID and Process name that relates to a used Local / Remote TCP connections, and how eventually you can use this to connect it to some monitoring tool to periodically report High Peaks with TCP established connections (usually an indicator of servere system issues).
 

Monitoring network traffic tools to debug network issues in console interactively on Linux

Thursday, December 14th, 2023

transport-layer-fourth-layer-data-transport-diagram


In my last article Debugging and routing network issues on Linux (common approaches), I've given some step by step methology on how to debug a network routing or unreachability issues between network hosts. As the article was mostly targetting a command line tools that can help debugging the network without much interactivity. I've decided to blog of a few other tools that might help the system administrator to debug network issues by using few a bit more interactive tools. Throughout the years of managing multitude of Linux based laptops and servers, as well as being involved in security testing and penetration in the past, these tools has always played an important role and are worthy to be well known and used by any self respecting sys admin or network security expert that has to deal with Linux and *Unix operating systems.
 

1. Debugging what is going on on a network level interactively with iptraf-ng

Historically iptraf and today's iptraf is also a great tool one can use to further aid the arsenal debug a network issue or Protocol problem, failure of packets or network interaction issues SYN -> ACK etc. proto interactions and check for Flag states and packets flow.

To use iptraf-ng which is a ncurses based tool just install it and launch it and select the interface you would like to debug trafic on.

To install On Debians distros

# apt install iptraf-ng –yes

# iptraf-ng


iptraf-ng-linux-select-interface-screen
 

iptraf-ng-listen-all-interfaces-check-tcp-flags-and-packets


Session-Layer-in-OSI-Model-diagram
 

2. Use hackers old tool sniffit to monitor current ongoing traffic and read plain text messages

Those older who remember the rise of Linux to the masses, should remember sniffit was a great tool to snoop for traffic on the network.

root@pcfreak:~# apt-cache show sniffit|grep -i description -A 10 -B10
Package: sniffit
Version: 0.5-1
Installed-Size: 139
Maintainer: Joao Eriberto Mota Filho <eriberto@debian.org>
Architecture: amd64
Depends: libc6 (>= 2.14), libncurses6 (>= 6), libpcap0.8 (>= 0.9.8), libtinfo6 (>= 6)
Description-en: packet sniffer and monitoring tool
 Sniffit is a packet sniffer for TCP/UDP/ICMP packets over IPv4. It is able
 to give you a very detailed technical info on these packets, as SEQ, ACK,
 TTL, Window, etc. The packet contents also can be viewed, in different
 formats (hex or plain text, etc.).
 .
 Sniffit is based in libpcap and is useful when learning about computer
 networks and their security.
Description-md5: 973beeeaadf4c31bef683350f1346ee9
Homepage: https://github.com/resurrecting-open-source-projects/sniffit
Tag: interface::text-mode, mail::notification, role::program, scope::utility,
 uitoolkit::ncurses, use::monitor, use::scanning, works-with::mail,
 works-with::network-traffic
Section: net
Priority: optional
Filename: pool/main/s/sniffit/sniffit_0.5-1_amd64.deb
Size: 61796
MD5sum: ea4cc0bc73f9e94d5a3c1ceeaa485ee1
SHA256: 7ec76b62ab508ec55c2ef0ecea952b7d1c55120b37b28fb8bc7c86645a43c485


Sniffit is not installed by default on deb distros, so to give it a try install it

# apt install sniffit –yes
# sniffit


sniffit-linux-check-tcp-traffic-screenshot
 

3. Use bmon to monitor bandwidth and any potential traffic losses and check qdisc pfifo
Linux network stack queues


root@pcfreak:~# apt-cache show bmon |grep -i description
Description-en: portable bandwidth monitor and rate estimator
Description-md5: 3288eb0a673978e478042369c7927d3f
root@pcfreak:~# apt-cache show bmon |grep -i description -A 10 -B10
Package: bmon
Version: 1:4.0-7
Installed-Size: 146
Maintainer: Patrick Matthäi <pmatthaei@debian.org>
Architecture: amd64
Depends: libc6 (>= 2.17), libconfuse2 (>= 3.2.1~), libncursesw6 (>= 6), libnl-3-200 (>= 3.2.7), libnl-route-3-200 (>= 3.2.7), libtinfo6 (>= 6)
Description-en: portable bandwidth monitor and rate estimator
 bmon is a commandline bandwidth monitor which supports various output
 methods including an interactive curses interface, lightweight HTML output but
 also simple ASCII output.
 .
 Statistics may be distributed over a network using multicast or unicast and
 collected at some point to generate a summary of statistics for a set of
 nodes.
Description-md5: 3288eb0a673978e478042369c7927d3f
Homepage: http://www.infradead.org/~tgr/bmon/
Tag: implemented-in::c, interface::text-mode, network::scanner,
 role::program, scope::utility, uitoolkit::ncurses, use::monitor,
 works-with::network-traffic
Section: net
Priority: optional
Filename: pool/main/b/bmon/bmon_4.0-7_amd64.deb
Size: 47348
MD5sum: c210f8317eafa22d9e3a8fb8316e0901
SHA256: 21730fc62241aee827f523dd33c458f4a5a7d4a8cf0a6e9266a3e00122d80645


root@pcfreak:~# apt install bmon –yes

root@pcfreak:~# bmon

bmon_monitor_qdisc-network-stack-bandwidth-on-linux

4. Use nethogs net diagnosis text interactive tool

NetHogs is a small 'net top' tool. 
Instead of breaking the traffic down per protocol or per subnet, like most tools do, it groups bandwidth by process.
 

root@pcfreak:~# apt-cache show nethogs|grep -i description -A10 -B10
Package: nethogs
Source: nethogs (0.8.5-2)
Version: 0.8.5-2+b1
Installed-Size: 79
Maintainer: Paulo Roberto Alves de Oliveira (aka kretcheu) <kretcheu@gmail.com>
Architecture: amd64
Depends: libc6 (>= 2.15), libgcc1 (>= 1:3.0), libncurses6 (>= 6), libpcap0.8 (>= 0.9.8), libstdc++6 (>= 5.2), libtinfo6 (>= 6)
Description-en: Net top tool grouping bandwidth per process
 NetHogs is a small 'net top' tool. Instead of breaking the traffic down per
 protocol or per subnet, like most tools do, it groups bandwidth by process.
 NetHogs does not rely on a special kernel module to be loaded.
Description-md5: 04c153c901ad7ca75e53e2ae32565ccd
Homepage: https://github.com/raboof/nethogs
Tag: admin::monitoring, implemented-in::c++, role::program,
 uitoolkit::ncurses, use::monitor, works-with::network-traffic
Section: net
Priority: optional
Filename: pool/main/n/nethogs/nethogs_0.8.5-2+b1_amd64.deb
Size: 30936
MD5sum: 500047d154a1fcde5f6eacaee45148e7
SHA256: 8bc69509f6a8c689bf53925ff35a5df78cf8ad76fff176add4f1530e66eba9dc

root@pcfreak:~# apt install nethogs –yes

# nethogs


nethogs-tool-screenshot-show-user-network--traffic-by-process-name-ID

5;.Use iftop –  to display network interface usage


root@pcfreak:~# apt-cache show iftop |grep -i description -A10 -B10
Package: iftop
Version: 1.0~pre4-7
Installed-Size: 97
Maintainer: Markus Koschany <apo@debian.org>
Architecture: amd64
Depends: libc6 (>= 2.29), libncurses6 (>= 6), libpcap0.8 (>= 0.9.8), libtinfo6 (>= 6)
Description-en: displays bandwidth usage information on an network interface
 iftop does for network usage what top(1) does for CPU usage. It listens to
 network traffic on a named interface and displays a table of current bandwidth
 usage by pairs of hosts. Handy for answering the question "Why is my Internet
 link so slow?".
Description-md5: f7e93593aba6acc7b5a331b49f97466f
Homepage: http://www.ex-parrot.com/~pdw/iftop/
Tag: admin::monitoring, implemented-in::c, interface::text-mode,
 role::program, scope::utility, uitoolkit::ncurses, use::monitor,
 works-with::network-traffic
Section: net
Priority: optional
Filename: pool/main/i/iftop/iftop_1.0~pre4-7_amd64.deb
Size: 42044
MD5sum: c9bb9c591b70753880e455f8dc416e0a
SHA256: 0366a4e54f3c65b2bbed6739ae70216b0017e2b7421b416d7c1888e1f1cb98b7


root@pcfreak:~# apt install –yes iftop

iftop-interactive-network-traffic-output-linux-screenshot


6. Ettercap (tool) to active and passive dissect network protocols for in depth network and host analysis

root@pcfreak:/var/www/images# apt-cache show ettercap-common|grep -i description -A10 -B10
Package: ettercap-common
Source: ettercap
Version: 1:0.8.3.1-3
Installed-Size: 2518
Maintainer: Debian Security Tools <team+pkg-security@tracker.debian.org>
Architecture: amd64
Depends: ethtool, geoip-database, libbsd0 (>= 0.0), libc6 (>= 2.14), libcurl4 (>= 7.16.2), libgeoip1 (>= 1.6.12), libluajit-5.1-2 (>= 2.0.4+dfsg), libnet1 (>= 1.1.6), libpcap0.8 (>= 0.9.8), libpcre3, libssl1.1 (>= 1.1.1), zlib1g (>= 1:1.1.4)
Recommends: ettercap-graphical | ettercap-text-only
Description-en: Multipurpose sniffer/interceptor/logger for switched LAN
 Ettercap supports active and passive dissection of many protocols
 (even encrypted ones) and includes many feature for network and host
 analysis.
 .
 Data injection in an established connection and filtering (substitute
 or drop a packet) on the fly is also possible, keeping the connection
 synchronized.
 .
 Many sniffing modes are implemented, for a powerful and complete
 sniffing suite. It is possible to sniff in four modes: IP Based, MAC Based,
 ARP Based (full-duplex) and PublicARP Based (half-duplex).
 .
 Ettercap also has the ability to detect a switched LAN, and to use OS
 fingerprints (active or passive) to find the geometry of the LAN.
 .
 This package contains the Common support files, configuration files,
 plugins, and documentation.  You must also install either
 ettercap-graphical or ettercap-text-only for the actual GUI-enabled
 or text-only ettercap executable, respectively.
Description-md5: f1d894b138f387661d0f40a8940fb185
Homepage: https://ettercap.github.io/ettercap/
Tag: interface::text-mode, network::scanner, role::app-data, role::program,
 uitoolkit::ncurses, use::scanning
Section: net
Priority: optional
Filename: pool/main/e/ettercap/ettercap-common_0.8.3.1-3_amd64.deb
Size: 734972
MD5sum: 403d87841f8cdd278abf20bce83cb95e
SHA256: 500aee2f07e0fae82489321097aee8a97f9f1970f6e4f8978140550db87e4ba9


root@pcfreak:/ # apt install ettercap-text-only –yes

root@pcfreak:/ # ettercap -C


ettercap-text-interface-unified-sniffing-screenshot-linux

7. iperf and netperf to measure connecitivity speed on Network LAN and between Linux server hosts

iperf and netperf are two very handy tools to measure the speed of a network and various aspects of the bandwidth. It is mostly useful when designing network infrastructure or building networks from scratch.
 

If you never used netperf in the past here is a description from man netperf

NAME
       netperf – a network performance benchmark

SYNOPSIS
       netperf [global options] — [test specific options]

DESCRIPTION
       Netperf  is  a benchmark that can be used to measure various aspects of
       networking performance.  Currently, its focus is on bulk data  transfer
       and  request/response  performance  using  either  TCP  or UDP, and the
       Berkeley Sockets interface. In addition, tests for DLPI, and  Unix  Do‐
       main Sockets, tests for IPv6 may be conditionally compiled-in.


root@freak:~# netperf
MIGRATED TCP STREAM TEST from 0.0.0.0 (0.0.0.0) port 0 AF_INET to localhost () port 0 AF_INET : demo
Recv   Send    Send
Socket Socket  Message  Elapsed
Size   Size    Size     Time     Throughput
bytes  bytes   bytes    secs.    10^6bits/sec

 87380  65536  65536    10.00    17669.96


Testing UDP network throughput using NetPerf

Change the test name from TCP_STREAM to UDP_STREAM. Let’s use 1024 (1MB) as the message size to be sent by the client.
If you receive the following error send_data: data send error: Network is unreachable (errno 101) netperf: send_omni:

send_data failed: Network is unreachable, add option -R 1 to remove the iptable rule that prohibits NetPerf UDP flow.

$ netperf -H 172.31.56.48 -t UDP_STREAM -l 300 — -R 1 -m 1024
MIGRATED UDP STREAM TEST from 0.0.0.0 (0.0.0.0) port 0 AF_INET to 172.31.56.48 () port 0 AF_INET
Socket Message Elapsed Messages
Size Size Time Okay Errors Throughput
bytes bytes secs # # 10^6bits/sec

212992 1024 300.00 9193386 0 251.04
212992 300.00 9131380 249.35

UDP Throughput in a WAN

$ netperf -H HOST -t UDP_STREAM -l 300 — -R 1 -m 1024
MIGRATED UDP STREAM TEST from (null) (0.0.0.0) port 0 AF_INET to (null) () port 0 AF_INET : histogram : spin interval
Socket Message Elapsed Messages
Size Size Time Okay Errors Throughput
bytes bytes secs # # 10^6bits/sec

9216 1024 300.01 35627791 0 972.83
212992 300.01 253099 6.91


Testing TCP throughput using iPerf


Here is a short description of iperf

NAME
       iperf – perform network throughput tests

SYNOPSIS
       iperf -s [options]

       iperf -c server [options]

       iperf -u -s [options]

       iperf -u -c server [options]

DESCRIPTION
       iperf  2  is  a tool for performing network throughput and latency mea‐
       surements. It can test using either TCP or UDP protocols.  It  supports
       both  unidirectional  and  bidirectional traffic. Multiple simultaneous
       traffic streams are also supported. Metrics are displayed to help  iso‐
       late the causes which impact performance. Setting the enhanced (-e) op‐
       tion provides all available metrics.

       The user must establish both a both a server (to discard traffic) and a
       client (to generate traffic) for a test to occur. The client and server
       typically are on different hosts or computers but need not be.


Run iPerf3 as server on the server:

$ iperf3 –server –interval 30
———————————————————–
Server listening on 5201
———————————————————–


Test TCP Throughput in Local LAN


$ iperf3 –client 172.31.56.48 –time 300 –interval 30
Connecting to host 172.31.56.48, port 5201
[ 4] local 172.31.100.5 port 44728 connected to 172.31.56.48 port 5201
[ ID] Interval Transfer Bandwidth Retr Cwnd
[ 4] 0.00-30.00 sec 1.70 GBytes 488 Mbits/sec 138 533 KBytes
[ 4] 30.00-60.00 sec 260 MBytes 72.6 Mbits/sec 19 489 KBytes
[ 4] 60.00-90.00 sec 227 MBytes 63.5 Mbits/sec 15 542 KBytes
[ 4] 90.00-120.00 sec 227 MBytes 63.3 Mbits/sec 13 559 KBytes
[ 4] 120.00-150.00 sec 228 MBytes 63.7 Mbits/sec 16 463 KBytes
[ 4] 150.00-180.00 sec 227 MBytes 63.4 Mbits/sec 13 524 KBytes
[ 4] 180.00-210.00 sec 227 MBytes 63.5 Mbits/sec 14 559 KBytes
[ 4] 210.00-240.00 sec 227 MBytes 63.5 Mbits/sec 14 437 KBytes
[ 4] 240.00-270.00 sec 228 MBytes 63.7 Mbits/sec 14 516 KBytes
[ 4] 270.00-300.00 sec 227 MBytes 63.5 Mbits/sec 14 524 KBytes
– – – – – – – – – – – – – – – – – – – – – – – – –
[ ID] Interval Transfer Bandwidth Retr
[ 4] 0.00-300.00 sec 3.73 GBytes 107 Mbits/sec 270 sender
[ 4] 0.00-300.00 sec 3.73 GBytes 107 Mbits/sec receiver

Test TCP Throughput in a WAN Network

$ iperf3 –client HOST –time 300 –interval 30
Connecting to host HOST, port 5201
[ 5] local 192.168.1.73 port 56756 connected to HOST port 5201
[ ID] Interval Transfer Bitrate
[ 5] 0.00-30.00 sec 21.2 MBytes 5.93 Mbits/sec
[ 5] 30.00-60.00 sec 27.0 MBytes 7.55 Mbits/sec
[ 5] 60.00-90.00 sec 28.6 MBytes 7.99 Mbits/sec
[ 5] 90.00-120.00 sec 28.7 MBytes 8.02 Mbits/sec
[ 5] 120.00-150.00 sec 28.5 MBytes 7.97 Mbits/sec
[ 5] 150.00-180.00 sec 28.6 MBytes 7.99 Mbits/sec
[ 5] 180.00-210.00 sec 28.4 MBytes 7.94 Mbits/sec
[ 5] 210.00-240.00 sec 28.5 MBytes 7.97 Mbits/sec
[ 5] 240.00-270.00 sec 28.6 MBytes 8.00 Mbits/sec
[ 5] 270.00-300.00 sec 27.9 MBytes 7.81 Mbits/sec
– – – – – – – – – – – – – – – – – – – – – – – – –
[ ID] Interval Transfer Bitrate
[ 5] 0.00-300.00 sec 276 MBytes 7.72 Mbits/sec sender
[ 5] 0.00-300.00 sec 276 MBytes 7.71 Mbits/sec receiver


$ iperf3 –client 172.31.56.48 –interval 30 -u -b 100MB
Accepted connection from 172.31.100.5, port 39444
[ 5] local 172.31.56.48 port 5201 connected to 172.31.100.5 port 36436
[ ID] Interval Transfer Bandwidth Jitter Lost/Total Datagrams
[ 5] 0.00-30.00 sec 354 MBytes 98.9 Mbits/sec 0.052 ms 330/41774 (0.79%)
[ 5] 30.00-60.00 sec 355 MBytes 99.2 Mbits/sec 0.047 ms 355/41903 (0.85%)
[ 5] 60.00-90.00 sec 354 MBytes 98.9 Mbits/sec 0.048 ms 446/41905 (1.1%)
[ 5] 90.00-120.00 sec 355 MBytes 99.4 Mbits/sec 0.045 ms 261/41902 (0.62%)
[ 5] 120.00-150.00 sec 354 MBytes 99.1 Mbits/sec 0.048 ms 401/41908 (0.96%)
[ 5] 150.00-180.00 sec 353 MBytes 98.7 Mbits/sec 0.047 ms 530/41902 (1.3%)
[ 5] 180.00-210.00 sec 353 MBytes 98.8 Mbits/sec 0.059 ms 496/41904 (1.2%)
[ 5] 210.00-240.00 sec 354 MBytes 99.0 Mbits/sec 0.052 ms 407/41904 (0.97%)
[ 5] 240.00-270.00 sec 351 MBytes 98.3 Mbits/sec 0.059 ms 725/41903 (1.7%)
[ 5] 270.00-300.00 sec 354 MBytes 99.1 Mbits/sec 0.043 ms 393/41908 (0.94%)
– – – – – – – – – – – – – – – – – – – – – – – – –
[ ID] Interval Transfer Bandwidth Jitter Lost/Total Datagrams
[ 5] 0.00-300.04 sec 3.45 GBytes 98.94 Mbits/sec 0.043 ms 4344/418913 (1%)

UDP Throughput in a WAN

$ iperf3 –client HOST –time 300 -u -b 7.7MB
Accepted connection from 45.29.190.145, port 60634
[ 5] local 172.31.56.48 port 5201 connected to 45.29.190.145 port 52586
[ ID] Interval Transfer Bandwidth Jitter Lost/Total Datagrams
[ 5] 0.00-30.00 sec 27.4 MBytes 7.67 Mbits/sec 0.438 ms 64/19902 (0.32%)
[ 5] 30.00-60.00 sec 27.5 MBytes 7.69 Mbits/sec 0.446 ms 35/19940 (0.18%)
[ 5] 60.00-90.00 sec 27.5 MBytes 7.68 Mbits/sec 0.384 ms 39/19925 (0.2%)
[ 5] 90.00-120.00 sec 27.5 MBytes 7.68 Mbits/sec 0.528 ms 70/19950 (0.35%)
[ 5] 120.00-150.00 sec 27.4 MBytes 7.67 Mbits/sec 0.460 ms 51/19924 (0.26%)
[ 5] 150.00-180.00 sec 27.5 MBytes 7.69 Mbits/sec 0.485 ms 37/19948 (0.19%)
[ 5] 180.00-210.00 sec 27.5 MBytes 7.68 Mbits/sec 0.572 ms 49/19941 (0.25%)
[ 5] 210.00-240.00 sec 26.8 MBytes 7.50 Mbits/sec 0.800 ms 443/19856 (2.2%)
[ 5] 240.00-270.00 sec 27.4 MBytes 7.66 Mbits/sec 0.570 ms 172/20009 (0.86%)
[ 5] 270.00-300.00 sec 25.3 MBytes 7.07 Mbits/sec 0.423 ms 1562/19867 (7.9%)
– – – – – – – – – – – – – – – – – – – – – – – – –
[ ID] Interval Transfer Bandwidth Jitter Lost/Total Datagrams
[ 5] 0.00-300.00 sec 272 MBytes 7.60 Mbits/sec 0.423 ms 2522/199284 (1.3%)
[SUM] 0.0-300.2 sec 31 datagrams received out-of-order


Sum it up what learned


Debugging network issues and snooping on a Local LAN (DMZ) network on a server or home LAN is useful  to debug for various network issues and more importantly track and know abou tsecurity threads such as plain text passowd communication via insecure protocols a failure of proper communication between Linux network nodes at times, or simply to get a better idea on what kind of network is your new purchased dedicated server living in .It can help you also strenghten your security and close up any possible security holes, or even help you start thinking like a security intruder (cracker / hacker) would do. In this article we went through few of my favourite tools I use for many years quite often. These tools are just part of the tons of useful *Unix free tools available to do a network debug. Tools mentioned up are worthy to install on every server you have to administratrate or even your home desktop PCs, these are iptraf, sniffit, iftop, bmon, nethogs, nmon, ettercap, iperf and netperf.
 If you have some other useful tools used on Linux sys admin tasks please share, I'll be glad to know it and put them in my arsenal of used tools.

Enjoy ! 🙂

Configure aide file integrity check server monitoring in Zabbix to track for file changes on servers

Tuesday, March 28th, 2023

zabbix-aide-log-monitoring-logo

Earlier I've written a small article on how to setup AIDE monitoring for Server File integrity check on Linux, which put the basics on how this handy software to improve your server overall Security software can be installed and setup without much hassle.

Once AIDE is setup and a preset custom configuration is prepared for AIDE it is pretty useful to configure AIDE to monitor its critical file changes for better server security by monitoring the AIDE log output for new record occurs with Zabbix. Usually if no files monitored by AIDE are modified on the machine, the log size will not grow, but if some file is modified once Advanced Linux Intrusion Detecting (aide) binary runs via the scheduled Cron job, the /var/log/app_aide.log file will grow zabbix-agentd will continuously check the file for size increases and will react.

Before setting up the Zabbix required Template, you will have to set few small scripts that will be reading a preconfigured list of binaries or application files etc. that aide will monitor lets say via /etc/aide-custom.conf
 

1. Configure aide to monitor files for changes


Before running aide, it is a good idea to prepare a file with custom defined directories and files that you plan to monitor for integrity checking e.g. future changes with aide, for example to capture bad intruders who breaks into server which runs aide and modifies critical files such as /etc/passwd /etc/shadow /etc/group or / /usr/local/etc/* or /var/* / /usr/* critical files that shouldn't be allowed to change without the admin to soon find out.

# cat /etc/aide-custom.conf

# Example configuration file for AIDE.
@@define DBDIR /var/lib/aide
@@define LOGDIR /var/log/aide
# The location of the database to be read.
database=file:@@{DBDIR}/app_custom.db.gz
database_out=file:@@{DBDIR}/app_aide.db.new.gz
gzip_dbout=yes
verbose=5

report_url=file:@@{LOGDIR}/app_custom.log
#report_url=syslog:LOG_LOCAL2
#report_url=stderr
#NOT IMPLEMENTED report_url=mailto:root@foo.com
#NOT IMPLEMENTED report_url=syslog:LOG_AUTH

# These are the default rules.
#
#p:      permissions
#i:      inode:
#n:      number of links
#u:      user
#g:      group
#s:      size
#b:      block count
#m:      mtime
#a:      atime
#c:      ctime
#S:      check for growing size
#acl:           Access Control Lists
#selinux        SELinux security context
#xattrs:        Extended file attributes
#md5:    md5 checksum
#sha1:   sha1 checksum
#sha256:        sha256 checksum
#sha512:        sha512 checksum
#rmd160: rmd160 checksum
#tiger:  tiger checksum

#haval:  haval checksum (MHASH only)
#gost:   gost checksum (MHASH only)
#crc32:  crc32 checksum (MHASH only)
#whirlpool:     whirlpool checksum (MHASH only)

FIPSR = p+i+n+u+g+s+m+c+acl+selinux+xattrs+sha256

#R:             p+i+n+u+g+s+m+c+acl+selinux+xattrs+md5
#L:             p+i+n+u+g+acl+selinux+xattrs
#E:             Empty group
#>:             Growing logfile p+u+g+i+n+S+acl+selinux+xattrs

# You can create custom rules like this.
# With MHASH…
# ALLXTRAHASHES = sha1+rmd160+sha256+sha512+whirlpool+tiger+haval+gost+crc32
ALLXTRAHASHES = sha1+rmd160+sha256+sha512+tiger
# Everything but access time (Ie. all changes)
EVERYTHING = R+ALLXTRAHASHES

# Sane, with multiple hashes
# NORMAL = R+rmd160+sha256+whirlpool
NORMAL = FIPSR+sha512

# For directories, don't bother doing hashes
DIR = p+i+n+u+g+acl+selinux+xattrs

# Access control only
PERMS = p+i+u+g+acl+selinux

# Logfile are special, in that they often change
LOG = >

# Just do sha256 and sha512 hashes
LSPP = FIPSR+sha512

# Some files get updated automatically, so the inode/ctime/mtime change
# but we want to know when the data inside them changes
DATAONLY =  p+n+u+g+s+acl+selinux+xattrs+sha256

##############TOUPDATE
#To delegate to app team create a file like /app/aide.conf
#and uncomment the following line
#@@include /app/aide.conf
#Then remove all the following lines
/etc/zabbix/scripts/check.sh FIPSR
/etc/zabbix/zabbix_agentd.conf FIPSR
/etc/sudoers FIPSR
/etc/hosts FIPSR
/etc/keepalived/keepalived.conf FIPSR
# monitor haproxy.cfg
/etc/haproxy/haproxy.cfg FIPSR
# monitor keepalived
/home/keepalived/.ssh/id_rsa FIPSR
/home/keepalived/.ssh/id_rsa.pub FIPSR
/home/keepalived/.ssh/authorized_keys FIPSR

/usr/local/bin/script_to_run.sh FIPSR
/usr/local/bin/another_script_to_monitor_for_changes FIPSR

#  cat /usr/local/bin/aide-config-check.sh
#!/bin/bash
/sbin/aide -c /etc/aide-custom.conf -D

# cat /usr/local/bin/aide-init.sh
#!/bin/bash
/sbin/aide -c /etc/custom-aide.conf -B database_out=file:/var/lib/aide/custom-aide.db.gz -i


# cat /usr/local/bin/aide-check.sh

#!/bin/bash
/sbin/aide -c /etc/custom-aide.conf -Breport_url=stdout -B database=file:/var/lib/aide/custom-aide.db.gz -C|/bin/tee -a /var/log/aide/custom-aide-check.log|/bin/logger -t custom-aide-check-report
/usr/local/bin/aide-init.sh


# cat /usr/local/bin/aide_app_cron_daily.txt

#!/bin/bash
#If first time, we need to init the DB
if [ ! -f /var/lib/aide/app_aide.db.gz ]
   then
    logger -p local2.info -t app-aide-check-report  "Generating NEW AIDE DATABASE for APPLICATION"
    nice -n 18 /sbin/aide –init -c /etc/aide_custom.conf
    mv /var/lib/aide/app_aide.db.new.gz /var/lib/aide/app_aide.db.gz
fi

nice -n 18 /sbin/aide –update -c /etc/aide_app.conf
#since the option for syslog seems not fully implemented we need to push logs via logger
/bin/logger -f /var/log/aide/app_aide.log -p local2.info -t app-aide-check-report
#Acknoledge the new database as the primary (every results are sended to syslog anyway)
mv /var/lib/aide/app_aide.db.new.gz /var/lib/aide/app_aide.db.gz

What above cron job does is pretty simple, as you can read it yourself. If the configuration predefined aide database store file /var/lib/aide/app_aide.db.gz, does not
exists aide will create its fresh empty database and generate a report for all predefined files with respective checksums to be stored as a comparison baseline for file changes. 

Next there is a line to write aide file changes via rsyslog through the logger and local2.info handler


2. Setup Zabbix Template with Items, Triggers and set Action

2.1 Create new Template and name it YourAppName APP-LB File integrity Check

aide-itengrity-check-zabbix_ Configuration of templates

Then setup the required Items, that will be using zabbix's Skip embedded function to scan file in a predefined period of file, this is done by the zabbix-agent that is
supposed to run on the server.

2.2 Configure Item like

aide-zabbix-triggers-screenshot
 

*Name: check aide log file

Type: zabbix (active)

log[/var/log/aide/app_aide.log,^File.*,,,skip]

Type of information: Log

Update Interval: 30s

Applications: File Integrity Check

Configure Trigger like

Enabled: Tick On

images/aide-zabbix-screenshots/check-aide-log-item


2.3 Create Triggers with the respective regular expressions, that would check the aide generated log file for file modifications


aide-zabbix-screenshot-minor-config

Configure Trigger like
 

Enabled: Tick On


*Name: Someone modified {{ITEM.VALUE}.regsub("(.*)", \1)}

*Expression: {PROD APP-LB File Integrity Check:log[/var/log/aide/app_aide.log,^File.*,,,skip].strlen()}>=1

Allow manual close: yes tick

*Description: Someone modified {{ITEM.VALUE}.regsub("(.*)", \1)} on {HOST.NAME}


2.4 Configure Action


aide-zabbix-file-monitoring-action-screensho

Now assuming the Zabbix server has  a properly set media for communication and you set Alerting rules zabbix-server can be easily set tosend mails to a Support email to get Notifications Alerts, everytime a monitored file by aide gets changed.

That's all folks ! Enjoy being notified on every file change on your servers  !
 

How to monitor Haproxy Application server backends with Zabbix userparameter autodiscovery scripts

Friday, May 13th, 2022

zabbix-backend-monitoring-logo

Haproxy is doing quite a good job in High Availability tasks where traffic towards multiple backend servers has to be redirected based on the available one to sent data from the proxy to. 

Lets say haproxy is configured to proxy traffic for App backend machine1 and App backend machine2.

Usually in companies people configure a monitoring like with Icinga or Zabbix / Grafana to keep track on the Application server is always up and running. Sometimes however due to network problems (like burned Network Switch / router or firewall misconfiguration) or even an IP duplicate it might happen that Application server seems to be reporting reachable from some monotoring tool on it but unreachable from  Haproxy server -> App backend machine2 but reachable from App backend machine1. And even though haproxy will automatically switch on the traffic from backend machine2 to App machine1. It is a good idea to monitor and be aware that one of the backends is offline from the Haproxy host.
In this article I'll show you how this is possible by using 2 shell scripts and userparameter keys config through the autodiscovery zabbix legacy feature.
Assumably for the setup to work you will need to have as a minimum a Zabbix server installation of version 5.0 or higher.

1. Create the required  haproxy_discovery.sh  and haproxy_stats.sh scripts 

You will have to install the two scripts under some location for example we can put it for more clearness under /etc/zabbix/scripts

[root@haproxy-server1 ]# mkdir /etc/zabbix/scripts

[root@haproxy-server1 scripts]# vim haproxy_discovery.sh 
#!/bin/bash
#
# Get list of Frontends and Backends from HAPROXY
# Example: ./haproxy_discovery.sh [/var/lib/haproxy/stats] FRONTEND|BACKEND|SERVERS
# First argument is optional and should be used to set location of your HAPROXY socket
# Second argument is should be either FRONTEND, BACKEND or SERVERS, will default to FRONTEND if not set
#
# !! Make sure the user running this script has Read/Write permissions to that socket !!
#
## haproxy.cfg snippet
#  global
#  stats socket /var/lib/haproxy/stats  mode 666 level admin

HAPROXY_SOCK=""/var/run/haproxy/haproxy.sock
[ -n “$1” ] && echo $1 | grep -q ^/ && HAPROXY_SOCK="$(echo $1 | tr -d '\040\011\012\015')"

if [[ “$1” =~ (25[0-5]|2[0-4][0-9]|[01]?[0-9][0-9]?)\.(25[0-5]|2[0-4][0-9]|[01]?[0-9][0-9]?)\.(25[0-5]|2[0-4][0-9]|[01]?[0-9][0-9]?)\.(25[0-5]|2[0-4][0-9]|[01]?[0-9][0-9]?):[0-9]{1,5} ]];
then
    HAPROXY_STATS_IP="$1"
    QUERYING_METHOD="TCP"
fi

QUERYING_METHOD="${QUERYING_METHOD:-SOCKET}"

query_stats() {
    if [[ ${QUERYING_METHOD} == “SOCKET” ]]; then
        echo "show stat" | socat ${HAPROXY_SOCK} stdio 2>/dev/null
    elif [[ ${QUERYING_METHOD} == “TCP” ]]; then
        echo "show stat" | nc ${HAPROXY_STATS_IP//:/ } 2>/dev/null
    fi
}

get_stats() {
        echo "$(query_stats)" | grep -v "^#"
}

[ -n “$2” ] && shift 1
case $1 in
        B*) END="BACKEND" ;;
        F*) END="FRONTEND" ;;
        S*)
                for backend in $(get_stats | grep BACKEND | cut -d, -f1 | uniq); do
                        for server in $(get_stats | grep "^${backend}," | grep -v BACKEND | grep -v FRONTEND | cut -d, -f2); do
                                serverlist="$serverlist,\n"'\t\t{\n\t\t\t"{#BACKEND_NAME}":"'$backend'",\n\t\t\t"{#SERVER_NAME}":"'$server'"}'
                        done
                done
                echo -e '{\n\t"data":[\n’${serverlist#,}’]}'
                exit 0
        ;;
        *) END="FRONTEND" ;;
esac

for frontend in $(get_stats | grep "$END" | cut -d, -f1 | uniq); do
    felist="$felist,\n"'\t\t{\n\t\t\t"{#'${END}'_NAME}":"'$frontend'"}'
done
echo -e '{\n\t"data":[\n’${felist#,}’]}'


[root@haproxy-server1 scripts]# vim haproxy_stats.sh 
#!/bin/bash
set -o pipefail

if [[ “$1” = /* ]]
then
  HAPROXY_SOCKET="$1"
  shift 0
else
  if [[ “$1” =~ (25[0-5]|2[0-4][0-9]|[01]?[0-9][0-9]?)\.(25[0-5]|2[0-4][0-9]|[01]?[0-9][0-9]?)\.(25[0-5]|2[0-4][0-9]|[01]?[0-9][0-9]?)\.(25[0-5]|2[0-4][0-9]|[01]?[0-9][0-9]?):[0-9]{1,5} ]];
  then
    HAPROXY_STATS_IP="$1"
    QUERYING_METHOD="TCP"
    shift 1
  fi
fi

pxname="$1"
svname="$2"
stat="$3"

DEBUG=${DEBUG:-0}
HAPROXY_SOCKET="${HAPROXY_SOCKET:-/var/run/haproxy/haproxy.sock}"
QUERYING_METHOD="${QUERYING_METHOD:-SOCKET}"
CACHE_STATS_FILEPATH="${CACHE_STATS_FILEPATH:-/var/tmp/haproxy_stats.cache}"
CACHE_STATS_EXPIRATION="${CACHE_STATS_EXPIRATION:-1}" # in minutes
CACHE_INFO_FILEPATH="${CACHE_INFO_FILEPATH:-/var/tmp/haproxy_info.cache}" ## unused
CACHE_INFO_EXPIRATION="${CACHE_INFO_EXPIRATION:-1}" # in minutes ## unused
GET_STATS=${GET_STATS:-1} # when you update stats cache outsise of the script
SOCAT_BIN="$(which socat)"
NC_BIN="$(which nc)"
FLOCK_BIN="$(which flock)"
FLOCK_WAIT=15 # maximum number of seconds that "flock" waits for acquiring a lock
FLOCK_SUFFIX='.lock'
CUR_TIMESTAMP="$(date '+%s')"

debug() {
  [ “${DEBUG}” -eq 1 ] && echo "DEBUG: $@" >&2 || true
}

debug "SOCAT_BIN        => $SOCAT_BIN"
debug "NC_BIN           => $NC_BIN"
debug "FLOCK_BIN        => $FLOCK_BIN"
debug "FLOCK_WAIT       => $FLOCK_WAIT seconds"
debug "CACHE_FILEPATH   => $CACHE_FILEPATH"
debug "CACHE_EXPIRATION => $CACHE_EXPIRATION minutes"
debug "HAPROXY_SOCKET   => $HAPROXY_SOCKET"
debug "pxname   => $pxname"
debug "svname   => $svname"
debug "stat     => $stat"

# check if socat is available in path
if [ “$GET_STATS” -eq 1 ] && [[ $QUERYING_METHOD == “SOCKET” && -z “$SOCAT_BIN” ]] || [[ $QUERYING_METHOD == “TCP” &&  -z “$NC_BIN” ]]
then
  echo 'ERROR: cannot find socat binary'
  exit 126
fi

# if we are getting stats:
#   check if we can write to stats cache file, if it exists
#     or cache file path, if it does not exist
#   check if HAPROXY socket is writable
# if we are NOT getting stats:
#   check if we can read the stats cache file
if [ “$GET_STATS” -eq 1 ]
then
  if [ -e “$CACHE_FILEPATH” ] && [ ! -w “$CACHE_FILEPATH” ]
  then
    echo 'ERROR: stats cache file exists, but is not writable'
    exit 126
  elif [ ! -w ${CACHE_FILEPATH%/*} ]
  then
    echo 'ERROR: stats cache file path is not writable'
    exit 126
  fi
  if [[ $QUERYING_METHOD == “SOCKET” && ! -w $HAPROXY_SOCKET ]]
  then
    echo "ERROR: haproxy socket is not writable"
    exit 126
  fi
elif [ ! -r “$CACHE_FILEPATH” ]
then
  echo 'ERROR: cannot read stats cache file'
  exit 126
fi

# index:name:default
MAP="
1:pxname:@
2:svname:@
3:qcur:9999999999
4:qmax:0
5:scur:9999999999
6:smax:0
7:slim:0
8:stot:@
9:bin:9999999999
10:bout:9999999999
11:dreq:9999999999
12:dresp:9999999999
13:ereq:9999999999
14:econ:9999999999
15:eresp:9999999999
16:wretr:9999999999
17:wredis:9999999999
18:status:UNK
19:weight:9999999999
20:act:9999999999
21:bck:9999999999
22:chkfail:9999999999
23:chkdown:9999999999
24:lastchg:9999999999
25:downtime:0
26:qlimit:0
27:pid:@
28:iid:@
29:sid:@
30:throttle:9999999999
31:lbtot:9999999999
32:tracked:9999999999
33:type:9999999999
34:rate:9999999999
35:rate_lim:@
36:rate_max:@
37:check_status:@
38:check_code:@
39:check_duration:9999999999
40:hrsp_1xx:@
41:hrsp_2xx:@
42:hrsp_3xx:@
43:hrsp_4xx:@
44:hrsp_5xx:@
45:hrsp_other:@
46:hanafail:@
47:req_rate:9999999999
48:req_rate_max:@
49:req_tot:9999999999
50:cli_abrt:9999999999
51:srv_abrt:9999999999
52:comp_in:0
53:comp_out:0
54:comp_byp:0
55:comp_rsp:0
56:lastsess:9999999999
57:last_chk:@
58:last_agt:@
59:qtime:0
60:ctime:0
61:rtime:0
62:ttime:0
"

_STAT=$(echo -e "$MAP" | grep :${stat}:)
_INDEX=${_STAT%%:*}
_DEFAULT=${_STAT##*:}

debug "_STAT    => $_STAT"
debug "_INDEX   => $_INDEX"
debug "_DEFAULT => $_DEFAULT"

# check if requested stat is supported
if [ -z “${_STAT}” ]
then
  echo "ERROR: $stat is unsupported"
  exit 127
fi

# method to retrieve data from haproxy stats
# usage:
# query_stats "show stat"
query_stats() {
    if [[ ${QUERYING_METHOD} == “SOCKET” ]]; then
        echo $1 | socat ${HAPROXY_SOCKET} stdio 2>/dev/null
    elif [[ ${QUERYING_METHOD} == “TCP” ]]; then
        echo $1 | nc ${HAPROXY_STATS_IP//:/ } 2>/dev/null
    fi
}

# a generic cache management function, that relies on 'flock'
check_cache() {
  local cache_type="${1}"
  local cache_filepath="${2}"
  local cache_expiration="${3}"  
  local cache_filemtime
  cache_filemtime=$(stat -c '%Y' "${cache_filepath}" 2> /dev/null)
  if [ $((cache_filemtime+60*cache_expiration)) -ge ${CUR_TIMESTAMP} ]
  then
    debug "${cache_type} file found, results are at most ${cache_expiration} minutes stale.."
  elif "${FLOCK_BIN}" –exclusive –wait "${FLOCK_WAIT}" 200
  then
    cache_filemtime=$(stat -c '%Y' "${cache_filepath}" 2> /dev/null)
    if [ $((cache_filemtime+60*cache_expiration)) -ge ${CUR_TIMESTAMP} ]
    then
      debug "${cache_type} file found, results have just been updated by another process.."
    else
      debug "no ${cache_type} file found, querying haproxy"
      query_stats "show ${cache_type}" > "${cache_filepath}"
    fi
  fi 200> "${cache_filepath}${FLOCK_SUFFIX}"
}

# generate stats cache file if needed
get_stats() {
  check_cache 'stat' "${CACHE_STATS_FILEPATH}" ${CACHE_STATS_EXPIRATION}
}

# generate info cache file
## unused at the moment
get_info() {
  check_cache 'info' "${CACHE_INFO_FILEPATH}" ${CACHE_INFO_EXPIRATION}
}

# get requested stat from cache file using INDEX offset defined in MAP
# return default value if stat is ""
get() {
  # $1: pxname/svname
  local _res="$("${FLOCK_BIN}" –shared –wait "${FLOCK_WAIT}" "${CACHE_STATS_FILEPATH}${FLOCK_SUFFIX}" grep $1 "${CACHE_STATS_FILEPATH}")"
  if [ -z “${_res}” ]
  then
    echo "ERROR: bad $pxname/$svname"
    exit 127
  fi
  _res="$(echo $_res | cut -d, -f ${_INDEX})"
  if [ -z “${_res}” ] && [[ “${_DEFAULT}” != “@” ]]
  then
    echo "${_DEFAULT}"  
  else
    echo "${_res}"
  fi
}

# not sure why we'd need to split on backslash
# left commented out as an example to override default get() method
# status() {
#   get "^${pxname},${svnamem}," $stat | cut -d\  -f1
# }

# this allows for overriding default method of getting stats
# name a function by stat name for additional processing, custom returns, etc.
if type get_${stat} >/dev/null 2>&1
then
  debug "found custom query function"
  get_stats && get_${stat}
else
  debug "using default get() method"
  get_stats && get "^${pxname},${svname}," ${stat}
fi


! NB ! Substitute in the script /var/run/haproxy/haproxy.sock with your haproxy socket location

You can download the haproxy_stats.sh here and haproxy_discovery.sh here

2. Create the userparameter_haproxy_backend.conf

[root@haproxy-server1 zabbix_agentd.d]# cat userparameter_haproxy_backend.conf 
#
# Discovery Rule
#

# HAProxy Frontend, Backend and Server Discovery rules
UserParameter=haproxy.list.discovery[*],sudo /etc/zabbix/scripts/haproxy_discovery.sh SERVER
UserParameter=haproxy.stats[*],sudo /etc/zabbix/scripts/haproxy_stats.sh  $2 $3 $4

# support legacy way

UserParameter=haproxy.stat.downtime[*],sudo /etc/zabbix/scripts/haproxy_stats.sh  $2 $3 downtime

UserParameter=haproxy.stat.status[*],sudo /etc/zabbix/scripts/haproxy_stats.sh  $2 $3 status

UserParameter=haproxy.stat.last_chk[*],sudo /etc/zabbix/scripts/haproxy_stats.sh  $2 $3 last_chk


3. Create new simple template for the Application backend Monitoring and link it to monitored host

create-configuration-template-backend-monitoring

create-template-backend-monitoring-macros


Go to Configuration -> Hosts (find the host) and Link the template to it


4. Restart Zabbix-agent, in while check autodiscovery data is in Zabbix Server

[root@haproxy-server1 ]# systemctl restart zabbix-agent


Check in zabbix the userparameter data arrives, it should not be required to add any Items or Triggers as autodiscovery zabbix feature should automatically create in the server what is required for the data regarding backends to be in.

To view data arrives go to Zabbix config menus:

Configuration -> Hosts -> Hosts: (lookup for the haproxy-server1 hostname)

zabbix-discovery_rules-screenshot

The autodiscovery should have automatically created the following prototypes

zabbix-items-monitoring-prototypes
Now if you look inside Latest Data for the Host you should find some information like:

HAProxy Backend [backend1] (3 Items)
        
HAProxy Server [backend-name_APP/server1]: Connection Response
2022-05-13 14:15:04            History
        
HAProxy Server [backend-name/server2]: Downtime (hh:mm:ss)
2022-05-13 14:13:57    20:30:42        History
        
HAProxy Server [bk_name-APP/server1]: Status
2022-05-13 14:14:25    Up (1)        Graph
        ccnrlb01    HAProxy Backend [bk_CCNR_QA_ZVT] (3 Items)
        
HAProxy Server [bk_name-APP3/server1]: Connection Response
2022-05-13 14:15:05            History
        
HAProxy Server [bk_name-APP3/server1]: Downtime (hh:mm:ss)
2022-05-13 14:14:00    20:55:20        History
        
HAProxy Server [bk_name-APP3/server2]: Status
2022-05-13 14:15:08    Up (1)

To make alerting in case if a backend is down which usually you would like only left thing is to configure an Action to deliver alerts to some email address.

How to redirect TCP port traffic from Internet Public IP host to remote local LAN server, Redirect traffic for Apache Webserver, MySQL, or other TCP service to remote host

Thursday, September 23rd, 2021


Linux-redirect-forward-tcp-ip-port-traffic-from-internet-to-remote-internet-LAN-IP-server-rinetd-iptables-redir


1. Use the good old times rinetd – internet “redirection server” service


Perhaps, many people who are younger wouldn't remember rinetd's use was pretty common on old Linuxes in the age where iptables was not on the scene and its predecessor ipchains was so common.
In the raise of mass internet rinetd started loosing its popularity because the service was exposed to the outer world and due to security holes and many exploits circulating the script kiddie communities
many servers get hacked "pwned" in the jargon of the script kiddies.

rinetd is still available even in modern Linuxes and over the last years I did not heard any severe security concerns regarding it, but the old paranoia perhaps and the set to oblivion makes it still unpopular soluttion for port redirect today in year 2021.
However for a local secured DMZ lans I can tell you that its use is mostly useful and I chooes to use it myself, everynow and then due to its simplicity to configure and use.
rinetd is pretty standard among unixes and is also available in old Sun OS / Solaris and BSD-es and pretty much everything on the Unix scene.

Below is excerpt from 'man rinetd':


DESCRIPTION
     rinetd redirects TCP connections from one IP address and port to another. rinetd is a single-process server which handles any number of connections to the address/port pairs
     specified in the file /etc/rinetd.conf.  Since rinetd runs as a single process using nonblocking I/O, it is able to redirect a large number of connections without a severe im‐
     pact on the machine. This makes it practical to run TCP services on machines inside an IP masquerading firewall. rinetd does not redirect FTP, because FTP requires more than
     one socket.
     rinetd is typically launched at boot time, using the following syntax:      /usr/sbin/rinetd      The configuration file is found in the file /etc/rinetd.conf, unless another file is specified using the -c command line option.

To use rinetd on any LInux distro you have to install and enable it with apt or yum as usual. For example on my Debian GNU / Linux home machine to use it I had to install .deb package, enable and start it it via systemd :


server:~# apt install –yes rinetd

server:~#  systemctl enable rinetd


server:~#  systemctl start rinetd


server:~#  systemctl status rinetd
● rinetd.service
   Loaded: loaded (/etc/init.d/rinetd; generated)
   Active: active (running) since Tue 2021-09-21 10:48:20 EEST; 2 days ago
     Docs: man:systemd-sysv-generator(8)
    Tasks: 1 (limit: 4915)
   Memory: 892.0K
   CGroup: /system.slice/rinetd.service
           └─1364 /usr/sbin/rinetd


rinetd is doing the traffic redirect via a separate process daemon, in order for it to function once you have service up check daemon is up as well.

root@server:/home/hipo# ps -ef|grep -i rinet
root       359     1  0 16:10 ?        00:00:00 /usr/sbin/rinetd
root       824 26430  0 16:10 pts/0    00:00:00 grep -i rinet

+ Configuring a new port redirect with rinetd


Is pretty straight forward everything is handled via one single configuration – /etc/rinetd.conf

The format (syntax) of a forwarding rule is as follows:

     [bindaddress] [bindport] [connectaddress] [connectport]


Besides that rinetd , could be used as a primitive firewall substitute to iptables, general syntax of allow deny an IP address is done with (allow, deny) keywords:
 

allow 192.168.2.*
deny 192.168.2.1?


To enable logging to external file ,you'll have to include in the configuration:

# logging information
logfile /var/log/rinetd.log

Here is an example rinetd.conf configuration, redirecting tcp mysql 3306, nginx on port 80 and a second web service frontend for ILO to server reachable via port 8888 and a redirect from External IP to local IP SMTP server.


#
# this is the configuration file for rinetd, the internet redirection server
#
# you may specify global allow and deny rules here
# only ip addresses are matched, hostnames cannot be specified here
# the wildcards you may use are * and ?
#
# allow 192.168.2.*
# deny 192.168.2.1?


#
# forwarding rules come here
#
# you may specify allow and deny rules after a specific forwarding rule
# to apply to only that forwarding rule
#
# bindadress    bindport  connectaddress  connectport


# logging information
logfile /var/log/rinetd.log
83.228.93.76        80            192.168.0.20       80
192.168.0.2        3306            192.168.0.19        3306
83.228.93.76        443            192.168.0.20       443
# enable for access to ILO
83.228.93.76        8888            192.168.1.25 443

127.0.0.1    25    192.168.0.19    25


83.228.93.76 is my external ( Public )  IP internet address where 192.168.0.20, 192.168.0.19, 192.168.0.20 (are the DMZ-ed Lan internal IPs) with various services.

To identify the services for which rinetd is properly configured to redirect / forward traffic you can see it with netstat or the newer ss command
 

root@server:/home/hipo# netstat -tap|grep -i rinet
tcp        0      0 www.pc-freak.net:8888   0.0.0.0:*               LISTEN      13511/rinetd      
tcp        0      0 www.pc-freak.n:http-alt 0.0.0.0:*               LISTEN      21176/rinetd        
tcp        0      0 www.pc-freak.net:443   0.0.0.0:*               LISTEN      21176/rinetd      


+ Using rinetd to redirect External interface IP to loopback's port (127.0.0.1)


If you have the need to redirect an External connectable living service be it apache mysql / privoxy / squid or whatever rinetd is perhaps the tool of choice (especially since there is no way to do it with iptables.

If you want to redirect all traffic which is accessed via Linux's loopback interface (localhost) to be reaching a remote host 11.5.8.1 on TCP port 1083 and 1888, use below config

# bindadress    bindport  connectaddress  connectport
11.5.8.1        1083            127.0.0.1       1083
11.5.8.1        1888            127.0.0.1       1888


For a quick and dirty solution to redirect traffic rinetd is very useful, however you'll have to keep in mind that if you want to redirect traffic for tens of thousands of connections constantly originating from the internet you might end up with some disconnects as well as notice a increased use of rinetd CPU use with the incrased number of forwarded connections.


2. Redirect TCP / IP port using DNAT iptables firewall rules


Lets say you have some proxy, webservice or whatever service running on port 5900 to be redirected with iptables.
The easeiest legacy way is to simply add the redirection rules to /etc/rc.local​. In newer Linuxes rc.local so if you decide to use,
you'll have to enable rc.local , I've written earlier a short article on how to enable rc.local on newer Debian, Fedora, CentOS


# redirect 5900 TCP service 
sysctl -w net.ipv4.conf.all.route_localnet=1
iptables -t nat -I PREROUTING -p tcp –dport 5900 -j REDIRECT –to-ports 5900
iptables -t nat -I OUTPUT -p tcp -o lo –dport 5900 -j REDIRECT –to-ports 5900
iptables -t nat -A OUTPUT -o lo -d 127.0.0.1 -p tcp –dport 5900 -j DNAT  –to-destination 192.168.1.8:5900
iptables -t nat -I OUTPUT –source 0/0 –destination 0/0 -p tcp –dport 5900 -j REDIRECT –to-ports 5900


Here is another two example which redirects port 2208 (which has configured a bind listener for SSH on Internal host 192.168.0.209:2208) from External Internet IP address (XXX.YYY.ZZZ.XYZ) 
 

# Port redirect for SSH to VM on openxen internal Local lan server 192.168.0.209 
-A PREROUTING  -p tcp –dport 2208 -j DNAT –to-destination 192.168.0.209:2208
-A POSTROUTING -p tcp –dst 192.168.0.209 –dport 2208 -j SNAT –to-source 83.228.93.76


3. Redirect TCP traffic connections with redir tool


If you look for an easy straight forward way to redirect TCP traffic, installing and using redir (ready compiled program) might be a good idea.


root@server:~# apt-cache show redir|grep -i desc -A5 -B5
Version: 3.2-1
Installed-Size: 60
Maintainer: Lucas Kanashiro <kanashiro@debian.org>
Architecture: amd64
Depends: libc6 (>= 2.15)
Description-en: Redirect TCP connections
 It can run under inetd or stand alone (in which case it handles multiple
 connections).  It is 8 bit clean, not limited to line mode, is small and
 light. Supports transparency, FTP redirects, http proxying, NAT and bandwidth
 limiting.
 .
 redir is all you need to redirect traffic across firewalls that authenticate
 based on an IP address etc. No need for the firewall toolkit. The
 functionality of inetd/tcpd and "redir" will allow you to do everything you
 need without screwy telnet/ftp etc gateways. (I assume you are running IP
 Masquerading of course.)

Description-md5: 2089a3403d126a5a0bcf29b22b68406d
Homepage: https://github.com/troglobit/redir
Tag: interface::daemon, network::server, network::service, role::program,
 use::proxying
Section: net
Priority: optional


server:~# apt-get install –yes redir

Here is a short description taken from its man page 'man redir'


DESCRIPTION
     redir redirects TCP connections coming in on a local port, [SRC]:PORT, to a specified address/port combination, [DST]:PORT.  Both the SRC and DST arguments can be left out,
     redir will then use 0.0.0.0.

     redir can be run either from inetd or as a standalone daemon.  In –inetd mode the listening SRC:PORT combo is handled by another process, usually inetd, and a connected
     socket is handed over to redir via stdin.  Hence only [DST]:PORT is required in –inetd mode.  In standalone mode redir can run either in the foreground, -n, or in the back‐
     ground, detached like a proper UNIX daemon.  This is the default.  When running in the foreground log messages are also printed to stderr, unless the -s flag is given.

     Depending on how redir was compiled, not all options may be available.


+ Use redir to redirect TCP traffic one time


Lets say you have a MySQL running on remote machine on some internal or external IP address, lets say 192.168.0.200 and you want to redirect all traffic from remote host to the machine (192.168.0.50), where you run your Apache Webserver, which you want to configure to use
as MySQL localhost TCP port 3306.

Assuming there are no irewall restrictions between Host A (192.168.0.50) and Host B (192.168.0.200) is already permitting connectivity on TCP/IP port 3306 between the two machines.

To open redirection from localhost on 192.168.0.50 -> 192.168.0.200:


server:~# redir –laddr=127.0.0.1 –lport=3306 –caddr=192.168.0.200 –cport=3306


If you need other third party hosts to be additionally reaching 192.168.0.200 via 192.168.0.50 TCP 3306.

root@server:~# redir –laddr=192.168.0.50 –lport=3306 –caddr=192.168.0.200 –cport=3306


Of course once you close, the /dev/tty or /dev/vty console the connection redirect will be cancelled.


+ Making TCP port forwarding from Host A to Host B permanent


One solution to make the redir setup rules permanent is to use –rinetd option or simply background the process, nevertheless I prefer to use instead GNU Screen.
If you don't know screen is a vVrtual Console Emulation manager with VT100/ANSI terminal emulation to so, if you don't have screen present on the host install it with whatever Linux OS package manager is present and run:


root@server:~#screen -dm bash -c 'redir –laddr=127.0.0.1 –lport=3306 –caddr=192.168.0.200 –cport=3306'


That would run it into screen session and detach so you can later connect, if you want you can make redir to also log connections via syslog with ( -s) option.

I found also useful to be able to track real time what's going on currently with the opened redirect socket by changing redir log level.

Accepted log level is:


  -l, –loglevel=LEVEL
             Set log level: none, err, notice, info, debug.  Default is notice.


root@server:/ # screen -dm bash -c 'redir –laddr=127.0.0.1 –lport=3308 –caddr=192.168.0.200 –cport=3306 -l debug'


To test connectivity works as expected use telnet:
 

root@server:/ # telnet localhost 3308
Trying 127.0.0.1…
Connected to localhost.
Escape character is '^]'.
g
5.5.5-10.3.29-MariaDB-0+deb10u1-log�+c2nWG>B���o+#ly=bT^]79mysql_native_password

6#HY000Proxy header is not accepted from 192.168.0.19 Connection closed by foreign host.

once you attach to screen session with


root@server:/home #  screen -r


You will get connectivity attempt from localhost logged : .
 

redir[10640]: listening on 127.0.0.1:3306
redir[10640]: target is 192.168.0.200:3306
redir[10640]: Waiting for client to connect on server socket …
redir[10640]: target is 192.168.0.200:3306
redir[10640]: Waiting for client to connect on server socket …
redir[10793]: peer IP is 127.0.0.1
redir[10793]: peer socket is 25592
redir[10793]: target IP address is 192.168.0.200
redir[10793]: target port is 3306
redir[10793]: Connecting 127.0.0.1:25592 to 127.0.0.1:3306
redir[10793]: Entering copyloop() – timeout is 0
redir[10793]: Disconnect after 1 sec, 165 bytes in, 4 bytes out

The downsides of using redir is redirection is handled by the separate process which is all time hanging in the process list, as well as the connection redirection speed of incoming connections might be about at least 30% slower to if you simply use a software (firewall ) redirect such as iptables. If you use something like kernel IP set ( ipsets ). If you hear of ipset for a first time and you wander whta it is below is short package description.


root@server:/root# apt-cache show ipset|grep -i description -A13 -B5
Maintainer: Debian Netfilter Packaging Team <pkg-netfilter-team@lists.alioth.debian.org>
Architecture: amd64
Provides: ipset-6.38
Depends: iptables, libc6 (>= 2.4), libipset11 (>= 6.38-1~)
Breaks: xtables-addons-common (<< 1.41~)
Description-en: administration tool for kernel IP sets
 IP sets are a framework inside the Linux 2.4.x and 2.6.x kernel which can be
 administered by the ipset(8) utility. Depending on the type, currently an
 IP set may store IP addresses, (TCP/UDP) port numbers or IP addresses with
 MAC addresses in a  way which ensures lightning speed when matching an
 entry against a set.
 .
 If you want to
 .
  * store multiple IP addresses or port numbers and match against the
    entire collection using a single iptables rule.
  * dynamically update iptables rules against IP addresses or ports without
    performance penalty.
  * express complex IP address and ports based rulesets with a single
    iptables rule and benefit from the speed of IP sets.

 .
 then IP sets may be the proper tool for you.
Description-md5: d87e199641d9d6fbb0e52a65cf412bde
Homepage: http://ipset.netfilter.org/
Tag: implemented-in::c, role::program
Section: net
Priority: optional
Filename: pool/main/i/ipset/ipset_6.38-1.2_amd64.deb
Size: 50684
MD5sum: 095760c5db23552a9ae180bd58bc8efb
SHA256: 2e2d1c3d494fe32755324bf040ffcb614cf180327736c22168b4ddf51d462522

Why does Orthodox Christian priests and monks wears long beards and why Roman Catholics does not

Thursday, May 19th, 2011

A really Long bearded Orthodox Christian Priest

One might question why does Orthodox Christian priests wear beards? and why does the long beards of our Orthodox priests makes differences with the Roman Catholics?

Here are the few reasons:

1. Long beards wearing's tradition among Orthodox Christian priests and monks comes after Christ

Christ himself had a beard as it was normal and considered proper for a man to wear long beard.

The fact that our Lord Jesus Christ had a long beard himself can clearly be observed on all our Orthodox Christian icons:
The Lord Jesus Christ Sinai monastery ancient icon Pantocrator from the 6th century

The Lord's Pantecrator Icon (Pantocrator / Pantecrator ) from the 6th century

2. Long beards priest wearing comes as a natural tradition from the Old Testament's times and the tradition of early Church

If one reads thoroughfully the old testament, he will find out that even from Moses and Aaron and onwards the tradition is the same.
All the Godly man and the priests had their long beards unshaved as a mark for their belongship and dedication to God.
To generalize the long beards wearing is according to ancient old testamential ancient tradition.
The long beards tradition as an ancient Jewish religion (Old testamental) tradition can still be clearly observed in Jewish rabbis (nowdays the jewish priests), who still wears their beards long, like for example you can see in the picture below:

Jewish Rabbi weiss picture
A modern day Jewish Rabbi notice the beard 🙂

The long beards tradition later was adopted by Muslims when Islam emerged as a religion and more specificly by the muslim priests the Hodjas:

Sait Muslim Hodja Picture

One very interesting historical source of information which proofs that the ancient Church's priests had the tradition not to cut their beards is given by the historian Egezit who writes in his Chronicles that st. Apostle James, the head of the Church in Jerusalem, never cuts his hair.

A source of confirmation that the long hear and beards wearing was an established tradition that dates back to the old testament is found in the old testament in (Ezekiel 8:3)

Here is what exactly we read there:

He stretched out what looked like a hand and took me by the hair of my head.
The Spirit lifted me up between earth and heaven and in visions of God he took me to Jerusalem,
to the entrance to the north gate of the inner court, where the idol that provokes to jealousy stood.

3. Long hair and beards wearing by the Monks


Hieromonk_Sergij_Monk_Pomorie
An interesting fact is why does the Monks and novice neophyte lay brothers also stick to the ancient tradition.
It appears long hair and beards wearing traces back to the holy life of the ascetics of the deserts (e.g. the hermits).

The reason why ascetics did not shaved their hairs or bears as a way to avoid vanity and therefore this old hermitage practice has also had a spiritual reason.

4. The Nazarite old testament tradition

In the old testament in Numbers 6:1-21, we read about the term nazarite which means consecrated / separated

Each boy or man who was to become a Nazarine has been devoted to God for a certain period of time or in some cases for his all life, one of the many conditions for one to be a nazarite is not to shave his beard or hair.
One can read about this in the old testament in Leviticus 21:5

Leviticus 21:5
"They shall not make baldness upon their head,
neither shall they shave off the corner of their beard nor make any cuttings in their flesh."

There are some other prohibitions relating to Nazarite's one of the most notable ones is found in Numbers 6:4:

All the days of his Naziriteship shall he eat nothing that is made of the grape-vine,
from the pressed grapes even to the grapestone.

One example for people who gaves vow to become temporary Nazarites is found in 1 Maccabees 3:49 (this book is only available in the Orthodox Holy Bible).
One of the most important figure in Christianity that used to be Nazarite is Samson, his life can be read in the old testament in Judges 13 – 16

As we read in Judges , Samson's great God given power consituted in a prohibition to shave his hair and not to drink wine.

5. Reason why Roman Catholic Priests and monks abandoned the ancient tradition of wearing long hairs and beards

In the early Roman Empire it was a customfor a men to shave. The "enlightened" Romans believed that only the barbarians did not shaved themselves, and as you can imagine Jewish people and early Christians were of course considered to be barbarians, e.g. being unshaved was a sign for a cultural inferiorness in according to Romans comprehension.

The long hairs and beards tradition in the Western Church has started disappearing and consequentially completely lost with the Tyranny of Charlemagne at the end of the eight century.
With his massive 'barbarian' inferiority complex, it was his desire in all things to imitate pagan classical Rome.
It was therefore under him that Western clergy were ordered to shave regularly.
For example at the Council of Aachen (816), it was stipulated that priests and monks were to shave every two weeks.

By the beginning of the 11th century the tradition of wearing long beards was already completely torned apart and almost all the Roman Catholic clergy was regularly shaving.

In the sixteenth century beardlessness for Roman Catholic clergy was enforced by further canons,
which appear to have been dropped since the Second Vatican Council.

6. Why does protestants does not wear beards

As we all know protestant Church denominations has emerged as schismatics from Roman Catholic church and therefore mostly the influence they had was from Roman Catholics which already had the tradition within their clergy to regularly shave, thus pastors shaving was completely out of question and never come to an established reality among the Protestant Church pastors.

7. Is the Orthodox Christian layman obliged to wear beards

Absolutely not! The layman within the Orthodox Church can choose for themselves, if they want to wear their hair and beard and through that possess an image physically similar to Christ.
In my view it's more righteous for us the layman to wear our hairs and beards as I personally believe long hair and beards demonstrates mans dignity and God's dedication, but this is my own private opinion.
At many cases wearing beards or long hairs is an obstacle for a good integration in nowdays society, so if wearing a beard or hair as laymans does become an obstacle for our normal daily lifes then I believe cutting a long beard or hair is perfectly acceptable.
Moreover even the Orthodox Christian priests are not enforced to wear beards and in some cases where the priest's wife is against the beardness the Orthodox priest is allowed to shave himself, though as a matter of fact having a completely shaved priests in our Orthodox Churches is rare and less common today.

In conclusion wearing of beard and long hair by Orthodox Christna clergy, has come from the desire to physically resemble Christ.
This physical resemblance is a symbol of the spiritual resemblance of Christ's humility, which is the ultimate aim of our life.

How to restart Microsoft IIS with command via Windows command line

Friday, August 19th, 2011

I'm tuning a Windows 2003 for better performance and securing it against DoS of service attacks. After applying all the changes I needed to restart the WebServer for the new configurations to take effect.
As I'm not a GUI kind of guy I found it handy there is a fast command to restart the Microsoft Internet Information Server. The command to restart IIS is:

c:> iisreset

Reinstall all Debian packages with a copy of apt deb package list from another working Debian Linux installation

Wednesday, July 29th, 2020

Reinstall-all-Debian-packages-with-copy-of-apt-packages-list-from-another-working-Debian-Linux-installation

Few days ago, in the hurry in the small hours of the night, I've done something extremely stupid. Wanting to move out a .tar.gz binary copy of qmail installation to /var/lib/qmail with all the dependent qmail items instead of extracting to admin user /root directory (/root), I've extracted it to the main Operating system root / directrory.
Not noticing this, I've quickly executed rm -rf var with the idea to delete all directory tree under /root/var just 3 seconds later, I've realized I'm issuing the rm -rf var with the wrong location WITH a root user !!!! Being scared on what I've done, I've quickly pressed CTRL+C to immedately cancel the deletion operation of my /var.

wrong-system-var-rm-linux-dont-do-that-ever-or-your-system-will-end-up-irreversably-damaged

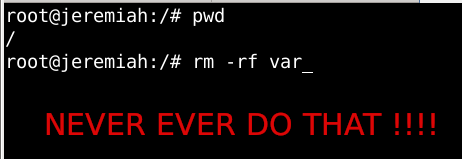
But as you can guess, since the machine has an Slid State Drive drive and SSD memory drive are much more faster in I/O operations than the classical ATA / SATA disks. I was not quick enough to cancel the operation and I've noticed already some part of my /var have been R.I.P-pped in the heaven of directories.

This was ofcourse upsetting so for a while I rethinked the situation to get some ideas on what I can do to recover my system ASAP!!! and I had the idea of course to try to reinstall All my installed .deb debian packages to restore system closest to the normal, before my stupid mistake.

Guess my unpleasent suprise when I have realized dpkg and respectively apt-get apt and aptitude package management tools cannot anymore handle packages as Debian Linux's package dependency database has been damaged due to missing dpkg directory 


/var/lib/dpkg 


Oh man that was unpleasent, especially since I've installed plenty of stuff that is custom on my Mate based desktop and, generally reinstalling it updating the sytem to the latest Debian security updates etc. will be time consuming and painful process I wanted to omit.

So of course the logical thing to do here was to try to somehow recover somehow a database copy of /var/lib/dpkg  if that was possible, that of course led me to the idea to lookup for a way to recover my /var/lib/dpkg from backup but since I did not maintained any backup copy of my OS anywhere that was not really possible, so anyways I wondered whether dpkg does not keep some kind of database backups somewhere in case if something goes wrong with its database.
This led me to this nice Ubuntu thred which has pointed me to the part of my root rm -rf dpkg db disaster recovery solution.
Luckily .deb package management creators has thought about situation similar to mine and to give the user a restore point for /var/lib/dpkg damaged database

/var/lib/dpkg is periodically backed up in /var/backups

A typical /var/lib/dpkg on Ubuntu and Debian Linux looks like so:
 

hipo@jeremiah:/var/backups$ ls -l /var/lib/dpkg
total 12572
drwxr-xr-x 2 root root    4096 Jul 26 03:22 alternatives
-rw-r–r– 1 root root      11 Oct 14  2017 arch
-rw-r–r– 1 root root 2199402 Jul 25 20:04 available
-rw-r–r– 1 root root 2199402 Oct 19  2017 available-old
-rw-r–r– 1 root root       8 Sep  6  2012 cmethopt
-rw-r–r– 1 root root    1337 Jul 26 01:39 diversions
-rw-r–r– 1 root root    1223 Jul 26 01:39 diversions-old
drwxr-xr-x 2 root root  679936 Jul 28 14:17 info
-rw-r—– 1 root root       0 Jul 28 14:17 lock
-rw-r—– 1 root root       0 Jul 26 03:00 lock-frontend
drwxr-xr-x 2 root root    4096 Sep 17  2012 parts
-rw-r–r– 1 root root    1011 Jul 25 23:59 statoverride
-rw-r–r– 1 root root     965 Jul 25 23:59 statoverride-old
-rw-r–r– 1 root root 3873710 Jul 28 14:17 status
-rw-r–r– 1 root root 3873712 Jul 28 14:17 status-old
drwxr-xr-x 2 root root    4096 Jul 26 03:22 triggers
drwxr-xr-x 2 root root    4096 Jul 28 14:17 updates

Before proceeding with this radical stuff to move out /var/lib/dpkg/info from another machine to /var mistakenyl removed oned. I have tried to recover with the well known:

  • extundelete
  • foremost
  • recover
  • ext4magic
  • ext3grep
  • gddrescue
  • ddrescue
  • myrescue
  • testdisk
  • photorec

Linux file deletion recovery tools from a USB stick loaded with a Number of LiveCD distributions, i.e. tested recovery with:

  • Debian LiveCD
  • Ubuntu LiveCD
  • KNOPPIX
  • SystemRescueCD
  • Trinity Rescue Kit
  • Ultimate Boot CD


but unfortunately none of them couldn't recover the deleted files … 

The reason why the standard file recovery tools could not recover ?

My assumptions is after I've done by rm -rf var; from sysroot,  issued the sync (- if you haven't used it check out man sync) command – that synchronizes cached writes to persistent storage and did a restart from the poweroff PC button, this should have worked, as I've recovered like that in the past) in a normal Sys V System with a normal old fashioned blocks filesystem as EXT2 . or any other of the filesystems without a journal, however as the machine run a EXT4 filesystem with a journald and journald, this did not work perhaps because something was not updated properly in /lib/systemd/systemd-journal, that led to the situation all recently deleted files were totally unrecoverable.

1. First step was to restore the directory skele of /var/lib/dpkg

# mkdir -p /var/lib/dpkg/{alternatives,info,parts,triggers,updates}


2. Recover missing /var/lib/dpkg/status  file

The main file that gives information to dpkg of the existing packages and their statuses on a Debian based systems is /var/lib/dpkg/status

# cp /var/backups/dpkg.status.0 /var/lib/dpkg/status


3. Reinstall dpkg package manager to make package management working again

Say a warm prayer to the Merciful God ! and do:

# apt-get download dpkg
# dpkg -i dpkg*.deb


4. Reinstall base-files .deb package which provides basis of a Debian system

Hopefully everything will be okay and your dpkg / apt pair will be in normal working state, next step is to:

# apt-get download base-files
# dpkg -i base-files*.deb


5. Do a package sanity and consistency check and try to update OS package list

Check whether packages have been installed only partially on your system or that have missing, wrong or obsolete control  data  or  files.  dpkg  should suggest what to do with them to get them fixed.

# dpkg –audit

Then resynchronize (fetch) the package index files from their sources described in /etc/apt/sources.list

# apt-get update


Do apt db constistency check:

#  apt-get check


check is a diagnostic tool; it updates the package cache and checks for broken dependencies.
 

Take a deep breath ! …

Do :

ls -l /var/lib/dpkg
and compare with the above list. If some -old file is not present don't worry it will be there tomorrow.

Next time don't forget to do a regular backup with simple rsync backup script or something like Bacula / Amanda / Time Vault or Clonezilla.
 

6. Copy dpkg database from another Linux system that has a working dpkg / apt Database

Well this was however not the end of the story … There were still many things missing from my /var/ and luckily I had another Debian 10 Buster install on another properly working machine with a similar set of .deb packages installed. Therefore to make most of my programs still working again I have copied over /var from the other similar set of package installed machine to my messed up machine with the missing deleted /var.

To do so …
On Functioning Debian 10 Machine (Working Host in a local network with IP 192.168.0.50), I've archived content of /var:

linux:~# tar -czvf var_backup_debian10.tar.gz /var

Then sftped from Working Host towards the /var deleted broken one in my case this machine's hostname is jericho and luckily still had SSHD and SFTP running processes loaded in memory:

jericho:~# sftp root@192.168.0.50
sftp> get var_backup_debian10.tar.gz

Now Before extracting the archive it is a good idea to make backup of old /var remains somewhere for example somewhere in /root 
just in case if we need to have a copy of the dpkg backup dir /var/backups

jericho:~# cp -rpfv /var /root/var_backup_damaged

 
jericho:~# tar -zxvf /root/var_backup_debian10.tar.gz 
jericho:/# mv /root/var/ /

Then to make my /var/lib/dpkg contain the list of packages from my my broken Linux install I have ovewritten /var/lib/dpkg with the files earlier backupped before  .tar.gz was extracted.

jericho:~# cp -rpfv /var /root/var_backup_damaged/lib/dpkg/ /var/lib/


7. Reinstall All Debian  Packages completely scripts


I then tried to reinstall each and every package first using aptitude with aptitude this is done with

# aptitude reinstall '~i'

However as this failed, tried using a simple shell loop like below:

for i in $(dpkg -l |awk '{ print $2 }'); do echo apt-get install –reinstall –yes $i; done

Alternatively, all .deb package reninstall is also possible with dpkg –get-selections and with awk with below cmds:

dpkg –get-selections | grep -v deinstall | awk '{print $1}' > list.log;
awk '$1=$1' ORS=' ' list.log > newlist.log
;
apt-get install –reinstall $(cat newlist.log)

It can also be run as one liner for simplicity:

dpkg –get-selections | grep -v deinstall | awk '{print $1}' > list.log; awk '$1=$1' ORS=' ' list.log > newlist.log; apt-get install –reinstall $(cat newlist.log)

This produced a lot of warning messages, reporting "package has no files currently installed" (virtually for all installed packages), indicating a severe packages problem below is sample output produced after each and every package reinstall … :

dpkg: warning: files list file for package 'iproute' missing; assuming package has no files currently installed
dpkg: warning: files list file for package 'brscan-skey' missing; assuming package has no files currently installed
dpkg: warning: files list file for package 'libapache2-mod-php7.4' missing; assuming package has no files currently installed
dpkg: warning: files list file for package 'libexpat1:amd64' missing; assuming package has no files currently installed
dpkg: warning: files list file for package 'libexpat1:i386' missing; assuming package has no files currently installed
dpkg: warning: files list file for package 'php5.6-readline' missing; assuming package has no files currently installed
dpkg: warning: files list file for package 'linux-headers-4.19.0-5-amd64' missing; assuming package has no files currently installed
dpkg: warning: files list file for package 'libgraphite2-3:amd64' missing; assuming package has no files currently installed
dpkg: warning: files list file for package 'libgraphite2-3:i386' missing; assuming package has no files currently installed
dpkg: warning: files list file for package 'libbonoboui2-0:amd64' missing; assuming package has no files currently installed
dpkg: warning: files list file for package 'libxcb-dri3-0:amd64' missing; assuming package has no files currently installed
dpkg: warning: files list file for package 'libxcb-dri3-0:i386' missing; assuming package has no files currently installed
dpkg: warning: files list file for package 'liblcms2-2:amd64' missing; assuming package has no files currently installed
dpkg: warning: files list file for package 'liblcms2-2:i386' missing; assuming package has no files currently installed
dpkg: warning: files list file for package 'libpixman-1-0:amd64' missing; assuming package has no files currently installed
dpkg: warning: files list file for package 'libpixman-1-0:i386' missing; assuming package has no files currently installed
dpkg: warning: files list file for package 'gksu' missing; assuming package has no files currently installed
dpkg: warning: files list file for package 'liblogging-stdlog0:amd64' missing; assuming package has no files currently installed
dpkg: warning: files list file for package 'mesa-vdpau-drivers:amd64' missing; assuming package has no files currently installed
dpkg: warning: files list file for package 'mesa-vdpau-drivers:i386' missing; assuming package has no files currently installed
dpkg: warning: files list file for package 'libzvbi0:amd64' missing; assuming package has no files currently installed
dpkg: warning: files list file for package 'libzvbi0:i386' missing; assuming package has no files currently installed
dpkg: warning: files list file for package 'libcdparanoia0:amd64' missing; assuming package has no files currently installed
dpkg: warning: files list file for package 'libcdparanoia0:i386' missing; assuming package has no files currently installed
dpkg: warning: files list file for package 'python-gconf' missing; assuming package has no files currently installed
dpkg: warning: files list file for package 'php5.6-cli' missing; assuming package has no files currently installed
dpkg: warning: files list file for package 'libpaper1:amd64' missing; assuming package has no files currently installed
dpkg: warning: files list file for package 'mixer.app' missing; assuming package has no files currently installed

After some attempts I found a way to be able to work around the warning message, for each package by simply reinstalling the package reporting the issue with

apt –reinstall $package_name


Though reinstallation started well and many packages got reinstalled, unfortunately some packages such as apache2-mod-php5.6 and other php related ones  started failing during reinstall ending up in unfixable states right after installation of binaries from packages was successfully placed in its expected locations on disk. The failures occured during the package setup stage ( dpkg –configure $packagename) …

The logical thing to do is a recovery attempt with something like the usual well known by any Debian admin:

apt-get install –fix-missing

As well as Manual requesting to reconfigure (issue re-setup) of all installed packages also did not produced a positive result

dpkg –configure -a

But many packages were still failing due to dpkg inability to execute some post installation scripts from respective .deb files.
To work around that and continue installing the rest of packages I had to manually delete all files related to the failing package located under directory 

/var/lib/dpkg/info#

For example to omit the post installation failure of libapache2-mod-php5.6 and have a succesful install of the package next time I tried reinstall, I had to delete all /var/lib/dpkg/info/libapache2-mod-php5.6.postrm, /var/lib/dpkg/info/libapache2-mod-php5.6.postinst scripts and even sometimes everything like libapache2-mod-php5.6* that were present in /var/lib/dpkg/info dir.

The problem with this solution, however was the package reporting to install properly, but the post install script hooks were still not in placed and important things as setting permissions of binaries after install or applying some configuration changes right after install was missing leading to programs failing to  fully behave properly or even breaking up even though showing as finely installed …

The final solution to this problem was radical.
I've used /var/lib/dpkg database (directory) from ther other working Linux machine with dpkg DB OK found in var_backup_debian10.tar.gz (linux:~# host with a working dpkg database) and then based on the dpkg package list correct database responding on jericho:~# to reinstall each and every package on the system using Debian System Reinstaller script taken from the internet.
Debian System Reinstaller works but to reinstall many packages, I've been prompted again and again whether to overwrite configuration or keep the present one of packages.
To Omit the annoying [Y / N ] text prompts I had made a slight modification to the script so it finally looked like this:
 

#!/bin/bash
# Debian System Reinstaller
# Copyright (C) 2015 Albert Huang
# Copyright (C) 2018 Andreas Fendt

# This program is free software: you can redistribute it and/or modify
# it under the terms of the GNU General Public License as published by
# the Free Software Foundation, either version 3 of the License, or
# (at your option) any later version.

# This program is distributed in the hope that it will be useful,
# but WITHOUT ANY WARRANTY; without even the implied warranty of
# MERCHANTABILITY or FITNESS FOR A PARTICULAR PURPOSE.  See the
# GNU General Public License for more details.

# You should have received a copy of the GNU General Public License
# along with this program.  If not, see <http://www.gnu.org/licenses/>.

# —
# This script assumes you are using a Debian based system
# (Debian, Mint, Ubuntu, #!), and have sudo installed. If you don't
# have sudo installed, replace "sudo" with "su -c" instead.

pkgs=`dpkg –get-selections | grep -w 'install$' | cut -f 1 |  egrep -v '(dpkg|apt)'`

for pkg in $pkgs; do
    echo -e "\033[1m   * Reinstalling:\033[0m $pkg"    

    apt-get –reinstall -o Dpkg::Options::="–force-confdef" -o Dpkg::Options::="–force-confold" -y install $pkg || {
        echo "ERROR: Reinstallation failed. See reinstall.log for details."
        exit 1
    }
done


 debian-all-packages-reinstall.sh working modified version of Albert Huang and Andreas Fendt script  can be also downloaded here.

Note ! Omitting the text confirmation prompts to install newest config or keep maintainer configuration is handled by the argument:


-o Dpkg::Options::="–force-confold


I however still got few NCurses Console selection prompts during the reinstall of about 3200+ .deb packages, so even with this mod the reinstall was not completely automatic.

Note !  During the reinstall few of the packages from the list failed due to being some old unsupported packages this was ejabberd, ircd-hybrid and a 2 / 3 more.
This failure was easily solved by completely purging those packages with the usual

# dpkg –purge $packagename

and reruninng  debian-all-packages-reinstall.sh on each of the failing packages.

Note ! The failing packages were just old ones left over from Debian 8 and Debian 9 before the apt-get dist-upgrade towards 10 Duster.
Eventually I got a success by God's grance, after few hours of pains and trials, ending up in a working state package database and a complete set of freshly reinstalled packages.

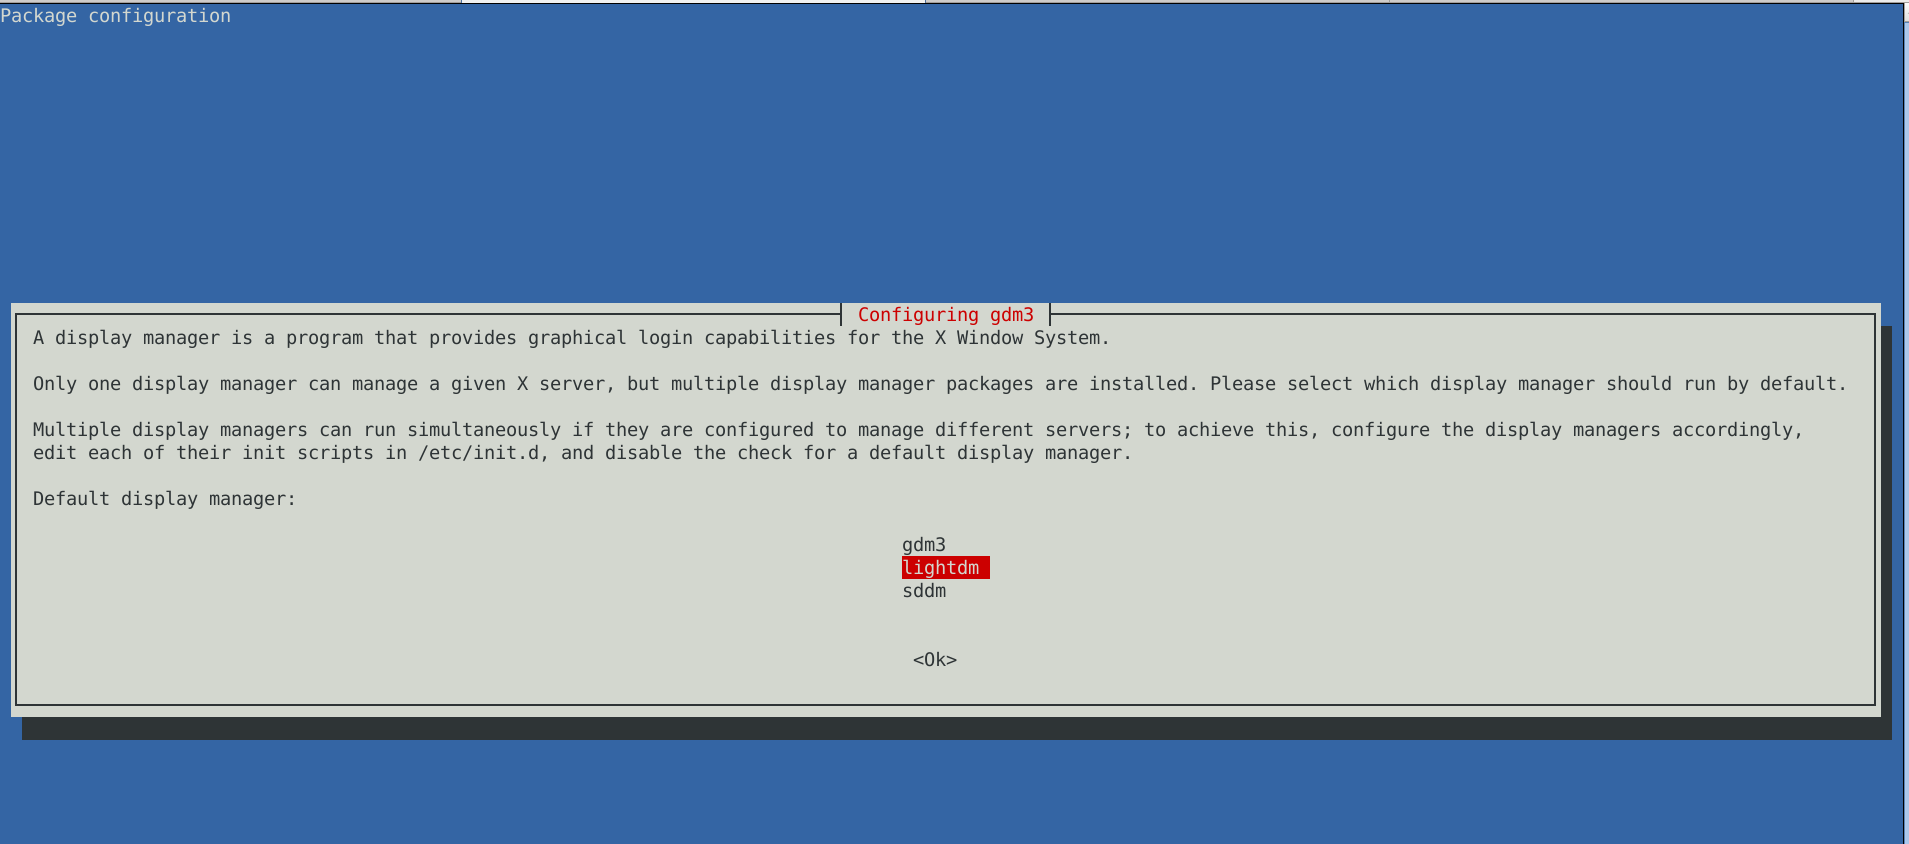
The only thing I had to do finally is 2 hours of tampering why GNOME did not automatically booted after the system reboot due to failing gdm
until I fixed that I've temprary used ligthdm (x-display-manager), to do I've

dpkg –reconfigure gdm3

lightdm-x-display-manager-screenshot-gdm3-reconfige

 to work around this I had to also reinstall few libraries, reinstall the xorg-server, reinstall gdm and reinstall the meta package for GNOME, using below set of commands:
 

apt-get install –reinstall libglw1-mesa libglx-mesa0
apt-get install –reinstall libglu1-mesa-dev
apt install –reinstallgsettings-desktop-schemas
apt-get install –reinstall xserver-xorg-video-intel
apt-get install –reinstall xserver-xorg
apt-get install –reinstall xserver-xorg-core
apt-get install –reinstall task-desktop
apt-get install –reinstall task-gnome-desktop


As some packages did not ended re-instaled on system because on the original host from where /var/lib/dpkg db was copied did not have it I had to eventually manually trigger reinstall for those too:


apt-get install –reinstall –yes vlc
apt-get install –reinstall –yes thunderbird
apt-get install –reinstall –yes audacity
apt-get install –reinstall –yes gajim
apt-get install –reinstall –yes slack remmina
apt-get install –yes k3b
pt-get install –yes gbgoffice
pt-get install –reinstall –yes skypeforlinux
apt-get install –reinstall –yes vlc
apt-get install –reinstall –yes libcurl3-gnutls libcurl3-nss
apt-get install –yes virtualbox-5.2
apt-get install –reinstall –yes vlc
apt-get install –reinstall –yes alsa-tools-gui
apt-get install –reinstall –yes gftp
apt install ./teamviewer_15.3.2682_amd64.deb –yes


Note that some of above packages requires a properly configured third party repositories, other people might have other packages that are missing from the dpkg list and needs to be reinstalled so just decide according to your own case of left aside working system present binaries that doesn't belong to any dpkg installed package.

After a bit of struggle everything is back to normal Thanks God! 🙂 !


Monitoring Linux hardware Hard Drives / Temperature and Disk with lm_sensors / smartd / hddtemp and Zabbix Userparameter lm_sensors report script

Thursday, April 30th, 2020

monitoring-linux-hardware-with-software-temperature-disk-cpu-health-zabbix-userparameter-script

I'm part of a  SysAdmin Team that is partially doing some minor Zabbix imrovements on a custom corporate installed Zabbix in an ongoing project to substitute the previous HP OpenView monitoring for a bunch of Legacy Linux hosts.
As one of the necessery checks to have is regarding system Hardware, the task was to invent some simplistic way to monitor hardware with the Zabbix Monitoring tool.  Monitoring Bare Metal servers hardware of HP / Dell / Fujituse etc. servers  in Linux usually is done with a third party software provided by the Hardware vendor. But as this requires an additional services to run and sometimes is not desired. It was interesting to find out some alternative Linux native ways to do the System hardware monitoring.
Monitoring statistics from the system hardware components can be obtained directly from the server components with ipmi / ipmitool (for more info on it check my previous article Reset and Manage intelligent  Platform Management remote board article).
With ipmi
 hardware health info could be received straight from the ILO / IDRAC / HPMI of the server. However as often the Admin-Lan of the server is in a seperate DMZ secured network and available via only a certain set of routed IPs, ipmitool can't be used.

So what are the other options to use to implement Linux Server Hardware Monitoring?

The tools to use are perhaps many but I know of two which gives you most of the information you ever need to have a prelimitary hardware damage warning system before the crash, these are:
 

1. smartmontools (smartd)

Smartd is part of smartmontools package which contains two utility programs (smartctl and smartd) to control and monitor storage systems using the Self-Monitoring, Analysis and Reporting Technology system (SMART) built into most modern ATA/SATA, SCSI/SAS and NVMe disks

Disk monitoring is handled by a special service the package provides called smartd that does query the Hard Drives periodically aiming to find a warning signs of hardware failures.
The downside of smartd use is that it implies a little bit of extra load on Hard Drive read / writes and if misconfigured could reduce the the Hard disk life time.


linux:~#  /usr/sbin/smartctl -a /dev/sdb2
smartctl 6.6 2017-11-05 r4594 [x86_64-linux-4.19.0-5-amd64] (local build)
Copyright (C) 2002-17, Bruce Allen, Christian Franke, www.smartmontools.org

=== START OF INFORMATION SECTION ===
Device Model:     KINGSTON SA400S37240G
Serial Number:    50026B768340AA31
LU WWN Device Id: 5 0026b7 68340aa31
Firmware Version: S1Z40102
User Capacity:    240,057,409,536 bytes [240 GB]
Sector Size:      512 bytes logical/physical
Rotation Rate:    Solid State Device
Device is:        Not in smartctl database [for details use: -P showall]
ATA Version is:   ACS-3 T13/2161-D revision 4
SATA Version is:  SATA 3.2, 6.0 Gb/s (current: 3.0 Gb/s)
Local Time is:    Thu Apr 30 14:05:01 2020 EEST
SMART support is: Available – device has SMART capability.
SMART support is: Enabled

=== START OF READ SMART DATA SECTION ===
SMART overall-health self-assessment test result: PASSED

General SMART Values:
Offline data collection status:  (0x00) Offline data collection activity
                                        was never started.
                                        Auto Offline Data Collection: Disabled.
Self-test execution status:      (   0) The previous self-test routine completed
                                        without error or no self-test has ever
                                        been run.
Total time to complete Offline
data collection:                (  120) seconds.
Offline data collection
capabilities:                    (0x11) SMART execute Offline immediate.
                                        No Auto Offline data collection support.
                                        Suspend Offline collection upon new
                                        command.
                                        No Offline surface scan supported.
                                        Self-test supported.
                                        No Conveyance Self-test supported.
                                        No Selective Self-test supported.
SMART capabilities:            (0x0002) Does not save SMART data before
                                        entering power-saving mode.
                                        Supports SMART auto save timer.
Error logging capability:        (0x01) Error logging supported.
                                        General Purpose Logging supported.
Short self-test routine
recommended polling time:        (   2) minutes.
Extended self-test routine
recommended polling time:        (  10) minutes.

SMART Attributes Data Structure revision number: 1
Vendor Specific SMART Attributes with Thresholds:
ID# ATTRIBUTE_NAME          FLAG     VALUE WORST THRESH TYPE      UPDATED  WHEN_FAILED RAW_VALUE
  1 Raw_Read_Error_Rate     0x0032   100   100   000    Old_age   Always       –       100
  9 Power_On_Hours          0x0032   100   100   000    Old_age   Always       –       2820
 12 Power_Cycle_Count       0x0032   100   100   000    Old_age   Always       –       21
148 Unknown_Attribute       0x0000   100   100   000    Old_age   Offline      –       0
149 Unknown_Attribute       0x0000   100   100   000    Old_age   Offline      –       0
167 Unknown_Attribute       0x0000   100   100   000    Old_age   Offline      –       0
168 Unknown_Attribute       0x0012   100   100   000    Old_age   Always       –       0
169 Unknown_Attribute       0x0000   100   100   000    Old_age   Offline      –       0
170 Unknown_Attribute       0x0000   100   100   010    Old_age   Offline      –       0
172 Unknown_Attribute       0x0032   100   100   000    Old_age   Always       –       0
173 Unknown_Attribute       0x0000   100   100   000    Old_age   Offline      –       0
181 Program_Fail_Cnt_Total  0x0032   100   100   000    Old_age   Always       –       0
182 Erase_Fail_Count_Total  0x0000   100   100   000    Old_age   Offline      –       0
187 Reported_Uncorrect      0x0032   100   100   000    Old_age   Always       –       0
192 Power-Off_Retract_Count 0x0012   100   100   000    Old_age   Always       –       16
194 Temperature_Celsius     0x0022   034   052   000    Old_age   Always       –       34 (Min/Max 19/52)
196 Reallocated_Event_Count 0x0032   100   100   000    Old_age   Always       –       0
199 UDMA_CRC_Error_Count    0x0032   100   100   000    Old_age   Always       –       0
218 Unknown_Attribute       0x0032   100   100   000    Old_age   Always       –       0
231 Temperature_Celsius     0x0000   097   097   000    Old_age   Offline      –       97
233 Media_Wearout_Indicator 0x0032   100   100   000    Old_age   Always       –       2104
241 Total_LBAs_Written      0x0032   100   100   000    Old_age   Always       –       1857
242 Total_LBAs_Read         0x0032   100   100   000    Old_age   Always       –       1141
244 Unknown_Attribute       0x0000   100   100   000    Old_age   Offline      –       32
245 Unknown_Attribute       0x0000   100   100   000    Old_age   Offline      –       107
246 Unknown_Attribute       0x0000   100   100   000    Old_age   Offline      –       15940

SMART Error Log Version: 1
No Errors Logged

SMART Self-test log structure revision number 1
No self-tests have been logged.  [To run self-tests, use: smartctl -t]

Selective Self-tests/Logging not supported


2. hddtemp


Usually if smartd is used it is useful to also use hddtemp which relies on smartd data.
 The hddtemp program monitors and reports the temperature of PATA, SATA
 or SCSI hard drives by reading Self-Monitoring Analysis and Reporting
 Technology (S.M.A.R.T.)
information on drives that support this feature.
 

linux:~# /usr/sbin/hddtemp /dev/sda1
/dev/sda1: Hitachi HDS721050CLA360: 31°C
linux:~# /usr/sbin/hddtemp /dev/sdc6
/dev/sdc6: KINGSTON SV300S37A120G: 25°C
linux:~# /usr/sbin/hddtemp /dev/sdb2
/dev/sdb2: KINGSTON SA400S37240G: 34°C
linux:~# /usr/sbin/hddtemp /dev/sdd1
/dev/sdd1: WD Elements 10B8: S.M.A.R.T. not available


3. lm-sensors / i2c-tools 

 Lm-sensors is a hardware health monitoring package for Linux. It allows you
 to access information from temperature, voltage, and fan speed sensors.
i2c-tools
was historically bundled in the same package as lm_sensors but has been seperated cause not all hardware monitoring chips are I2C devices, and not all I2C devices are hardware monitoring chips.

The most basic use of lm-sensors is with the sensors command


linux:~# sensors
i350bb-pci-0600
Adapter: PCI adapter
loc1:         +55.0 C  (high = +120.0 C, crit = +110.0 C)


coretemp-isa-0000
Adapter: ISA adapter
Physical id 0:  +28.0 C  (high = +78.0 C, crit = +88.0 C)
Core 0:         +26.0 C  (high = +78.0 C, crit = +88.0 C)
Core 1:         +28.0 C  (high = +78.0 C, crit = +88.0 C)
Core 2:         +28.0 C  (high = +78.0 C, crit = +88.0 C)
Core 3:         +28.0 C  (high = +78.0 C, crit = +88.0 C)


On CentOS Linux useful tool is also  lm_sensors-sensord.x86_64 – A Daemon that periodically logs sensor readings to syslog or a round-robin database, and warns of sensor alarms.

In Debian Linux there is also the psensors-server (an HTTP server providing JSON Web service which can be used by GTK+ Application to remotely monitor sensors) useful for developers
psesors-server

psensor-linux-graphical-tool-to-check-cpu-hard-disk-temperature-unix

If you have a Xserver installed on the Server accessed with Xclient or via VNC though quite rare,
You can use xsensors or Psensora GTK+ (Widget Toolkit for creating Graphical User Interface) application software.

With this 3 tools it is pretty easy to script one liners and use the Zabbix UserParameters functionality to send hardware report data to a Company's Zabbix Sserver, though Zabbix has already some templates to do so in my case, I couldn't import this templates cause I don't have Zabbix Super-Admin credentials, thus to work around that a sample work around is use script to monitor for higher and critical considered temperature.
Here is a tiny sample script I came up in 1 min time it can be used to used as 1 liner UserParameter and built upon something more complex.

SENSORS_HIGH=`sensors | awk '{ print $6 }'| grep '^+' | uniq`;
SENSORS_CRIT=`sensors | awk '{ print $9 }'| grep '^+' | uniq`; ;SENSORS_STAT=`sensors|grep -E 'Core\s' | awk '{ print $1" "$2" "$3 }' | grep "$SENSORS_HIGH|$SENSORS_CRIT"`;
if [ ! -z $SENSORS_STAT ]; then
echo 'Temperature HIGH';
else 
echo 'Sensors OK';
fi 

Of course there is much more sophisticated stuff to use for monitoring out there


Below script can be easily adapted and use on other Monitoring Platforms such as Nagios / Munin / Cacti / Icinga and there are plenty of paid solutions, but for anyone that wants to develop something from scratch just like me I hope this
article will be a good short introduction.
If you know some other Linux hardware monitoring tools, please share.