Archive for the ‘Various’ Category

Apache disable requests to not log to access.log Logfile through SetEnvIf and dontlog httpd variables

Monday, October 11th, 2021

apache-disable-certain-strings-from-logging-to-access-log-logo

Logging to Apache access.log is mostly useful as this is a great way to keep log on who visited your website and generate periodic statistics with tools such as Webalizer or Astats to keep track on your visitors and generate various statistics as well as see the number of new visitors as well most visited web pages (the pages which mostly are attracting your web visitors), once the log analysis tool generates its statistics, it can help you understand better which Web spiders visit your website the most (as spiders has a predefined) IP addresses, which can give you insight on various web spider site indexation statistics on Google, Yahoo, Bing etc. . Sometimes however either due to bugs in web spiders algorithms or inconsistencies in your website structure, some of the web pages gets double visited records inside the logs, this could happen for example if your website uses to include iframes.

Having web pages accessed once but logged to be accessed twice hence is erroneous and unwanted, and though that usually have to be fixed by the website programmers, if such approach is not easily doable in the moment and the website is running on critical production system, the double logging of request can be omitted thanks to a small Apache log hack with SetEnvIf Apache config directive. Even if there is no double logging inside Apache log happening it could be that some cron job or automated monitoring scripts or tool such as monit is making periodic requests to Apache and this is garbling your Log Statistics results.

In this short article hence I'll explain how to do remove certain strings to not get logged inside /var/log/httpd/access.log.

1. Check SetEnvIf is Loaded on the Webserver
 

On CentOS / RHEL Linux:

# /sbin/apachectl -M |grep -i setenvif
AH00558: httpd: Could not reliably determine the server's fully qualified domain name, using localhost.localdomain. Set the 'ServerName' directive globally to suppress this message
 setenvif_module (shared)


On Debian / Ubuntu Linux:

/usr/sbin/apache2ctl -M |grep -i setenvif
AH00548: NameVirtualHost has no effect and will be removed in the next release /etc/apache2/sites-enabled/000-default.conf:1
 setenvif_module (shared)


2. Using SetEnvIf to omit certain string to get logged inside apache access.log


SetEnvIf could be used either in some certain domain VirtualHost configuration (if website is configured so), or it can be set as a global Apache rule from the /etc/httpd/conf/httpd.conf 

To use SetEnvIf  you have to place it inside a <Directory …></Directory> configuration block, if it has to be enabled only for a Certain Apache configured directory, otherwise you have to place it in the global apache config section.

To be able to use SetEnvIf, only in a certain directories and subdirectories via .htaccess, you will have defined in <Directory>

AllowOverride FileInfo


The general syntax to omit a certain Apache repeating string from keep logging with SetEnvIf is as follows:
 

SetEnvIf Request_URI "^/WebSiteStructureDirectory/ACCESS_LOG_STRING_TO_REMOVE$" dontlog


General syntax for SetEnvIf is as follows:

SetEnvIf attribute regex env-variable

SetEnvIf attribute regex [!]env-variable[=value] [[!]env-variable[=value]] …

Below is the overall possible attributes to pass as described in mod_setenvif official documentation.
 

  • Host
  • User-Agent
  • Referer
  • Accept-Language
  • Remote_Host: the hostname (if available) of the client making the request.
  • Remote_Addr: the IP address of the client making the request.
  • Server_Addr: the IP address of the server on which the request was received (only with versions later than 2.0.43).
  • Request_Method: the name of the method being used (GET, POST, etc.).
  • Request_Protocol: the name and version of the protocol with which the request was made (e.g., "HTTP/0.9", "HTTP/1.1", etc.).
  • Request_URI: the resource requested on the HTTP request line – generally the portion of the URL following the scheme and host portion without the query string.

Next locate inside the configuration the line:

CustomLog /var/log/apache2/access.log combined


To enable filtering of included strings, you'll have to append env=!dontlog to the end of line.


CustomLog /var/log/apache2/access.log combined env=!dontlog


You might be using something as cronolog for log rotation to prevent your WebServer logs to become too big in size and hard to manage, you can append env=!dontlog to it in same way.

If you haven't used cronolog is it is perhaps best to show you the package description.

server:~# apt-cache show cronolog|grep -i description -A10 -B5
Version: 1.6.2+rpk-2
Installed-Size: 63
Maintainer: Debian QA Group <packages@qa.debian.org>
Architecture: amd64
Depends: perl:any, libc6 (>= 2.4)
Description-en: Logfile rotator for web servers
 A simple program that reads log messages from its input and writes
 them to a set of output files, the names of which are constructed
 using template and the current date and time.  The template uses the
 same format specifiers as the Unix date command (which are the same
 as the standard C strftime library function).
 .
 It intended to be used in conjunction with a Web server, such as
 Apache, to split the access log into daily or monthly logs:
 .
   TransferLog "|/usr/bin/cronolog /var/log/apache/%Y/access.%Y.%m.%d.log"
 .
 A cronosplit script is also included, to convert existing
 traditionally-rotated logs into this rotation format.

Description-md5: 4d5734e5e38bc768dcbffccd2547922f
Homepage: http://www.cronolog.org/
Tag: admin::logging, devel::lang:perl, devel::library, implemented-in::c,
 implemented-in::perl, interface::commandline, role::devel-lib,
 role::program, scope::utility, suite::apache, use::organizing,
 works-with::logfile
Section: web
Priority: optional
Filename: pool/main/c/cronolog/cronolog_1.6.2+rpk-2_amd64.deb
Size: 27912
MD5sum: 215a86766cc8d4434cd52432fd4f8fe7

If you're using cronolog to daily rotate the access.log and you need to filter out the strings out of the logs, you might use something like in httpd.conf:


CustomLog "|/usr/bin/cronolog –symlink=/var/log/httpd/access.log /var/log/httpd/access.log_%Y_%m_%d" combined env=!dontlog


3. Disable Apache logging access.log from certain USERAGENT browser
 

You can do much more with SetEnvIf for example you might want to omit logging requests from a UserAgent (browser) to end up in /dev/null (nowhere), e.g. prevent any Website requests originating from Internet Explorer (MSIE) to not be logged.

SetEnvIf User_Agent "(MSIE)" dontlog

CustomLog /var/log/apache2/access.log combined env=!dontlog


4. Disable Apache logging from requests coming from certain FQDN (Fully Qualified Domain Name) localhost 127.0.0.1 or concrete IP / IPv6 address

SetEnvIf Remote_Host "dns.server.com$" dontlog

CustomLog /var/log/apache2/access.log combined env=!dontlog


Of course for this to work, your website should have a functioning DNS servers and Apache should be configured to be able to resolve remote IPs to back resolve to their respective DNS defined Hostnames.

SetEnvIf recognized also perl PCRE Regular Expressions, if you want to filter out of Apache access log requests incoming from multiple subdomains starting with a certain domain hostname.


SetEnvIf Remote_Host "^example" dontlog

– To not log anything coming from localhost.localdomain address ( 127.0.0.1 ) as well as from some concrete IP address :

SetEnvIf Remote_Addr "127\.0\.0\.1" dontlog

SetEnvIf Remote_Addr "192\.168\.1\.180" dontlog

– To disable IPv6 requests that be coming at the log even though you don't happen to use IPv6 at all

SetEnvIf Request_Addr "::1" dontlog

CustomLog /var/log/apache2/access.log combined env=!dontlog


– Note here it is obligatory to escape the dots '.'


5. Disable robots.txt Web Crawlers requests from being logged in access.log

SetEnvIf Request_URI "^/robots\.txt$" dontlog

CustomLog /var/log/apache2/access.log combined env=!dontlog

Using SetEnvIfNoCase to read incoming useragent / Host / file requests case insensitve

The SetEnvIfNoCase is to be used if you want to threat incoming originators strings as case insensitive, this is useful to omit extraordinary regular expression SetEnvIf rules for lower upper case symbols.

SetEnvIFNoCase User-Agent "Slurp/cat" dontlog
SetEnvIFNoCase User-Agent "Ask Jeeves/Teoma" dontlog
SetEnvIFNoCase User-Agent "Googlebot" dontlog
SetEnvIFNoCase User-Agent "bingbot" dontlog
SetEnvIFNoCase Remote_Host "fastsearch.net$" dontlog

Omit from access.log logging some standard web files .css , .js .ico, .gif , .png and Referrals from own domain

Sometimes your own site scripts do refer to stuff on your own domain that just generates junks in the access.log to keep it off.

SetEnvIfNoCase Request_URI "\.(gif)|(jpg)|(png)|(css)|(js)|(ico)|(eot)$" dontlog


SetEnvIfNoCase Referer "www\.myowndomain\.com" dontlog

CustomLog /var/log/apache2/access.log combined env=!dontlog


6. Disable Apache requests in access.log and error.log completely


Sometimes at rare cases the produced Apache logs and error log is really big and you already have the requests logged in another F5 Load Balancer or Haproxy in front of Apache WebServer or alternatively the logging is not interesting at all as the Web Application served written in ( Perl / Python / Ruby ) does handle the logging itself. 
I've earlier described how this is done in a good amount of details in previous article Disable Apache access.log and error.log logging on Debian Linux and FreeBSD

To disable it you will have to comment out CustomLog or set it to together with ErrorLog to /dev/null in apache2.conf / httpd.conf (depending on the distro)
 

CustomLog /dev/null
ErrorLog /dev/null


7. Restart Apache WebServer to load settings
 

An important to mention is in case you have Webserver with multiple complex configurations and there is a specific log patterns to omit from logs it might be a very good idea to:

a. Create /etc/httpd/conf/dontlog.conf / etc/apache2/dontlog.conf
add inside all your custom dontlog configurations
b. Include dontlog.conf from /etc/httpd/conf/httpd.conf / /etc/apache2/apache2.conf

Finally to make the changes take affect, of course you will need to restart Apache webserver depending on the distro and if it is with systemd or System V:

For systemd RPM based distro:

systemctl restart httpd

or for Deb based Debian etc.

systemctl apache2 restart

On old System V scripts systems:

On RedHat / CentOS etc. restart Apache with:
 

/etc/init.d/httpd restart


On Deb based SystemV:
 

/etc/init.d/apache2 restart


What we learned ?
 

We have learned about SetEnvIf how it can be used to prevent certain requests strings getting logged into access.log through dontlog, how to completely stop certain browser based on a useragent from logging to the access.log as well as how to omit from logging certain requests incoming from certain IP addresses / IPv6 or FQDNs and how to stop robots.txt from being logged to httpd log.


Finally we have learned how to completely disable Apache logging if logging is handled by other external application.
 

Install and enable Sysstats IO / DIsk / CPU / Network monitoring console suite on Redhat 8.3, Few sar useful command examples

Tuesday, September 28th, 2021

linux-sysstat-monitoring-logo


Why to monitoring CPU, Memory, Hard Disk, Network usage etc. with sysstats tools?
 

Using system monitoring tools such as Zabbix, Nagios Monit is a good approach, however sometimes due to zabbix server interruptions you might not be able to track certain aspects of system performance on time. Thus it is always a good idea to 
Gain more insights on system peroformance from command line. Of course there is cmd tools such as iostat and top, free, vnstat that provides plenty of useful info on system performance issues or bottlenecks. However from my experience to have a better historical data that is systimized and all the time accessible from console it is a great thing to have sysstat package at place. Since many years mostly on every server I administer, I've been using sysstats to monitor what is going on servers over a short time frames and I'm quite happy with it. In current company we're using Redhats and CentOS-es and I had to install sysstats on Redhat 8.3. I've earlier done it multiple times on Debian / Ubuntu Linux and while I've faced on some .deb distributions complications of making sysstat collect statistics I've come with an article on Howto fix sysstat Cannot open /var/log/sysstat/sa no such file or directory” on Debian / Ubuntu Linux
 

Sysstat contains the following tools related to collecting I/O and CPU statistics:
iostat
Displays an overview of CPU utilization, along with I/O statistics for one or more disk drives.
mpstat
Displays more in-depth CPU statistics.
Sysstat also contains tools that collect system resource utilization data and create daily reports based on that data. These tools are:
sadc
Known as the system activity data collector, sadc collects system resource utilization information and writes it to a file.
sar
Producing reports from the files created by sadc, sar reports can be generated interactively or written to a file for more intensive analysis.

My experience with CentOS 7 and Fedora to install sysstat it was pretty straight forward, I just had to install it via yum install sysstat wait for some time and use sar (System Activity Reporter) tool to report collected system activity info stats over time.
Unfortunately it seems on RedHat 8.3 as well as on CentOS 8.XX instaling sysstats does not work out of the box.

To complete a successful installation of it on RHEL 8.3, I had to:

[root@server ~]# yum install -y sysstat


To make sysstat enabled on the system and make it run, I've enabled it in sysstat

[root@server ~]# systemctl enable sysstat


Running immediately sar command, I've faced the shitty error:


Cannot open /var/log/sysstat/sa18:
No such file or directory. Please check if data collecting is enabled”


Once installed I've waited for about 5 minutes hoping, that somehow automatically sysstat would manage it but it didn't.

To solve it, I've had to create additionally file /etc/cron.d/sysstat (weirdly RPM's post install instructions does not tell it to automatically create it)

[root@server ~]# vim /etc/cron.d/sysstat

# run system activity accounting tool every 10 minutes
0 * * * * root /usr/lib64/sa/sa1 60 59 &
# generate a daily summary of process accounting at 23:53
53 23 * * * root /usr/lib64/sa/sa2 -A &


  • /usr/local/lib/sa1 is a shell script that we can use for scheduling cron which will create daily binary log file.
  • /usr/local/lib/sa2 is a shell script will change binary log file to human-readable form.


[root@server ~]# chmod 600 /etc/cron.d/sysstat

[root@server ~]# systemctl restart sysstat


In a while if sysstat is working correctly you should get produced its data history logs inside /var/log/sa

[root@server ~]# ls -al /var/log/sa 


Note that the standard sysstat history files on Debian and other modern .deb based distros such as Debian 10 (in  y.2021) is stored under /var/log/sysstat

Here is few useful uses of sysstat cmds


1. Check with sysstat machine history SWAP and RAM Memory use


To lets say check last 10 minutes SWAP memory use:

[hipo@server yum.repos.d] $ sar -W  |last -n 10
 

Linux 4.18.0-240.el8.x86_64 (server)       09/28/2021      _x86_64_        (8 CPU)

12:00:00 AM  pswpin/s pswpout/s
12:00:01 AM      0.00      0.00
12:01:01 AM      0.00      0.00
12:02:01 AM      0.00      0.00
12:03:01 AM      0.00      0.00
12:04:01 AM      0.00      0.00
12:05:01 AM      0.00      0.00
12:06:01 AM      0.00      0.00

[root@ccnrlb01 ~]# sar -r | tail -n 10
14:00:01        93008   1788832     95.06         0   1357700    725740      9.02    795168    683484        32
14:10:01        78756   1803084     95.81         0   1358780    725740      9.02    827660    652248        16
14:20:01        92844   1788996     95.07         0   1344332    725740      9.02    813912    651620        28
14:30:01        92408   1789432     95.09         0   1344612    725740      9.02    816392    649544        24
14:40:01        91740   1790100     95.12         0   1344876    725740      9.02    816948    649436        36
14:50:01        91688   1790152     95.13         0   1345144    725740      9.02    817136    649448        36
15:00:02        91544   1790296     95.14         0   1345448    725740      9.02    817472    649448        36
15:10:01        91108   1790732     95.16         0   1345724    725740      9.02    817732    649340        36
15:20:01        90844   1790996     95.17         0   1346000    725740      9.02    818016    649332        28
Average:        93473   1788367     95.03         0   1369583    725074      9.02    800965    671266        29


2. Check system load? Are my processes waiting too long to run on the CPU?

[root@server ~ ]# sar -q |head -n 10
Linux 4.18.0-240.el8.x86_64 (server)       09/28/2021      _x86_64_        (8 CPU)

12:00:00 AM   runq-sz  plist-sz   ldavg-1   ldavg-5  ldavg-15   blocked
12:00:01 AM         0       272      0.00      0.02      0.00         0
12:01:01 AM         1       271      0.00      0.02      0.00         0
12:02:01 AM         0       268      0.00      0.01      0.00         0
12:03:01 AM         0       268      0.00      0.00      0.00         0
12:04:01 AM         1       271      0.00      0.00      0.00         0
12:05:01 AM         1       271      0.00      0.00      0.00         0
12:06:01 AM         1       265      0.00      0.00      0.00         0


3. Show various CPU statistics per CPU use
 

On a multiprocessor, multi core server sometimes for scripting it is useful to fetch processor per use historic data, 
this can be attained with:


[hipo@server ~ ] $ mpstat -P ALL
Linux 4.18.0-240.el8.x86_64 (server)       09/28/2021      _x86_64_        (8 CPU)

06:08:38 PM  CPU    %usr   %nice    %sys %iowait    %irq   %soft  %steal  %guest  %gnice   %idle
06:08:38 PM  all    0.17    0.02    0.25    0.00    0.05    0.02    0.00    0.00    0.00   99.49
06:08:38 PM    0    0.22    0.02    0.28    0.00    0.06    0.03    0.00    0.00    0.00   99.39
06:08:38 PM    1    0.28    0.02    0.36    0.00    0.08    0.02    0.00    0.00    0.00   99.23
06:08:38 PM    2    0.27    0.02    0.31    0.00    0.06    0.01    0.00    0.00    0.00   99.33
06:08:38 PM    3    0.15    0.02    0.22    0.00    0.03    0.01    0.00    0.00    0.00   99.57
06:08:38 PM    4    0.13    0.02    0.20    0.01    0.03    0.01    0.00    0.00    0.00   99.60
06:08:38 PM    5    0.14    0.02    0.27    0.00    0.04    0.06    0.01    0.00    0.00   99.47
06:08:38 PM    6    0.10    0.02    0.17    0.00    0.04    0.02    0.00    0.00    0.00   99.65
06:08:38 PM    7    0.09    0.02    0.15    0.00    0.02    0.01    0.00    0.00    0.00   99.70


sar-sysstat-cpu-statistics-screenshot

Monitor processes and threads currently being managed by the Linux kernel.

[hipo@server ~ ] $ pidstat

pidstat-various-random-process-statistics

[hipo@server ~ ] $ pidstat -d 2


pidstat-show-processes-with-most-io-activities-linux-screenshot

This report tells us that there is few processes with heave I/O use Filesystem system journalling daemon jbd2, apache, mysqld and supervise, in 3rd column you see their respective PID IDs.

To show threads used inside a process (like if you press SHIFT + H) inside Linux top command:

[hipo@server ~ ] $ pidstat -t -p 10765 1 3

Linux 4.19.0-14-amd64 (server)     28.09.2021     _x86_64_    (10 CPU)

21:41:22      UID      TGID       TID    %usr %system  %guest   %wait    %CPU   CPU  Command
21:41:23      108     10765         –    1,98    0,99    0,00    0,00    2,97     1  mysqld
21:41:23      108         –     10765    0,00    0,00    0,00    0,00    0,00     1  |__mysqld
21:41:23      108         –     10768    0,00    0,00    0,00    0,00    0,00     0  |__mysqld
21:41:23      108         –     10771    0,00    0,00    0,00    0,00    0,00     5  |__mysqld
21:41:23      108         –     10784    0,00    0,00    0,00    0,00    0,00     7  |__mysqld
21:41:23      108         –     10785    0,00    0,00    0,00    0,00    0,00     6  |__mysqld
21:41:23      108         –     10786    0,00    0,00    0,00    0,00    0,00     2  |__mysqld

10765 – is the Process ID whose threads you would like to list

With pidstat, you can further monitor processes for memory leaks with:

[hipo@server ~ ] $ pidstat -r 2


4. Report paging statistics for some old period


[root@server ~ ]# sar -B -f /var/log/sa/sa27 |head -n 10
Linux 4.18.0-240.el8.x86_64 (server)       09/27/2021      _x86_64_        (8 CPU)

15:42:26     LINUX RESTART      (8 CPU)

15:55:30     LINUX RESTART      (8 CPU)

04:00:01 PM  pgpgin/s pgpgout/s   fault/s  majflt/s  pgfree/s pgscank/s pgscand/s pgsteal/s    %vmeff
04:01:01 PM      0.00     14.47    629.17      0.00    502.53      0.00      0.00      0.00      0.00
04:02:01 PM      0.00     13.07    553.75      0.00    419.98      0.00      0.00      0.00      0.00
04:03:01 PM      0.00     11.67    548.13      0.00    411.80      0.00      0.00      0.00      0.00


5.  Monitor Received RX and Transmitted TX network traffic perl Network interface real time
 

To print out Received and Send traffic per network interface 4 times in a raw

sar-sysstats-network-traffic-statistics-screenshot
 

[hipo@server ~ ] $ sar -n DEV 1 4


To continusly monitor all network interfaces I/O traffic

[hipo@server ~ ] $ sar -n DEV 1


To only monitor a certain network interface lets say loopback interface (127.0.0.1) received / transmitted bytes

[hipo@server yum.repos.d] $  sar -n DEV 1 2|grep -i lo
06:29:53 PM        lo      0.00      0.00      0.00      0.00      0.00      0.00      0.00      0.00
06:29:54 PM        lo      0.00      0.00      0.00      0.00      0.00      0.00      0.00      0.00
Average:           lo      0.00      0.00      0.00      0.00      0.00      0.00      0.00      0.00


6. Monitor block devices use
 

To check block devices use 3 times in a raw
 

[hipo@server yum.repos.d] $ sar -d 1 3


sar-sysstats-blockdevice-statistics-screenshot
 

7. Output server monitoring data in CSV database structured format


For preparing a nice graphs with Excel from CSV strucuted file format, you can dump the collected data as so:

 [root@server yum.repos.d]# sadf -d /var/log/sa/sa27 — -n DEV | grep -v lo|head -n 10
server-name-fqdn;-1;2021-09-27 13:42:26 UTC;LINUX-RESTART    (8 CPU)
# hostname;interval;timestamp;IFACE;rxpck/s;txpck/s;rxkB/s;txkB/s;rxcmp/s;txcmp/s;rxmcst/s;%ifutil
server-name-fqdn;-1;2021-09-27 13:55:30 UTC;LINUX-RESTART    (8 CPU)
# hostname;interval;timestamp;IFACE;rxpck/s;txpck/s;rxkB/s;txkB/s;rxcmp/s;txcmp/s;rxmcst/s;%ifutil
server-name-fqdn;60;2021-09-27 14:01:01 UTC;eth1;19.42;16.12;1.94;1.68;0.00;0.00;0.00;0.00
server-name-fqdn;60;2021-09-27 14:01:01 UTC;eth0;7.18;9.65;0.55;0.78;0.00;0.00;0.00;0.00
server-name-fqdn;60;2021-09-27 14:01:01 UTC;eth2;5.65;5.13;0.42;0.39;0.00;0.00;0.00;0.00
server-name-fqdn;60;2021-09-27 14:02:01 UTC;eth1;18.90;15.55;1.89;1.60;0.00;0.00;0.00;0.00
server-name-fqdn;60;2021-09-27 14:02:01 UTC;eth0;7.15;9.63;0.55;0.74;0.00;0.00;0.00;0.00
server-name-fqdn;60;2021-09-27 14:02:01 UTC;eth2;5.67;5.15;0.42;0.39;0.00;0.00;0.00;0.00

To graph the output data you can use Excel / LibreOffice's Excel equivalent Calc or if you need to dump a CSV sar output and generate it on the fly from a script  use gnuplot 


What we've learned?


How to install and enable on cron sysstats on Redhat and CentOS 8 Linux ? 
How to continuously monitor CPU / Disk and Network, block devices, paging use and processes and threads used by the kernel per process ?  
As well as how to export previously collected data to CSV to import to database or for later use inrder to generate graphic presentation of data.
Cheers ! 🙂


How to redirect TCP port traffic from Internet Public IP host to remote local LAN server, Redirect traffic for Apache Webserver, MySQL, or other TCP service to remote host

Thursday, September 23rd, 2021


Linux-redirect-forward-tcp-ip-port-traffic-from-internet-to-remote-internet-LAN-IP-server-rinetd-iptables-redir


1. Use the good old times rinetd – internet “redirection server” service


Perhaps, many people who are younger wouldn't remember rinetd's use was pretty common on old Linuxes in the age where iptables was not on the scene and its predecessor ipchains was so common.
In the raise of mass internet rinetd started loosing its popularity because the service was exposed to the outer world and due to security holes and many exploits circulating the script kiddie communities
many servers get hacked "pwned" in the jargon of the script kiddies.

rinetd is still available even in modern Linuxes and over the last years I did not heard any severe security concerns regarding it, but the old paranoia perhaps and the set to oblivion makes it still unpopular soluttion for port redirect today in year 2021.
However for a local secured DMZ lans I can tell you that its use is mostly useful and I chooes to use it myself, everynow and then due to its simplicity to configure and use.
rinetd is pretty standard among unixes and is also available in old Sun OS / Solaris and BSD-es and pretty much everything on the Unix scene.

Below is excerpt from 'man rinetd':


DESCRIPTION
     rinetd redirects TCP connections from one IP address and port to another. rinetd is a single-process server which handles any number of connections to the address/port pairs
     specified in the file /etc/rinetd.conf.  Since rinetd runs as a single process using nonblocking I/O, it is able to redirect a large number of connections without a severe im‐
     pact on the machine. This makes it practical to run TCP services on machines inside an IP masquerading firewall. rinetd does not redirect FTP, because FTP requires more than
     one socket.
     rinetd is typically launched at boot time, using the following syntax:      /usr/sbin/rinetd      The configuration file is found in the file /etc/rinetd.conf, unless another file is specified using the -c command line option.

To use rinetd on any LInux distro you have to install and enable it with apt or yum as usual. For example on my Debian GNU / Linux home machine to use it I had to install .deb package, enable and start it it via systemd :


server:~# apt install –yes rinetd

server:~#  systemctl enable rinetd


server:~#  systemctl start rinetd


server:~#  systemctl status rinetd
● rinetd.service
   Loaded: loaded (/etc/init.d/rinetd; generated)
   Active: active (running) since Tue 2021-09-21 10:48:20 EEST; 2 days ago
     Docs: man:systemd-sysv-generator(8)
    Tasks: 1 (limit: 4915)
   Memory: 892.0K
   CGroup: /system.slice/rinetd.service
           └─1364 /usr/sbin/rinetd


rinetd is doing the traffic redirect via a separate process daemon, in order for it to function once you have service up check daemon is up as well.

root@server:/home/hipo# ps -ef|grep -i rinet
root       359     1  0 16:10 ?        00:00:00 /usr/sbin/rinetd
root       824 26430  0 16:10 pts/0    00:00:00 grep -i rinet

+ Configuring a new port redirect with rinetd


Is pretty straight forward everything is handled via one single configuration – /etc/rinetd.conf

The format (syntax) of a forwarding rule is as follows:

     [bindaddress] [bindport] [connectaddress] [connectport]


Besides that rinetd , could be used as a primitive firewall substitute to iptables, general syntax of allow deny an IP address is done with (allow, deny) keywords:
 

allow 192.168.2.*
deny 192.168.2.1?


To enable logging to external file ,you'll have to include in the configuration:

# logging information
logfile /var/log/rinetd.log

Here is an example rinetd.conf configuration, redirecting tcp mysql 3306, nginx on port 80 and a second web service frontend for ILO to server reachable via port 8888 and a redirect from External IP to local IP SMTP server.


#
# this is the configuration file for rinetd, the internet redirection server
#
# you may specify global allow and deny rules here
# only ip addresses are matched, hostnames cannot be specified here
# the wildcards you may use are * and ?
#
# allow 192.168.2.*
# deny 192.168.2.1?


#
# forwarding rules come here
#
# you may specify allow and deny rules after a specific forwarding rule
# to apply to only that forwarding rule
#
# bindadress    bindport  connectaddress  connectport


# logging information
logfile /var/log/rinetd.log
83.228.93.76        80            192.168.0.20       80
192.168.0.2        3306            192.168.0.19        3306
83.228.93.76        443            192.168.0.20       443
# enable for access to ILO
83.228.93.76        8888            192.168.1.25 443

127.0.0.1    25    192.168.0.19    25


83.228.93.76 is my external ( Public )  IP internet address where 192.168.0.20, 192.168.0.19, 192.168.0.20 (are the DMZ-ed Lan internal IPs) with various services.

To identify the services for which rinetd is properly configured to redirect / forward traffic you can see it with netstat or the newer ss command
 

root@server:/home/hipo# netstat -tap|grep -i rinet
tcp        0      0 www.pc-freak.net:8888   0.0.0.0:*               LISTEN      13511/rinetd      
tcp        0      0 www.pc-freak.n:http-alt 0.0.0.0:*               LISTEN      21176/rinetd        
tcp        0      0 www.pc-freak.net:443   0.0.0.0:*               LISTEN      21176/rinetd      


+ Using rinetd to redirect External interface IP to loopback's port (127.0.0.1)


If you have the need to redirect an External connectable living service be it apache mysql / privoxy / squid or whatever rinetd is perhaps the tool of choice (especially since there is no way to do it with iptables.

If you want to redirect all traffic which is accessed via Linux's loopback interface (localhost) to be reaching a remote host 11.5.8.1 on TCP port 1083 and 1888, use below config

# bindadress    bindport  connectaddress  connectport
11.5.8.1        1083            127.0.0.1       1083
11.5.8.1        1888            127.0.0.1       1888


For a quick and dirty solution to redirect traffic rinetd is very useful, however you'll have to keep in mind that if you want to redirect traffic for tens of thousands of connections constantly originating from the internet you might end up with some disconnects as well as notice a increased use of rinetd CPU use with the incrased number of forwarded connections.


2. Redirect TCP / IP port using DNAT iptables firewall rules


Lets say you have some proxy, webservice or whatever service running on port 5900 to be redirected with iptables.
The easeiest legacy way is to simply add the redirection rules to /etc/rc.local​. In newer Linuxes rc.local so if you decide to use,
you'll have to enable rc.local , I've written earlier a short article on how to enable rc.local on newer Debian, Fedora, CentOS


# redirect 5900 TCP service 
sysctl -w net.ipv4.conf.all.route_localnet=1
iptables -t nat -I PREROUTING -p tcp –dport 5900 -j REDIRECT –to-ports 5900
iptables -t nat -I OUTPUT -p tcp -o lo –dport 5900 -j REDIRECT –to-ports 5900
iptables -t nat -A OUTPUT -o lo -d 127.0.0.1 -p tcp –dport 5900 -j DNAT  –to-destination 192.168.1.8:5900
iptables -t nat -I OUTPUT –source 0/0 –destination 0/0 -p tcp –dport 5900 -j REDIRECT –to-ports 5900


Here is another two example which redirects port 2208 (which has configured a bind listener for SSH on Internal host 192.168.0.209:2208) from External Internet IP address (XXX.YYY.ZZZ.XYZ) 
 

# Port redirect for SSH to VM on openxen internal Local lan server 192.168.0.209 
-A PREROUTING  -p tcp –dport 2208 -j DNAT –to-destination 192.168.0.209:2208
-A POSTROUTING -p tcp –dst 192.168.0.209 –dport 2208 -j SNAT –to-source 83.228.93.76


3. Redirect TCP traffic connections with redir tool


If you look for an easy straight forward way to redirect TCP traffic, installing and using redir (ready compiled program) might be a good idea.


root@server:~# apt-cache show redir|grep -i desc -A5 -B5
Version: 3.2-1
Installed-Size: 60
Maintainer: Lucas Kanashiro <kanashiro@debian.org>
Architecture: amd64
Depends: libc6 (>= 2.15)
Description-en: Redirect TCP connections
 It can run under inetd or stand alone (in which case it handles multiple
 connections).  It is 8 bit clean, not limited to line mode, is small and
 light. Supports transparency, FTP redirects, http proxying, NAT and bandwidth
 limiting.
 .
 redir is all you need to redirect traffic across firewalls that authenticate
 based on an IP address etc. No need for the firewall toolkit. The
 functionality of inetd/tcpd and "redir" will allow you to do everything you
 need without screwy telnet/ftp etc gateways. (I assume you are running IP
 Masquerading of course.)

Description-md5: 2089a3403d126a5a0bcf29b22b68406d
Homepage: https://github.com/troglobit/redir
Tag: interface::daemon, network::server, network::service, role::program,
 use::proxying
Section: net
Priority: optional


server:~# apt-get install –yes redir

Here is a short description taken from its man page 'man redir'


DESCRIPTION
     redir redirects TCP connections coming in on a local port, [SRC]:PORT, to a specified address/port combination, [DST]:PORT.  Both the SRC and DST arguments can be left out,
     redir will then use 0.0.0.0.

     redir can be run either from inetd or as a standalone daemon.  In –inetd mode the listening SRC:PORT combo is handled by another process, usually inetd, and a connected
     socket is handed over to redir via stdin.  Hence only [DST]:PORT is required in –inetd mode.  In standalone mode redir can run either in the foreground, -n, or in the back‐
     ground, detached like a proper UNIX daemon.  This is the default.  When running in the foreground log messages are also printed to stderr, unless the -s flag is given.

     Depending on how redir was compiled, not all options may be available.


+ Use redir to redirect TCP traffic one time


Lets say you have a MySQL running on remote machine on some internal or external IP address, lets say 192.168.0.200 and you want to redirect all traffic from remote host to the machine (192.168.0.50), where you run your Apache Webserver, which you want to configure to use
as MySQL localhost TCP port 3306.

Assuming there are no irewall restrictions between Host A (192.168.0.50) and Host B (192.168.0.200) is already permitting connectivity on TCP/IP port 3306 between the two machines.

To open redirection from localhost on 192.168.0.50 -> 192.168.0.200:


server:~# redir –laddr=127.0.0.1 –lport=3306 –caddr=192.168.0.200 –cport=3306


If you need other third party hosts to be additionally reaching 192.168.0.200 via 192.168.0.50 TCP 3306.

root@server:~# redir –laddr=192.168.0.50 –lport=3306 –caddr=192.168.0.200 –cport=3306


Of course once you close, the /dev/tty or /dev/vty console the connection redirect will be cancelled.


+ Making TCP port forwarding from Host A to Host B permanent


One solution to make the redir setup rules permanent is to use –rinetd option or simply background the process, nevertheless I prefer to use instead GNU Screen.
If you don't know screen is a vVrtual Console Emulation manager with VT100/ANSI terminal emulation to so, if you don't have screen present on the host install it with whatever Linux OS package manager is present and run:


root@server:~#screen -dm bash -c 'redir –laddr=127.0.0.1 –lport=3306 –caddr=192.168.0.200 –cport=3306'


That would run it into screen session and detach so you can later connect, if you want you can make redir to also log connections via syslog with ( -s) option.

I found also useful to be able to track real time what's going on currently with the opened redirect socket by changing redir log level.

Accepted log level is:


  -l, –loglevel=LEVEL
             Set log level: none, err, notice, info, debug.  Default is notice.


root@server:/ # screen -dm bash -c 'redir –laddr=127.0.0.1 –lport=3308 –caddr=192.168.0.200 –cport=3306 -l debug'


To test connectivity works as expected use telnet:
 

root@server:/ # telnet localhost 3308
Trying 127.0.0.1…
Connected to localhost.
Escape character is '^]'.
g
5.5.5-10.3.29-MariaDB-0+deb10u1-log�+c2nWG>B���o+#ly=bT^]79mysql_native_password

6#HY000Proxy header is not accepted from 192.168.0.19 Connection closed by foreign host.

once you attach to screen session with


root@server:/home #  screen -r


You will get connectivity attempt from localhost logged : .
 

redir[10640]: listening on 127.0.0.1:3306
redir[10640]: target is 192.168.0.200:3306
redir[10640]: Waiting for client to connect on server socket …
redir[10640]: target is 192.168.0.200:3306
redir[10640]: Waiting for client to connect on server socket …
redir[10793]: peer IP is 127.0.0.1
redir[10793]: peer socket is 25592
redir[10793]: target IP address is 192.168.0.200
redir[10793]: target port is 3306
redir[10793]: Connecting 127.0.0.1:25592 to 127.0.0.1:3306
redir[10793]: Entering copyloop() – timeout is 0
redir[10793]: Disconnect after 1 sec, 165 bytes in, 4 bytes out

The downsides of using redir is redirection is handled by the separate process which is all time hanging in the process list, as well as the connection redirection speed of incoming connections might be about at least 30% slower to if you simply use a software (firewall ) redirect such as iptables. If you use something like kernel IP set ( ipsets ). If you hear of ipset for a first time and you wander whta it is below is short package description.


root@server:/root# apt-cache show ipset|grep -i description -A13 -B5
Maintainer: Debian Netfilter Packaging Team <pkg-netfilter-team@lists.alioth.debian.org>
Architecture: amd64
Provides: ipset-6.38
Depends: iptables, libc6 (>= 2.4), libipset11 (>= 6.38-1~)
Breaks: xtables-addons-common (<< 1.41~)
Description-en: administration tool for kernel IP sets
 IP sets are a framework inside the Linux 2.4.x and 2.6.x kernel which can be
 administered by the ipset(8) utility. Depending on the type, currently an
 IP set may store IP addresses, (TCP/UDP) port numbers or IP addresses with
 MAC addresses in a  way which ensures lightning speed when matching an
 entry against a set.
 .
 If you want to
 .
  * store multiple IP addresses or port numbers and match against the
    entire collection using a single iptables rule.
  * dynamically update iptables rules against IP addresses or ports without
    performance penalty.
  * express complex IP address and ports based rulesets with a single
    iptables rule and benefit from the speed of IP sets.

 .
 then IP sets may be the proper tool for you.
Description-md5: d87e199641d9d6fbb0e52a65cf412bde
Homepage: http://ipset.netfilter.org/
Tag: implemented-in::c, role::program
Section: net
Priority: optional
Filename: pool/main/i/ipset/ipset_6.38-1.2_amd64.deb
Size: 50684
MD5sum: 095760c5db23552a9ae180bd58bc8efb
SHA256: 2e2d1c3d494fe32755324bf040ffcb614cf180327736c22168b4ddf51d462522

Fix Out of inodes on Postfix Linux Mail Cluster. How to clean up filesystem running out of Inodes, Filesystem inodes on partition is 100% full

Wednesday, August 25th, 2021

Inode_Entry_inode-table-content

Recently we have faced a strange issue with with one of our Clustered Postfix Mail servers (the cluster is with 2 nodes that each has configured Postfix daemon mail servers (running on an OpenVZ virtualized environment).
A heartbeat that checks liveability of clusters and switches nodes in case of one of the two gets broken due to some reason), pretty much a standard SMTP cluster.

So far so good but since the cluster is a kind of abondoned and is pretty much legacy nowadays and used just for some Monitoring emails from different scripts and systems on servers, it was not really checked thoroughfully for years and logically out of sudden the alarming email content sent via the cluster stopped working.

The normal sysadmin job here  was to analyze what is going on with the cluster and fix it ASAP. After some very basic analyzing we catched the problem is caused by a  "inodes full" (100% of available inodes were occupied) problem, e.g. file system run out of inodes on both machines perhaps due to a pengine heartbeat process  bug  leading to producing a high number of .bz2 pengine recovery archive files stored in /var/lib/pengine>

Below are the few steps taken to analyze and fix the problem.
 

1. Finding out about the the system run out of inodes problem


After logging on to system and not finding something immediately is wrong with inodes, all I can see from crm_mon is cluster was broken.
A plenty of emails were left inside the postfix mail queue visible with a standard command

[root@smtp1: ~ ]# postqueue -p

It took me a while to find ot the problem is with inodes because a simple df -h  was showing systems have enough space but still cluster quorum was not complete.
A bit of further investigation led me to a  simple df -i reporting the number of inodes on the local filesystems on both our SMTP1 and SMTP2 got all occupied.

[root@smtp1: ~ ]# df -i
Filesystem            Inodes   IUsed   IFree IUse% Mounted on
/dev/simfs            500000   500000  0   100% /
none                   65536      61   65475    1% /dev

As you can see the number of inodes on the Virual Machine are unfortunately depleted

Next step was to check directories occupying most inodes, as this is the place from where files could be temporary moved to a remote server filesystem or moved to another partition with space on a server locally attached drives.
Below command gives an ordered list with directories locally under the mail root filesystem / and its respective occupied number files / inodes,
the more files under a directory the more inodes are being occupied by the files on the filesystem.


run-out-if-inodes-what-is-inode-find-out-which-filesystem-or-directory-eating-up-all-your-system-inodes-linux_inode_diagram.gif
1.1 Getting which directory consumes most of the inodes on the systems


[root@smtp1: ~ ]# { find / -xdev -printf '%h\n' | sort | uniq -c | sort -k 1 -n; } 2>/dev/null
….
…..

…….
    586 /usr/lib64/python2.4
    664 /usr/lib64
    671 /usr/share/man/man8
    860 /usr/bin
   1006 /usr/share/man/man1
   1124 /usr/share/man/man3p
   1246 /var/lib/Pegasus/prev_repository_2009-03-10-1236698426.308128000.rpmsave/root#cimv2/classes
   1246 /var/lib/Pegasus/prev_repository_2009-05-18-1242636104.524113000.rpmsave/root#cimv2/classes
   1246 /var/lib/Pegasus/prev_repository_2009-11-06-1257494054.380244000.rpmsave/root#cimv2/classes
   1246 /var/lib/Pegasus/prev_repository_2010-08-04-1280907760.750543000.rpmsave/root#cimv2/classes
   1381 /var/lib/Pegasus/prev_repository_2010-11-15-1289811714.398469000.rpmsave/root#cimv2/classes
   1381 /var/lib/Pegasus/prev_repository_2012-03-19-1332151633.572875000.rpmsave/root#cimv2/classes
   1398 /var/lib/Pegasus/repository/root#cimv2/classes
   1696 /usr/share/man/man3
   400816 /var/lib/pengine

Note, the above command orders the files from bottom to top order and obviosuly the bottleneck directory that is over-eating Filesystem inodes with an exceeding amount of files is
/var/lib/pengine
 

2. Backup old multitude of files just in case of something goes wrong with the cluster after some files are wiped out


The next logical step of course is to check what is going on inside /var/lib/pengine just to find a very ,very large amount of pe-input-*NUMBER*.bz2 files were suddenly produced.


[root@smtp1: ~ ]# ls -1 pe-input*.bz2 | wc -l
 400816


The files are produced by the pengine process which is one of the processes that is controlling the heartbeat cluster state, presumably it is done by running process:

[root@smtp1: ~ ]# ps -ef|grep -i pengine
24        5649  5521  0 Aug10 ?        00:00:26 /usr/lib64/heartbeat/pengine


Hence in order to fix the issue, to prevent some inconsistencies in the cluster due to the file deletion,  copied the whole directory to another mounted parition (you can mount it remotely with sshfs for example) or use a local one if you have one:

[root@smtp1: ~ ]# cp -rpf /var/lib/pengine /mnt/attached_storage


and proceeded to clean up some old multitde of files that are older than 2 years of times (720 days):


3. Clean  up /var/lib/pengine files that are older than two years with short loop and find command


First I made a list with all the files to be removed in external text file and quickly reviewed it by lessing it like so

[root@smtp1: ~ ]#  cd /var/lib/pengine
[root@smtp1: ~ ]# find . -type f -mtime +720|grep -v pe-error.last | grep -v pe-input.last |grep -v pe-warn.last -fprint /home/myuser/pengine_older_than_720days.txt
[root@smtp1: ~ ]# less /home/myuser/pengine_older_than_720days.txt


Once reviewing commands I've used below command to delete the files you can run below command do delete all older than 2 years that are different from pe-error.last / pe-input.last / pre-warn.last which might be needed for proper cluster operation.

[root@smtp1: ~ ]#  for i in $(find . -type f -mtime +720 -exec echo '{}' \;|grep -v pe-error.last | grep -v pe-input.last |grep -v pe-warn.last); do echo $i; done


Another approach to the situation is to simply review all the files inside /var/lib/pengine and delete files based on year of creation, for example to delete all files in /var/lib/pengine from 2010, you can run something like:
 

[root@smtp1: ~ ]# for i in $(ls -al|grep -i ' 2010 ' | awk '{ print $9 }' |grep -v 'pe-warn.last'); do rm -f $i; done


4. Monitor real time inodes freeing

While doing the clerance of old unnecessery pengine heartbeat archives you can open another ssh console to the server and view how the inodes gets freed up with a command like:


# check if inodes is not being rapidly decreased

[root@csmtp1: ~ ]# watch 'df -i'


5. Restart basic Linux services producing pid files and logs etc. to make then workable (some services might not be notified the inodes on the Hard drive are freed up)

Because the hard drive on the system was full some services started to misbehaving and /var/log logging was impacted so I had to also restart them in our case this is the heartbeat itself
that  checks clusters nodes availability as well as the logging daemon service rsyslog


# restart rsyslog and heartbeat services
[root@csmtp1: ~ ]# /etc/init.d/heartbeat restart
[root@csmtp1: ~ ]# /etc/init.d/rsyslog restart

The systems had been a data integrity legacy service samhain so I had to restart this service as well to reforce the /var/log/samhain log file to again continusly start writting data to HDD.

# Restart samhain service init script 
[root@csmtp1: ~ ]# /etc/init.d/samhain restart


6. Check up enough inodes are freed up with df

[root@smtp1 log]# df -i
Filesystem Inodes IUsed IFree IUse% Mounted on
/dev/simfs 500000 410531 19469 91% /
none 65536 61 65475 1% /dev


I had to repeat the same process on the second Postfix cluster node smtp2, and after all the steps like below check the status of smtp2 node and the postfix queue, following same procedure made the second smtp2 cluster member as expected 🙂


7. Check the cluster node quorum is complete, e.g. postfix cluster is operating normally


# Test if email cluster is ok with pacemaker resource cluster manager – lt-crm_mon
 

[root@csmtp1: ~ ]# crm_mon -1
============
Last updated: Tue Aug 10 18:10:48 2021
Stack: Heartbeat
Current DC: smtp2.fqdn.com (bfb3d029-89a8-41f6-a9f0-52d377cacd83) – partition with quorum
Version: 1.0.12-unknown
2 Nodes configured, unknown expected votes
4 Resources configured.
============

Online: [ smtp2.fqdn.com smtp1.fqdn.com ]

failover-ip (ocf::heartbeat:IPaddr2): Started csmtp1.ikossvan.de
Clone Set: postfix_clone
Started: [ smtp2.fqdn.com smtp1fqdn.com ]
Clone Set: pingd_clone
Started: [ smtp2.fqdn.com smtp1.fqdn.com ]
Clone Set: mailto_clone
Started: [ smtp2.fqdn.com smtp1.fqdn.com ]


8.  Force resend a few hundred thousands of emails left in the email queue


After some inodes gets freed up due to the file deletion, i've reforced a couple of times the queued mail servers to be immediately resent to remote mail destinations with cmd:


# force emails in queue to be resend with postfix

[root@smtp1: ~ ]# sendmail -q


– It was useful to watch in real time how the queued emails are quickly decreased (queued mails are successfully sent to destination addresses) with:


# Monitor  the decereasing size of the email queue
[root@smtp1: ~ ]# watch 'postqueue -p|grep -i '@'|wc -l'

The Dormition of Virgin Mary the Mother of the Lord Jesus Christ, the Eastern Orthodox Church view and few words on feast origin

Tuesday, August 17th, 2021

Dormition-of-Mother-of-God-Koimesis_Greek_Mosaic_at_Chora_Church_Constantinople

Dormition of the Mother of God is a feast highly venerated in both Eastern Orthodox Churches as well as Oriental Orthodox Churches (The Coptic Church and the Armenian Apostolic Church which venerated the feast not on a fixed date), whether the rest of Orthodox world do celebrate on 15 of August the Dormition of the Mother of God. The so called old calendar Churches do celebrate the feast on 28 of August as the old church calendar coincides with this date on the public national calendar the countries use nowadays, whether some of the Churches such as our Bulgarian Orthodox Church, the Romanian Orthodox Church as well the Greek orthodox Church do celebarete on 15 of August.

Dormition_de_la_Vierge-stone-icon


The feast is one of the major Church feasts also in Western Roman Cathic church world known as the Assumption of Mary. The way the feast is venerated varyies, but it is important to say this feast is "The Summer Easter of the Church". In the ancient times the feast has been preceded in the Church by two fastings one for the Transfiguration of God Lord Jesus Christ that was venerated on 6th of August and one week fast preceding the Dormition or the Sleeping like death called in Church Slavonic Uspenie (falling asleep) that the Mother of God experineced before her righteous Soul passed to the Lord Jesus Christ. The painless death of the Mother of God has occured according to the Byzantine author Hypollitos of Thebes who lived in VIII centuryin 41 A.D., 11 years after Jesus's Crucifix and Glorious Resurrection.

Dormition_of_the_Mother_of_God_Bulgarian-icon-from_year-1893

Bulgarian icon from year 1893

The Dormition term expresses the Church belief that Virgin Mary on her death bed has been in a completely peaceful state of the Soul that and did not suffered the terrible pains of death and division of soul and body that each of us the sinners faces because of her extraordinary righteousness and as a blessing of Christ for the ever Virgin, because of her humility and life lived in service of God, and poor and every of her near sides and for her unceasing prayer for the world that she attained even during her earthly life time. The belief of Dormition is not a Bible found doctrine but a Church tradiiton and due to that protestant do not consider it as of a high value but we orthodox firmly believe this was not mention in the bible, because the Mother of God herself unwillingness for glory because she found unworthy compared to the great miracles life, suffering and salvationory plan Jesus completed. The dormition of Mother of God is found in many of Apocryphal writtings which never become official part of the Church canon.

In the language of the scripture, death is often called a "sleeping" or "falling asleep" (Greek κοίμησις; whence κοιμητήριον > coemetērium > cemetery, "a place of sleeping"). A prominent example of this is the name of this feast; another is the Dormition of Anna, Mary's mother.

The first Christian centuries may be silent, but "The Dormition/Assumption of Mary" appears in a Greek document (attributed to John the Theologian) edited by Tischendorf published in The Ante-Nicene Fathers, dated by Tischendorf as no later than the 4th century. Then there is the apocryphal literature such as the Protoevangelium of James, regarding the end of the Virgin Mary's life, though it is asserted, without surviving documentation, that the feast of the Dormition was being observed in Jerusalem shortly after the Council of Ephesus.

Gracanica_Monastery_Serbia-Dormition-of-The-Mother-of-God-Virgin_Mary

Dormition of the Mother of God, fresco from Gračanica, c. 1321. (See also:Palaiologian Renaissance)

Before the 4th-5th century Dormition was not celebrated among the Christians as a holy day and earlier it was perhaps not celebrated because the Church did not have time to celebrate too much of special feasts, as there was the era of heretics and gnostics from 1st –  2nd centuries which give birth to multiple heresies and the era of persecution that ended just about the 4th century. Only then the Church posessing freedom in the world could review its belief and clearly define the faith as earlier both Bishops (the apostle successors as the layman) was mostly busy with each one keeping their own faith instead of clearly documenting or giving separate feasts, until the 4th century many of the Church feasts of the martyr saints were still not recognized and known in the "Universal" Church around the world, because travelling was not so common as nowadays and each local established church by apostles strives to keep their faith in Christ and not clear up Church dogmas (this gave raise of course to the VII ecumenical councels who followed from 3rd to 8 centuries.).
 

Epiphanius of Salamis who become bishop of Salamis toda's Cypros (circa 310/20 – 403), a Jew by birth, born in Phoenicia, converted to Christianity in adulthood and lived as a monk for over 20 years in Palestine from 335–340 to 362, writes in "Panarion" (his book on Herisology) in "Contra antidicomarianitas" about the death of the Virgin Mary the following:


"If any think am mistaken, moreover, let them search through the scriptures any neither find Mary's death, nor whether or not she died, nor whether or not she was buried—even though John surely travelled throughout Asia. And yet, nowhere does he say that he took the holy Virgin with him. Scripture simply kept silence because of the overwhelming wonder, not to throw men's minds into consternation. For I dare not say—though I have my suspicions, I keep silent. Perhaps, just as her death is not to be found, so I may have found some traces of the holy and blessed Virgin. …The holy virgin may have died and been buried—her falling asleep was with honour, her death in purity, her crown in virginity. Or she may have been put to death—as the scripture says, 'And a sword shall pierce through her soul'—her fame is among the martyrs and her holy body, by which light rose on the world, [rests] amid blessings. Or she may have remained alive, for God is not incapable of doing whatever he wills. No one knows her end. But we must not honour the saints to excess; we must honour their Master. It is time for the error of those who have gone astray to cease."


Saint Ambrosius of Milan ( Mediolan ) in 4th century says:

"Neither the letter of Scripture nor Tradition does not teach us that Mary had left this life as a consequence of suffering from bodily ulcers." pointing to her sufferless sleep like death.

Holy_Mother-of-God-Arbanasi-Monastery-three-handed-Troeruchica-Miracle-Making-icon-Bulgaria-Great_Tarnovo

The famous icon Holy Mother of God Three-handed (Troeruchica) Arbanasi Monastery of the Dormition of Mother of God near medieval capital of Bulgaria Veliko Tarnovo

Our Orthodox Church specifically holds,teaching that Mary died a natural death, like any human being; that her soul was received by Christ upon death; and that her body was resurrect on the third day after her repose, at which time she was taken up, bodily only, into heaven when the apostles, miraculously transported from the ends of the earth, found her tomb to be empty. The specific belief of us Orthodox is expressed in their liturgical texts used at the feast of the Dormition.

Mount-Olives-Marys-burial-tomb-entrane-to-tomb
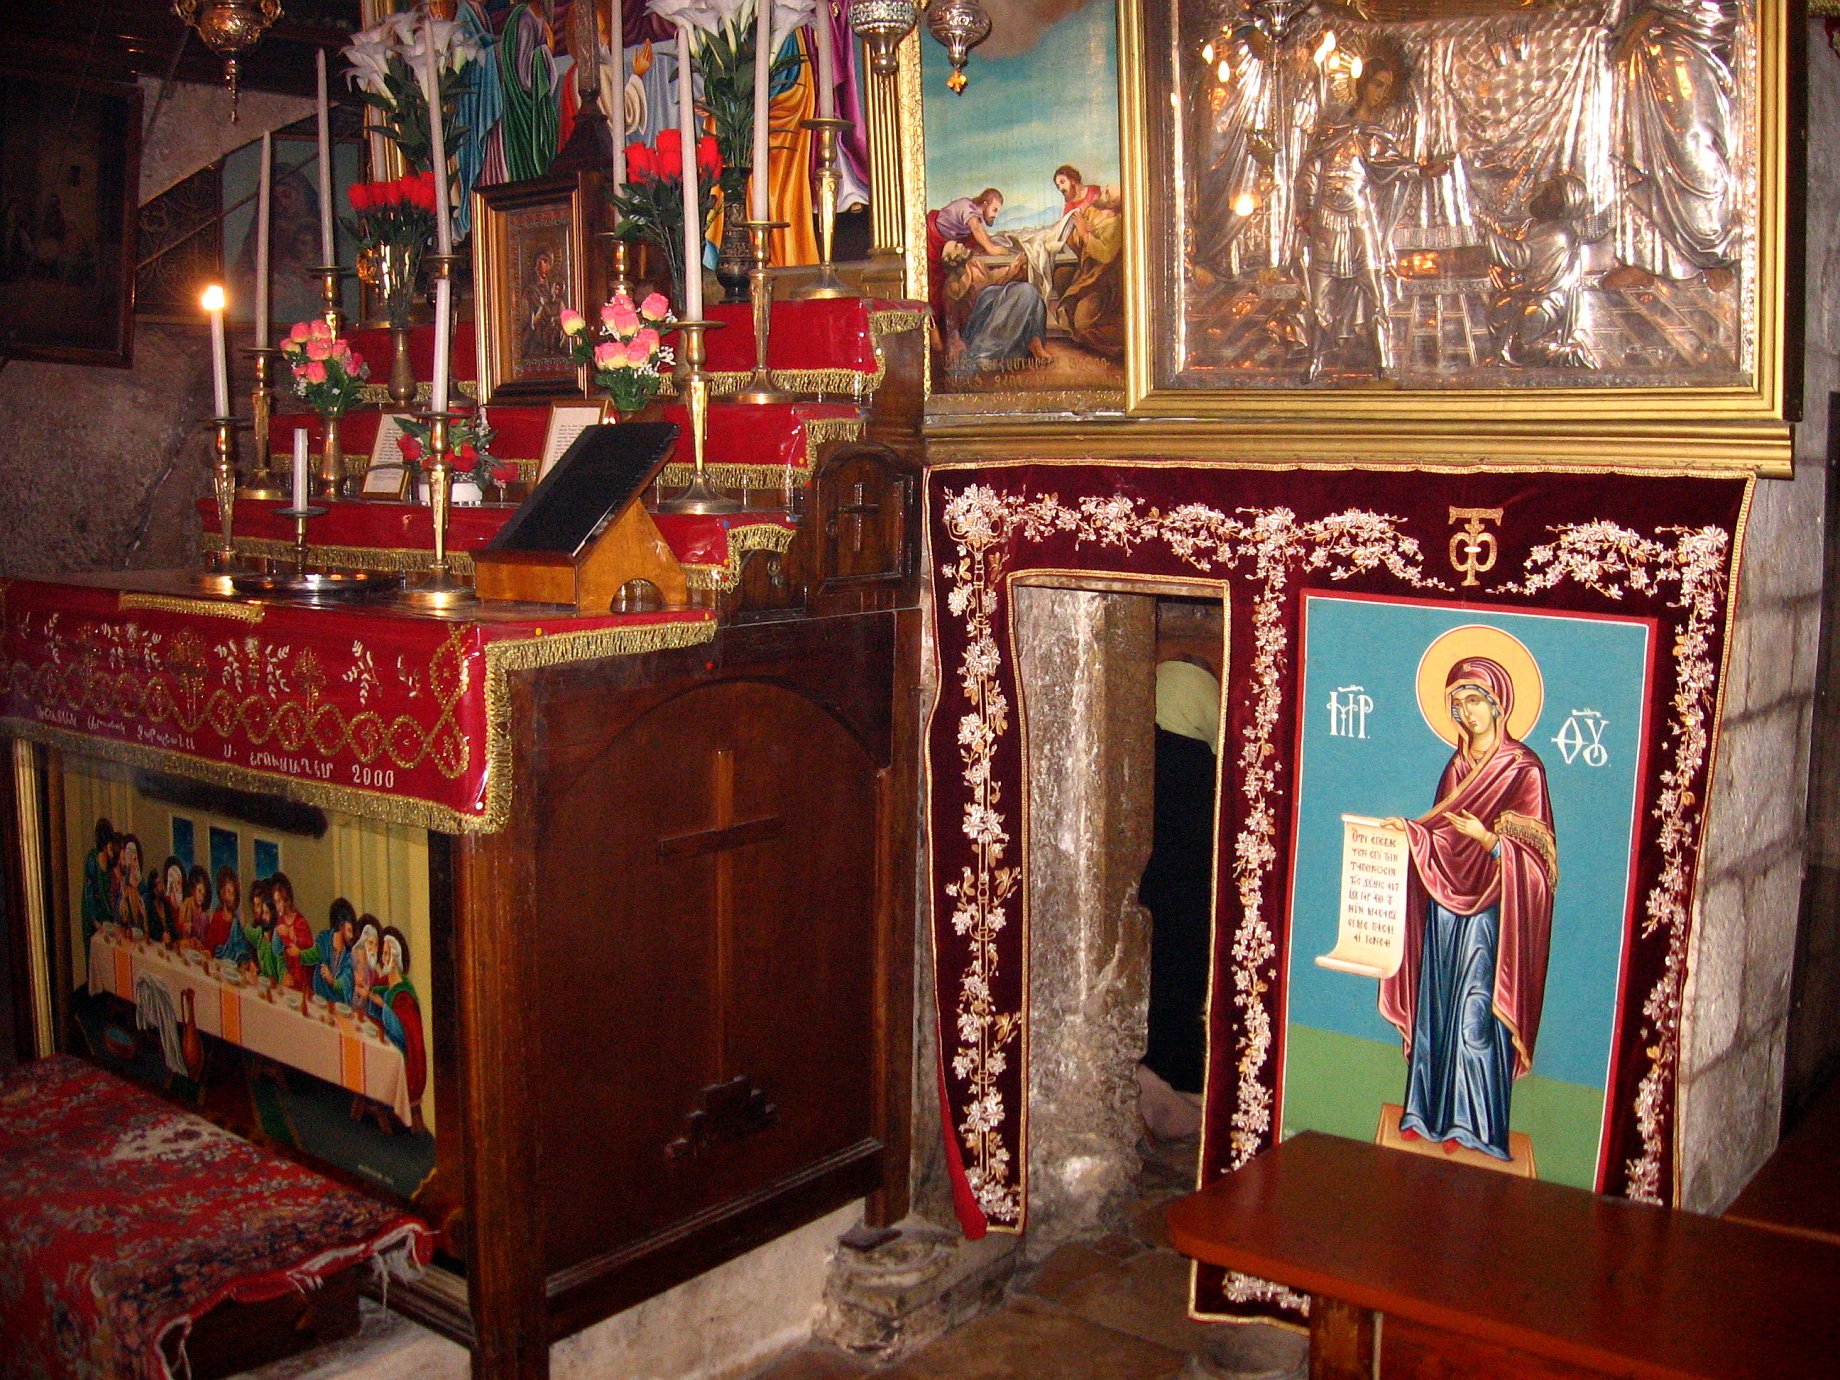
The rock-cut Tomb of Virgin Mary and its entrance, its front side covered in icons; eastern apse of the crypt


The holy body that was taken in Heaven after the Virgin's resurrection 3 days after her Dormition has been originally placed after the burial procession in 41 A.D. in the Church of the Sepulchre of Saint Mary, also known as the Tomb of the Virgin Mary (Hebrew: קבר מרים‎; Greek: Τάφος της Παναγίας) it is located (identified) by historians in the Kidron Valley – at the foot of Mount of Olives, in Jerusalem.

The-stone-bench-on-which-Virgin-Marys-most-pure-body-was-laid-out-Jerusalem-mary-sarcophagus
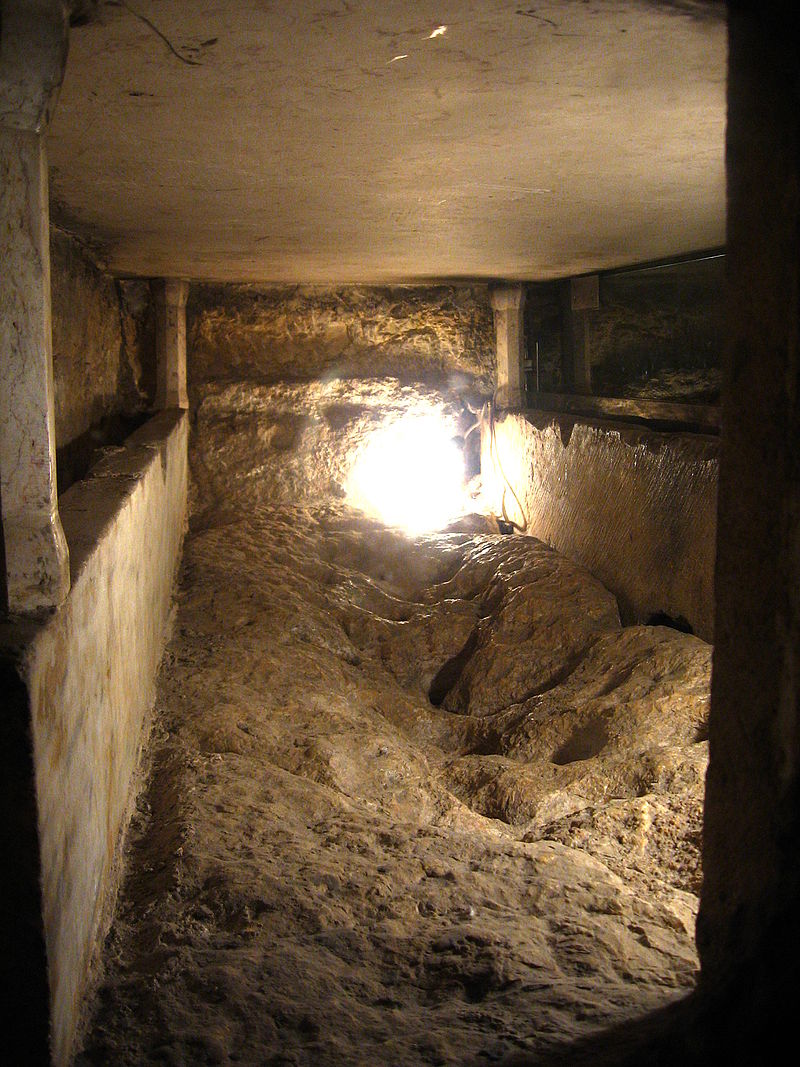
The stone bench on which the most pure body of the Virgin Mary (Theotokos) has been laid out


Let by the Holy Prayers of The Virgin Mary Theotokos, we find grace and God grants mercy upon anyone in torture, in fear in bitterness and sorrows, in weakness and sickness, to all broken-hearted, to all the leppers and mind sick and who lay on the death beds be granted with a painless death similar to hers.

Let the Mother of God keep and protect the Holy Land of Bulgaria and All The Orthodox Lands and the rest of lands, villages, cities and all inhabitants on earth !!! AMEN


Linux: Howto Fix “N: Repository ‘http://deb.debian.org/debian buster InRelease’ changed its ‘Version’ value from ‘10.9’ to ‘10.10’” error to resolve apt-get release update issue

Friday, August 13th, 2021

Linux's surprises and disorganization is continuously growing day by day and I start to realize it is becoming mostly impossible to support easily this piece of hackware bundled together.
Usually so far during the last 5 – 7 years, I rarely had any general issues with using:

 apt-get update && apt-get upgrade && apt-get dist-upgrade 

to raise a server's working stable Debian Linux version packages e.g. version X.Y to verzion X.Z (for example up the release from Debian Jessie from 8.1 to 8.2). 

Today I just tried to follow this well known and established procedure that, of course nowdays is better to be done with the newer "apt" command instead with the legacy "apt-get"
And the set of 


# apt-get update && apt-get upgrade && apt-get dist-upgrade


has triggered below shitty error:
 

root@zabbix:~# apt-get update && apt-get upgrade
Get:1 http://security.debian.org buster/updates InRelease [65.4 kB]
Get:2 http://deb.debian.org/debian buster InRelease [122 kB]
Get:3 http://security.debian.org buster/updates/non-free Sources [688 B]
Get:4 http://repo.zabbix.com/zabbix/5.0/debian buster InRelease [7096 B]
Get:5 http://security.debian.org buster/updates/main Sources [198 kB]
Get:6 http://security.debian.org buster/updates/main amd64 Packages [300 kB]
Get:7 http://security.debian.org buster/updates/main Translation-en [157 kB]
Get:8 http://security.debian.org buster/updates/non-free amd64 Packages [556 B]
Get:9 http://deb.debian.org/debian buster/main Sources [7836 kB]
Get:10 http://repo.zabbix.com/zabbix/5.0/debian buster/main Sources [1192 B]
Get:11 http://repo.zabbix.com/zabbix/5.0/debian buster/main amd64 Packages [4785 B]
Get:12 http://deb.debian.org/debian buster/non-free Sources [85.7 kB]
Get:13 http://deb.debian.org/debian buster/contrib Sources [42.5 kB]
Get:14 http://deb.debian.org/debian buster/main amd64 Packages [7907 kB]
Get:15 http://deb.debian.org/debian buster/main Translation-en [5968 kB]
Get:16 http://deb.debian.org/debian buster/main amd64 Contents (deb) [37.3 MB]
Get:17 http://deb.debian.org/debian buster/contrib amd64 Packages [50.1 kB]
Get:18 http://deb.debian.org/debian buster/non-free amd64 Packages [87.7 kB]
Get:19 http://deb.debian.org/debian buster/non-free Translation-en [88.9 kB]
Get:20 http://deb.debian.org/debian buster/non-free amd64 Contents (deb) [861 kB]
Fetched 61.1 MB in 22s (2774 kB/s)
Reading package lists… Done
N: Repository 'http://deb.debian.org/debian buster InRelease' changed its 'Version' value from '10.9' to '10.10'


As I used to realize nowdays, as Linux started originally as 'Hackers' operating system, its legacy is just one big hack and everything from simple maintenance up to the higher and more sophisticated things requires a workaround 'hack''.


This time the hack to resolve error:
 

N: Repository 'http://deb.debian.org/debian buster InRelease' changed its 'Version' value from '10.9' to '10.10'


is up to running cmd:
 

debian-server:~# apt-get update –allow-releaseinfo-change
Поп:1 http://ftp.de.debian.org/debian buster-backports InRelease
Поп:2 http://ftp.debian.org/debian stable InRelease
Поп:3 http://security.debian.org stable/updates InRelease
Изт:5 https://packages.sury.org/php buster InRelease [6837 B]
Изт:6 https://download.docker.com/linux/debian stretch InRelease [44,8 kB]
Изт:7 https://packages.sury.org/php buster/main amd64 Packages [317 kB]
Игн:4 https://attic.owncloud.org/download/repositories/production/Debian_10  InRelease
Изт:8 https://download.owncloud.org/download/repositories/production/Debian_10  Release [964 B]
Изт:9 https://packages.sury.org/php buster/main i386 Packages [314 kB]
Изт:10 https://download.owncloud.org/download/repositories/production/Debian_10  Release.gpg [481 B]
Грш:10 https://download.owncloud.org/download/repositories/production/Debian_10  Release.gpg
  Следните подписи са невалидни: DDA2C105C4B73A6649AD2BBD47AE7F72479BC94B
Грш:11 https://ookla.bintray.com/debian generic InRelease
  403  Forbidden [IP: 52.39.193.126 443]
Четене на списъците с пакети… Готово
N: Repository 'https://packages.sury.org/php buster InRelease' changed its 'Suite' value from '' to 'buster'
W: An error occurred during the signature verification. The repository is not updated and the previous index files will be used. GPG error: https://download.owncloud.org/download/repositories/production/Debian_10  Release: 

apt-get-update-allow-releaseinfo-change-debian-linux-screenshot

Onwards to upgrade the system up to the latest .deb packages, as usual run:

# apt-get -y update && apt-get upgrade -y


and updates should be applied as usual with some prompts on whether you prefer to keep or replace existing service configuration and some information on some general changes that might affect your installed services. In a few minutes and few prompts hopefully your Debian OS should be up to the latest stable.

How to automate open xen Hypervisor Virtual Machines backups shell script

Tuesday, June 22nd, 2021

openxen-backup-logo As a sysadmin that have my own Open Xen Debian Hypervisor running on a Lenovo ThinkServer few months ago due to a human error I managed to mess up one of my virtual machines and rebuild the Operating System from scratch and restore files service and MySQl data from backup that really pissed me of and this brought the need for having a decent Virtual Machine OpenXen backup solution I can implement on the Debian ( Buster) 10.10 running the free community Open Xen version 4.11.4+107-gef32c7afa2-1. The Hypervisor is a relative small one holding just 7 VM s:

HypervisorHost:~#  xl list
Name                                        ID   Mem VCPUs      State   Time(s)
Domain-0                                     0 11102    24     r—–  214176.4
pcfrxenweb                                  11 12288     4     -b—-  247425.5
pcfrxen                                     12 16384    10     -b—-  1371621.4
windows7                                    20  4096     2     -b—-   97887.2
haproxy2                                    21  4096     2     -b—-   11806.9
jitsi-meet                                  22  2048     2     -b—-   12843.9
zabbix                                      23  2048     2     -b—-   20275.1
centos7                                     24  2040     2     -b—-   10898.2

HypervisorHost:~# xl list|grep -v 'Name ' |grep  -v 'Domain-0'  |wc -l
7


The backup strategy of the script is very simple to shutdown the running VM machine, make a copy with rsync to a backup location the image of each of the Virtual Machines in a bash shell loop for each virtual machine shown in output of xl command and backup to a preset local directory in my case this is /backups/ the backup of each virtual machine is produced within a separate backup directory with a respective timestamp. Backup VM .img files are produced in my case to mounted 2x external attached hard drives each of which is a 4 Terabyte Seagate Plus Backup (Storage). The original version of the script was made to be a slightly different by Zhiqiang Ma whose script I used for a template to come up with my xen VM backup solution. To prevent the Hypervisor's load the script is made to do it with a nice of (nice -n 10) this might be not required or you might want to modify it to better suit your needs. Below is the script itself you can fetch a copy of it /usr/sbin/xen_vm_backups.sh :

#!/bin/bash

# Author: Zhiqiang Ma (http://www.ericzma.com/)
# Modified to work with xl and OpenXen by Georgi Georgiev – https://pc-freak.net
# Original creation dateDec. 27, 2010
# Script takes all defined vms under xen_name_list and prepares backup of each
# after shutting down the machine prepares archive and copies archive in externally attached mounted /backup/disk1 HDD
# Latest update: 08.06.2021 G. Georgiev – hipo@pc-freak.net

mark_file=/backups/disk1/tmp/xen-bak-marker
log_file=/var/log/xen/backups/bak-$(date +%Y_%m_%d).log
err_log_file=/var/log/xen/backups/bak_err-$(date +%H_%M_%Y_%m_%d).log
xen_dir=/xen/domains
xen_vmconfig_dir=/etc/xen/
local_bak_dir=/backups/disk1/tmp
#bak_dir=xenbak@backup_host1:/lhome/xenbak
bak_dir=/backups/disk1/xen-backups/xen_images/$(date +%Y_%m_%d)/xen/domains
#xen_name_list="haproxy2 pcfrxenweb jitsi-meet zabbix windows7 centos7 pcfrxenweb pcfrxen"
xen_name_list="windows7 haproxy2 jitsi-meet zabbix centos7"

if [ ! -d /var/log/xen/backups ]; then
echo mkdir -p /var/log/xen/backups
 mkdir -p /var/log/xen/backups
fi

if [ ! -d $bak_dir ]; then
echo mkdir -p $bak_dir
 mkdir -p $bak_dir

fi


# check whether bak runned last week
if [ -e $mark_file ] ; then
        echo  rm -f $mark_file
 rm -f $mark_file
else
        echo  touch $mark_file
 touch $mark_file
  # exit 0
fi

# set std and stderr to log file
        echo mv $log_file $log_file.old
       mv $log_file $log_file.old
        echo mv $err_log_file $err_log_file.old
       mv $err_log_file $err_log_file.old
        echo "exec 2> $err_log_file"
       exec 2> $err_log_file
        echo "exec > $log_file"
       exec > $log_file


# check whether the VM is running
# We only backup running VMs

echo "*** Check alive VMs"

xen_name_list_tmp=""

for i in $xen_name_list
do
        echo "/usr/sbin/xl list > /tmp/tmp-xen-list"
        /usr/sbin/xl list > /tmp/tmp-xen-list
  grepinlist=`grep $i" " /tmp/tmp-xen-list`;
  if [[ “$grepinlist” == “” ]]
  then
    echo $i is not alive.
  else
    echo $i is alive.
    xen_name_list_tmp=$xen_name_list_tmp" "$i
  fi
done

xen_name_list=$xen_name_list_tmp

echo "Alive VM list:"

for i in $xen_name_list
do
   echo $i
done

echo "End alive VM list."

###############################
date
echo "*** Backup starts"

###############################
date
echo "*** Copy VMs to local disk"

for i in $xen_name_list
do
  date
  echo "Shutdown $i"
        echo  /usr/sbin/xl shutdown $i
        /usr/sbin/xl shutdown $i
        if [ $? != ‘0’ ]; then
                echo 'Not Xen Disk image destroying …';
                /usr/sbin/xl destroy $i
        fi
  sleep 30

  echo "Copy $i"
  echo "Copy to local_bak_dir: $local_bak_dir"
      echo /usr/bin/rsync -avhW –no-compress –progress $xen_dir/$i/{disk.img,swap.img} $local_bak_dir/$i/
     time /usr/bin/rsync -avhW –no-compress –progress $xen_dir/$i/{disk.img,swap.img} $local_bak_dir/$i/
      echo /usr/bin/rsync -avhW –no-compress –progress $xen_vmconfig_dir/$i.cfg $local_bak_dir/$i.cfg
     time /usr/bin/rsync -avhW –no-compress –progress $xen_vmconfig_dir/$i.cfg $local_bak_dir/$i.cfg
  date
  echo "Create $i"
  # with vmmem=1024"
  # /usr/sbin/xm create $xen_dir/vm.run vmid=$i vmmem=1024
          echo /usr/sbin/xl create $xen_vmconfig_dir/$i.cfg
          /usr/sbin/xl create $xen_vmconfig_dir/$i.cfg
## Uncomment if you need to copy with scp somewhere
###       echo scp $log_file $bak_dir/xen-bak-111.log
###      echo  /usr/bin/rsync -avhW –no-compress –progress $log_file $local_bak_dir/xen-bak-111.log
done

####################
date
echo "*** Compress local bak vmdisks"

for i in $xen_name_list
do
  date
  echo "Compress $i"
      echo tar -z -cfv $bak_dir/$i-$(date +%Y_%m_%d).tar.gz $local_bak_dir/$i-$(date +%Y_%m_%d) $local_bak_dir/$i.cfg
     time nice -n 10 tar -z -cvf $bak_dir/$i-$(date +%Y_%m_%d).tar.gz $local_bak_dir/$i/ $local_bak_dir/$i.cfg
    echo rm -vf $local_bak_dir/$i/ $local_bak_dir/$i.cfg
    rm -vrf $local_bak_dir/$i/{disk.img,swap.img}  $local_bak_dir/$i.cfg
done

####################
date
echo "*** Copy local bak vmdisks to remote machines"

copy_remote () {
for i in $xen_name_list
do
  date
  echo "Copy to remote: vm$i"
        echo  scp $local_bak_dir/vmdisk0-$i.tar.gz $bak_dir/vmdisk0-$i.tar.gz
done

#####################
date
echo "Backup finishes"
        echo scp $log_file $bak_dir/bak-111.log

}

date
echo "Backup finished"


Things to configure before start using using the script to prepare backups for you is the xen_name_list variable

#  directory skele where to store already prepared backups
bak_dir=/backups/disk1/xen-backups/xen_images/$(date +%Y_%m_%d)/xen/domains

# The configurations of the running Xen Virtual Machines
xen_vmconfig_dir=/etc/xen/
# a local directory that will be used for backup creation ( I prefer this directory to be on the backup storage location )
local_bak_dir=/backups/disk1/tmp
#bak_dir=xenbak@backup_host1:/lhome/xenbak
# the structure on the backup location where daily .img backups with be produced with rsync and tar archived with bzip2
bak_dir=/backups/disk1/xen-backups/xen_images/$(date +%Y_%m_%d)/xen/domains

# list here all the Virtual Machines you want the script to create backups of
xen_name_list="windows7 haproxy2 jitsi-meet zabbix centos7"

If you need the script to copy the backup of Virtual Machine images to external Backup server via Local Lan or to a remote Internet located encrypted connection with a passwordless ssh authentication (once you have prepared the Machines to automatically login without pass over ssh with specific user), you can uncomment the script commented section to adapt it to copy to remote host.

Once you have placed at place /usr/sbin/xen_vm_backups.sh use a cronjob to prepare backups on a regular basis, for example I use the following cron to produce a working copy of the Virtual Machine backups everyday.
 

# crontab -u root -l 

# create windows7 haproxy2 jitsi-meet centos7 zabbix VMs backup once a month
00 06 1,2,3,4,5,6,7,8,9,10,11,12 * * /usr/sbin/xen_vm_backups.sh 2>&1 >/dev/null


I do clean up virtual machines Images that are older than 95 days with another cron job

# crontab -u root -l

# Delete xen image files older than 95 days to clear up space from backup HDD
45 06 17 * * find /backups/disk1/xen-backups/xen_images* -type f -mtime +95 -exec rm {} \; 2>&1 >/dev/null

#### Delete xen config backups older than 1 year+3 days (368 days)
45 06 17 * * find /backups/disk1/xen-backups/xen_config* -type f -mtime +368 -exec rm {} \; 2>&1 >/dev/null

Adding custom user based host IP aliases load custom prepared /etc/hosts from non root user on Linux – Script to allow define IPs that doesn’t have DNS records to user preferred hostname

Wednesday, April 14th, 2021

adding-custom-user-based-host-aliases-etc-hosts-logo-linux

Say you have access to a remote Linux / UNIX / BSD server, i.e. a jump host and you have to remotely access via ssh a bunch of other servers
who have existing IP addresses but the DNS resolver recognized hostnames from /etc/resolv.conf are long and hard to remember by the jump host in /etc/resolv.conf and you do not have a way to include a new alias to /etc/hosts because you don't have superuser admin previleges on the hop station.
To make your life easier you would hence want to add a simplistic host alias to be able to easily do telnet, ssh, curl to some aliased name like s1, s2, s3 … etc.


The question comes then, how can you define the IPs to be resolvable by easily rememberable by using a custom User specific /etc/hosts like definition file? 

Expanding /etc/hosts predefined host resolvable records is pretty simple as most as most UNIX / Linux has the HOSTALIASES environment variable
Hostaliases uses the common technique for translating host names into IP addresses using either getaddrinfo(3) or the obsolete gethostbyname(3). As mentioned in hostname(7), you can set the HOSTALIASES environment variable to point to an alias file, and you've got per-user aliases

create ~/.hosts file

linux:~# vim ~/.hosts

with some content like:
 

g google.com
localhostg 127.0.0.1
s1 server-with-long-host1.fqdn-whatever.com 
s2 server5-with-long-host1.fqdn-whatever.com
s3 server18-with-long-host5.fqdn-whatever.com

linux:~# export HOSTALIASES=$PWD/.hosts

The caveat of hostaliases you should know is this will only works for resolvable IP hostnames.
So if you want to be able to access unresolvable hostnames.
You can use a normal alias for the hostname you want in ~/.bashrc with records like:

alias server-hostname="ssh username@10.10.10.18 -v -o stricthostkeychecking=no -o passwordauthentication=yes -o UserKnownHostsFile=/dev/null"
alias server-hostname1="ssh username@10.10.10.19 -v -o stricthostkeychecking=no -o passwordauthentication=yes -o UserKnownHostsFile=/dev/null"
alias server-hostname2="ssh username@10.10.10.20 -v -o stricthostkeychecking=no -o passwordauthentication=yes -o UserKnownHostsFile=/dev/null"

then to access server-hostname1 simply type it in terminal.

The more elegant solution is to use a bash script like below:

# include below code to your ~/.bashrc
function resolve {
        hostfile=~/.hosts
        if [[ -f “$hostfile” ]]; then
                for arg in $(seq 1 $#); do
                        if [[ “${!arg:0:1}” != “-” ]]; then
                                ip=$(sed -n -e "/^\s*\(\#.*\|\)$/d" -e "/\<${!arg}\>/{s;^\s*\(\S*\)\s*.*$;\1;p;q}" "$hostfile")
                                if [[ -n “$ip” ]]; then
                                        command "${FUNCNAME[1]}" "${@:1:$(($arg-1))}" "$ip" "${@:$(($arg+1)):$#}"
                                        return
                                fi
                        fi
                done
        fi
        command "${FUNCNAME[1]}" "$@"
}

function ping {
        resolve "$@"
}

function traceroute {
        resolve "$@"
}

function ssh {
        resolve "$@"
}

function telnet {
        resolve "$@"
}

function curl {
        resolve "$@"
}

function wget {
        resolve "$@"
}


Now after reloading bash login session $HOME/.bashrc with:

linux:~# source ~/.bashrc

ssh / curl / wget / telnet / traceroute and ping will be possible to the defined ~/.hosts IP addresses just like if it have been defined global wide on System in /etc/hosts.

Enjoy
 

IBM Tivoli (Spectrum Protect) update self-signed client expiring SSL certificates

Wednesday, March 17th, 2021

IBM-Spectrum-protect-suite-logo

Say you're using Tivoli TSM to manage your backups for tsm (if you don't know what is IBM TSM (Spectrum Protect) Backup solution check my previous article on how to use IBM Tivoli to list configured, scheduled, how to do restore backups with dsmc console client.

And you follow below steps to enable SSL communication with a CA-signed certificate between Spectrum Protect client and server:

E.g. you have to

  • Obtained the CA root certificate.
  • Configure the clients. To use SSL, each client must import the self-signed server certificate.

Used the GSKit command-line utility (gsk8capicmd for 32-bit clients or gsk8capicmd_64 for 64-bit clients) to import the certificate.

ibm-tsm_ssl_config_selfsigned


1. The problem

This self-signed certificates has expire date which after some time might have expire date coming. If your environment has something like PCI security standards enabled and you do a Quarterly security scans with something like QualysGuard (Qaulys vulnerability management tool). 

In the case of Qualys scans you may receive GSK messages in dsmerro.log if the certificate is expiring:


03/04/2021 14:35:07 ANS9959W IBM Spectrum Protect acceptor received a non-critical network error 88, IBM Spectrum Protect return code : -50.

03/05/2021 13:04:59 ANS1579E GSKit function gsk_secure_soc_init failed with 414: GSK_ERROR_BAD_CERT

03/05/2021 13:04:59 TCP/IP received rc 88 trying to accept connection from server.

03/05/2021 13:04:59 ANS9959W IBM Spectrum Protect acceptor received a non-critical network error 88, IBM Spectrum Protect return code : -50.


2. To check the situation on the host with TSM self-signed expiry


2.1  First get the FQDN and certificate name

[root@redhat: ~ ]# FQDN=$(hostname –fqdn |tr '[:lower:]’ ‘[:upper:]');


[root@redhat: ~ ]# echo "FQDN to be used is: $FQDN. Please be careful it is correct (if machine has wrong FQDN) you might have issues";

[root@redhat: ~ ]# gsk8capicmd_64 -cert -list -db /etc/adsm/Nodes/$FQDN/spclicert.kdb -stashed


The gsk8capicmd_64 is IBM's tool to view and manage SSL certificates it is perhaps a C written binary that has a compiled patched version of a normal openssl tool. Using it is the ibm recommended way to manage Tivoli certificates.

2.2  Get details using -label=CERTNAME and check for expiration date


[root@redhat: ~ ]# gsk8capicmd_64 -cert -details -label $FQDN -db /etc/adsm/Nodes/$FQDN/spclicert.kdb -stashed

Certificates found
* default, – personal, ! trusted, # secret key
–       FQDN-OF-HOST.COM


3. To update the certificates


3.1 Copy the old certificates for backup

As usual do a backup in case if something goes wrong and you need to restore

[root@redhat: ~ ]# mkdir /root/certbck-tsm_$(date +"%b-%d-%Y")/

[root@redhat: ~ ]# cp -rpv /etc/adsm/Nodes/$FQDN/spclicert* /root/certbck-tsm_$(date +"%b-%d-%Y")/


3.2 Stop the dsmcad backup service

[root@redhat: ~ ]# systemctl stop dsmcad

Double check the service is stopped by checking for any remain dsm processes

[root@redhat: ~ ]# ps axf | grep dsm

3.3 Remove the expiring certificates from host

[root@redhat: ~ ]# rm -v /etc/adsm/Nodes/$FQDN/spclicert*


3.4 Generate new certificates with dsmc client

[root@redhat: ~ ]# dsmc query session -optfile="/opt/tivoli/tsm/client/ba/bin/dsm.opt"


3.5 Check if all is generated as expected

[root@redhat: ~ ]# ls -l  /etc/adsm/Nodes/$FQDN/spclicert*

3.6 Start the backup service

[root@redhat: ~ ]# systemctl start dsmcad

3.7  Check  /var/tsm/dsmwebcl.log for the port number of webclient

 [root@redhat: ~ ]# cat /var/tsm/dsmwebcl.log

03/16/2021 13:31:41 (dsmcad) ————————————————————
03/16/2021 13:31:41 (dsmcad) Command will be executed in 11 hours and 50 minutes.
03/16/2021 15:56:01 (dsmcad) ANS9959W IBM Spectrum Protect acceptor received a non-critical network error 88, IBM Spectrum Protect return code : -50.
03/17/2021 01:21:41 (dsmcad) Executing scheduled command now.
03/17/2021 01:22:53 (dsmcad) Next operation scheduled:
03/17/2021 01:22:53 (dsmcad) ————————————————————
03/17/2021 01:22:53 (dsmcad) Schedule Name:         0120_SCHED_P
03/17/2021 01:22:53 (dsmcad) Action:                Incremental
03/17/2021 01:22:53 (dsmcad) Objects:
03/17/2021 01:22:53 (dsmcad) Options:               -subdir=yes
03/17/2021 01:22:53 (dsmcad) Server Window Start:   01:20:00 on 03/18/2021
03/17/2021 01:22:53 (dsmcad) ————————————————————
03/17/2021 01:22:53 (dsmcad) Command will be executed in 12 hours.
03/17/2021 13:22:53 (dsmcad) Executing scheduled command now.
03/17/2021 13:22:54 (dsmcad) Next operation scheduled:
03/17/2021 13:22:54 (dsmcad) ————————————————————
03/17/2021 13:22:54 (dsmcad) Schedule Name:         0120_SCHED_P
03/17/2021 13:22:54 (dsmcad) Action:                Incremental
03/17/2021 13:22:54 (dsmcad) Objects:
03/17/2021 13:22:54 (dsmcad) Options:               -subdir=yes
03/17/2021 13:22:54 (dsmcad) Server Window Start:   01:20:00 on 03/18/2021
03/17/2021 13:22:54 (dsmcad) ————————————————————


 [root@redhat: ~ ]# grep -i port /var/tsm/dsmwebcl.log
03/11/2021 16:59:19 (dsmcad) ANS3000I TCP/IP communications available on port 37506.
03/12/2021 11:35:21 (dsmcad) ANS3000I TCP/IP communications available on port 40510.
03/12/2021 14:53:03 (dsmcad) ANS3000I TCP/IP communications available on port 45005.


3.8  You can check the certificate expiery mask yourself as qualys scanner and check the new certificate 

[root@redhat: ~ ]# dsmc_port=$(netstat -tulpan|grep -i dsm|awk '{ print $4 }'|cut -d":" -f2);
[root@redhat: ~ ]# echo $dsmc_port

[root@redhat: ~ ]# openssl s_client -servername 127.0.0.1 -connect 127.0.0.1:$dsmc_port |  openssl x509 -noout -dates

notBefore=Mar  6 14:09:55 2021 GMT
notAfter=Mar  7 14:09:55 2022 GMT

Hopefully your expiry date is fine that means you're done, you can place the steps in a single script to save time, if you have to run it in a year time.

How to calculate connections from IP address with shell script and log to Zabbix graphic

Thursday, March 11th, 2021

We had to test the number of connections incoming IP sorted by its TCP / IP connection state.

For example:

TIME_WAIT, ESTABLISHED, LISTEN etc.


The reason behind is sometimes the IP address '192.168.0.1' does create more than 200 connections, a Cisco firewall gets triggered and the connection for that IP is filtered out. To be able to know in advance that this problem is upcoming. a Small userparameter script is set on the Linux servers, that does print out all connections from IP by its STATES sorted out.


The script is calc_total_ip_match_zabbix.sh is below:

#!/bin/bash
#  check ESTIMATED / FIN_WAIT etc. netstat output for IPs and calculate total
# UserParameter=count.connections,(/usr/local/bin/calc_total_ip_match_zabbix.sh)
CHECK_IP='192.168.0.1';
f=0; 


for i in $(netstat -nat | grep "$CHECK_IP" | awk '{print $6}' | sort | uniq -c | sort -n); do

echo -n "$i ";
f=$((f+i));
done;
echo
echo "Total: $f"


root@pcfreak:/bashscripts# ./calc_total_ip_match_zabbix.sh 
1 TIME_WAIT 2 ESTABLISHED 3 LISTEN 

Total: 6


root@pcfreak:/bashscripts# ./calc_total_ip_match_zabbix.sh 
2 ESTABLISHED 3 LISTEN 
Total: 5


images/zabbix-webgui-connection-check1

To make process with Zabbix it is necessery to have an Item created and a Depedent Item.


webguiconnection-check1

webguiconnection-check1
 

webgui-connection-check2-item

images/webguiconnection-check1

Finally create a trigger to trigger alarm if you have more than or eqaul to 100 Total overall connections.


images/zabbix-webgui-connection-check-trigger

The Zabbix userparameter script should be as this:

[root@host: ~]# cat /etc/zabbix/zabbix_agentd.d/userparameter_webgui_conn.conf
UserParameter=count.connections,(/usr/local/bin/webgui_conn_track.sh)


Some collleagues suggested more efficient shell script solution for suming the overall number of connections, below is less time consuming version of script, that can be used for the calculation.
 

#!/bin/bash -x
# show FIN_WAIT2 / ESTIMATED etc. and calcuate total
count=$(netstat -n | grep "192.168.0.1" | awk ' { print $6 } ' | sort -n | uniq -c | sort -nr)
total=$((${count// /+}))
echo "$count"
echo "Total:" "$total"

      2 ESTABLISHED
      1 TIME_WAIT
Total: 3


Below is the graph built with Zabbix showing all the fluctuations from connections from monitored IP. ebgui-check_ip_graph