Posts Tagged ‘CentOS’
Friday, July 22nd, 2011 
These days, I’m managing a number of OpenVZ Virtual Machine host servers. Therefore constantly I’m facing a lot of problems with users who run shit scripts inside their Linux Virtual Machines.
Commonly user Virtual Servers are used as a launchpad to attack hosts do illegal hacking activities or simply DDoS a host..
The virtual machines users (which by the way run on top of the CentOS OpenVZ Linux) are used to launch a Denial service scripts like kaiten.pl, trinoo, shaft, tfn etc.
As a consequence of their malicious activities, oftenly the Data Centers which colocates the servers are either null routing our server IPs until we suspend the Abusive users, or the servers go simply down because of a server overload or a kernel bug hit as a result of the heavy TCP/IP network traffic or CPU/mem overhead.
Therefore to mitigate this abusive attacks, I’ve written few bash shell scripts which, saves us a lot of manual check ups and prevents in most cases abusers to run the common DoS and “hacking” script shits which are now in the wild.
The first script I’ve written is kill_abusers.sh , what the script does is to automatically look up for a number of listed processes and kills them while logging in /var/log/abusers.log about the abusive VM user procs names killed.
I’ve set this script to run 4 times an hour and it currently saves us a lot of nerves and useless ticket communication with Data Centers (DCs), not to mention that reboot requests (about hanged up servers) has reduced significantly.
Therefore though the scripts simplicity it in general makes the servers run a way more stable than before.
Here is OpenVZ kill/suspend Abusers procs script kill_abusers.sh ready for download
Another script which later on, I’ve written is doing something similar and still different, it does scan the server hard disk using locate and find commands and tries to identify users which has script kiddies programs in their Virtual machines and therefore are most probably crackers.
The scripts looks up for abusive network scanners, DoS scripts, metasploit framework, ircds etc.
After it registers through scanning the server hdd, it lists only files which are preliminary set in the script to be dangerous, and therefore there execution inside the user VM should not be.
search_for_abusers.sh then logs in a files it’s activity as well as the OpenVZ virtual machines user IDs who owns hack related files. Right after it uses nail mailing command to send email to a specified admin email and reports the possible abusers whose VM accounts might need to either be deleted or suspended.
search_for_abusers can be download here
Honestly I truly liked my search_for_abusers.sh script as it became quite nice and I coded it quite quickly.
I’m intending now to put the Search for abusers script on a cronjob on the servers to check periodically and report the IDs of OpenVZ VM Users which are trying illegal activities on the servers.
I guess now our beloved Virtual Machine user script kiddies are in a real trouble ;P
Tags: admin job, bash scripts, bash shell scripts, CentOS, check ups, consequence, data, DDoS, Denial, denial service, download, host, host servers, job, kill, launchpad, Linux, log, malicious activities, network traffic, number, openvz, overhead, quot, script, script kiddies, Search, server overload, servers, Shell, shits, tcp ip network, tfn, ticket, trinoo, ups, Virtual, virtual machine, virtual machines, virtual servers, vm user
Posted in System Administration | 29 Comments »
Friday, September 30th, 2011 Its common thing that CMS systems and many developers custom .htaccess cause issues where websites depending on mod_rewrite fails to work properly. Most common issues are broken redirects or mod_rewrite rules, which behave differently among the different mod_rewrite versions which comes with different versions of Apache.
Everytime there are such problems its necessery that mod_rewrite’s RewriteLog functionality is used.
Even though the RewriteLog mod_rewrite config variable is well described on httpd.apache.org , I decided to drop a little post here as I’m pretty sure many novice admins might not know about RewriteLog config var and might benefit of this small article.
Enabling mod_rewrite requests logging of requests to the webserver and process via mod_rewrite rules is being done either via the specific website .htaccess (located in the site’s root directory) or via httpd.conf, apache2.conf etc. depending on the Linux / BSD linux distribution Apache config file naming is used.
To enable RewriteLog near the end of the Apache configuration file its necessery to place the variables in apache conf:
1. Edit RewriteLog and place following variables:
RewriteLogLevel 9

RewriteLog /var/log/rewrite.log
RewriteLogLevel does define the level of logging that should get logged in /var/log/rewrite.log
The higher the RewriteLogLevel number defined the more debugging related to mod_rewrite requests processing gets logged.
RewriteLogLevel 9 is actually the highest loglevel that can be. Setting the RewriteLogLevel to 0 will instruct mod_rewrite to stop logging. In many cases a RewriteLogLevel of 3 is also enough to debug most of the redirect issues, however I prefer to see more, so almost always I use RewriteLogLevel of 9.
2. Create /var/log/rewrite.log and set writtable permissions
a. Create /var/log/rewrite.log
freebsd# touch /var/log/rewrite.log
b. Set writtable permissons
Either chown the file to the user with which the Apache server is running, or chmod it to permissions of 777.
On FreeBSD, chown permissions to allow webserver to write in file, should be:
freebsd# chown www:www /var/log/rewrite.log
On Debian and alike distros:
debian:~# chown www-data:www-data /var/log/rewrite.log
On CentOS, Fedora etc.:
[root@centos ~]# chown httpd:httpd /var/log/rewrite.log
On any other distribution, you don’t want to bother to check the uid:gid, the permissions can be set with chmod 777, e.g.:
linux# chmod 777 /var/log/rewrite.log
Next after RewriteLog is in conf to make configs active the usual webserver restart is required.
To restart Apache On FreeBSD:
freebsd# /usr/local/etc/rc.d/apache2 restart

...
To restart Apache on Debian and derivatives:
debian:~# /etc/init.d/apache2 restart

...
On Fedora and derivive distros:
[root@fedora ~]# /etc/init.d/httpd restart

...
Its common error to forget to set proper permissions to /var/log/rewrite.log this has puzzled me many times, when enabling RewriteLog’s logging.
Another important note is when debugging for mod_rewrite is enabled, one forgets to disable logging and after a while if the /var/log partition is placed on a small partition or is on an old server with less space often the RewriteLog fills in the disk quickly and might create website downtimes. Hence always make sure RewriteLog is disabled after work rewrite debugging is no longer needed.
The way I use to disable it is by commenting it in conf like so:
#RewriteLogLevel 9

#RewriteLog /var/log/rewrite.log
Finally to check, what the mod_rewrite processor is doing on the fly its handy to use the well known tail -f
linux# tail -f /var/log/rewrite.log
A bunch of time in watching the requests, should be enough to point to the exact problem causing broken redirects or general website malfunction.
Cheers 😉
Tags: apache config, apache configuration, benefit, BSD, CentOS, cms systems, config, custom, developers, file, functionality, httpd apache, init, level, Linux, loglevel, logOn, logRewriteLogLevel, mod, necessery, novice, number, partition, permissonsEither, place, processing, root, root directory, Set, small article, Solve, uid, variables
Posted in SEO, System Administration, Web and CMS | 4 Comments »
Thursday, September 22nd, 2011 
A combination of two wordpress caching plugins (Hyper Cache and Db Cachesignificantly improves the access times of a wordpress based blogs and websites.
Installing the two websites has drastically improved my blog opening times, so in my view having the two plugins on every wordpress install out there is a must! 🙂
The plugins installation is straight forward, here is how I installed them.
1. Installing Hyper Cache on WordPress
To install Hyper Cache all I had to do is download and enable the plugin, the plugin doesn’t require any configuration. I always love it when I don’t have to bother with reading configuration options and pondering for some 20 minutes on the plugin features, so in that perspective Hyper Cache in my view is a good alternative to WordPress Super Cache
Besides that WordPress Super Cache was having issues when enabled on few wordpress based websites I manage these days. For comparison Hyper Cache worked just great on all wordpress install I tried the plugin so far.
To install all I had to do is download the plugin unzip and enable it:
a. Download and unzip it
debian:/var/www/blog# wget http://downloads.wordpress.org/plugin/hyper-cache.zip

...

debian:/var/www/blog# cd wp-content/plugins

debian:/var/www/blog/wp-content/plugins# unzip hyper-cache.zip
b. Enable Hyper Cache plugin
To enable the plugin follow to standard plugin location;
Plugins -> Inactive -> Hyper Cache (Enable)
To enable the plugin follow to standard plugin location;
Plugins -> Inactive -> Hyper Cache (Enable)
A mirror of current version of hyper-cache.zip plugin is here
2. Installing Wodpress Db Cache
What Db Cache, does it does caching of last queries made to MySQL for specified time, so if the query has to be refetched again from wordpress’s php frontend the queries results are fetched straight for the memory. This decreases the load towards the MySQL server and increases the webpages loading time.
As the plugin page suggests it’s way faster than other html caching-plugins like WP-Cache or WP Super Cache
However, I think its still slower than using a combination of WP Super Cache’s alternative Hyper Cache and Db Cache . Combining this two could rise the webpage opening times according to some statisticonline at best cases up to 830% !! 😉 Let me proceed with how I did the install of Db Cache .
a. Download and Install Db Cache
debian:/var/www/blog/wp-content/plugins# wget http://downloads.wordpress.org/plugin/db-cache.0.6.zip
...
debian:/var/www/blog/wp-content/plugins# unzip db-cache.0.6.zip
b. Enable the plugin
Plugins -> Inactive -> Db Cache (Enable)
c. Make sure the permissions for Db Cache are correct
On Debian to enable Db Cache, the permissions should be changed for Apache to have a read/write permissions to plugin directory, on Debian to fix the permissions I used the commands:
debian:/var/www/blog# chown www-data:www-data wp-content
debian:/var/www/blog# chown -R www-data:www-data wp-content/plugins/db-cache
On other GNU/Linux distributions the above commands (user and group) www-data:www-data, should be set to whatever user/group Apache is running with, on Slackware this would be nobody:nobody, on CentOS and RHEL it would be apache:apache.
Finally to enable Db Cache go to
Settings -> Db Cache -> (Tick Enable) -> Save
I’ve also made a mirror of Db Cache plugin here
Enjoy the speed boost 😉
Tags: blog, blogs, CacheBesides, Cachesignificantly, CentOS, configuration options, current version, doesn, download, frontend, Inactive, Install, installation, Installing, itdebian, load time, loading, location, mirror, nbsp, nobody, page, perspective, php, plugin, pluginsdebian, queries, server load, Super, time, unzip, var, wget, Wordpress, WP-Cache, www, zipb
Posted in Linux, SEO, Various, Web and CMS, Wordpress | 2 Comments »
Sunday, February 12th, 2012 
Lately I've been researching on ntpd and wrote a two articles on how to install ntpd on CentOS, Fedora and how to install ntpd on FreeBSD and during my research on ntpd, I've come across OpenNTPD and decided to give it a go on my FreeBSD home router.
OpenBSD project is well known for it is high security standards and historically has passed the test of time for being a extraordinary secure UNIX like free operating system.
OpenBSD is developed in parallel with FreeBSD, however the development model of the two free operating systems are way different.
As a part of the OpenBSD to be independant in its basis of software from other free operating systems like GNU / Linux and FreeBSD. They develop the all around free software realm known OpenSSH. Along with OpenSSH, one interesting project developed for the main purpose of OpenBSD is OpenNTPD.
Here is how openntpd.org describes OpenNTPD:
"a FREE, easy to use implementation of the Network Time Protocol. It provides the ability to sync the local clock to remote NTP servers and can act as NTP server itself, redistributing the local clock."
OpenNTPD's accent just like OpenBSD's accent is security and hence for FreeBSD installs which targets security openntpd might be a good choice. Besides that the so popular classical ntpd has been well known for being historically "insecure", remote exploits for it has been released already at numerous times.
Another reason for someone to choose run openntpd instead of ntpd is its great simplicity. openntpd configuration is super simple.
Here are the steps I followed to have openntpd time server synchronize clock on my system using other public accessible openntpd servers on the internet.
1. Install openntpd through pkg_add -vr openntpd or via ports tree
a) For binar install with pkg_add issue:
freebsd# pkg_add -vr openntpd

...
b) if you prefer to compile it from source
freebsd# cd /usr/ports/net/openntpd

freebsd# make install clean

...
2. Enable OpenNTPD to start on system boot:
freebsd# echo 'openntpd_enable="YES"' >> /etc/rc.conf
3. Create openntpd ntpd.conf configuration file
There is a default sample ntpd.conf configuration which can be straight use as a conf basis:
freebsd# cp -rpf /usr/local/share/examples/openntpd/ntpd.conf /usr/local/etc/ntpd.conf
Default ntpd.conf works just fine without any modifications, if however there is a requirement the openntpd server to listen and accept time synchronization requests from only certain hosts add to conf something like:
listen on 192.168.1.2

listen on 192.168.1.3

listen on 2607:f0d0:3001:0009:0000:0000:0000:0001

listen on 127.0.0.1
This configuration will enable only 192.168.1.2 and 192.168.1.3 IPv4 addresses as well as the IPv6 2607:f0d0:3001:0009:0000:0000:0000:0001 IP to communicate with openntpd.
4. Start OpenNTPD service
freebsd# /usr/local/etc/rc.d/openntpd
5. Verify if openntpd is up and running
freebsd# ps axuww|grep -i ntp

root 31695 0.0 0.1 3188 1060 ?? Ss 11:26PM 0:00.00 ntpd: [priv] (ntpd)

_ntp 31696 0.0 0.1 3188 1140 ?? S 11:26PM 0:00.00 ntpd: ntp engine (ntpd)

_ntp 31697 0.0 0.1 3188 1088 ?? S 11:26PM 0:00.00 ntpd: dns engine (ntpd)

root 31700 0.0 0.1 3336 1192 p2 S+ 11:26PM 0:00.00 grep -i ntp
Its also good idea to check if openntpd has succesfully established connection with its peer remote openntpd time servers. This is necessery to make sure pf / ipfw firewall rules are not preventing connection to remote 123 UDP port:
freebsd# sockstat -4 -p 123

USER COMMAND PID FD PROTO LOCAL ADDRESS FOREIGN ADDRESS

_ntp ntpd 31696 4 udp4 83.228.93.76:54555 212.70.148.15:123

_ntp ntpd 31696 6 udp4 83.228.93.76:56666 195.69.120.36:123

_ntp ntpd 31696 8 udp4 83.228.93.76:49976 217.75.140.188:123
By default openntpd is also listening to IPv6 if IPv6 support is enabled in freebsd kernel.
6. Resolve openntpd firewall filtering issues
If there is a pf firewall blocking UDP requests to in/out port 123 within /etc/pf.conf rule like:
block in log on $EXT_NIC proto udp all
Before the blocking rule you will have to add pf rules:
# Ipv4 Open outgoing port TCP 123 (NTP)

pass out on $EXT_NIC proto tcp to any port ntp

# Ipv6 Open outgoing port TCP 123 (NTP)

pass out on $EXT_NIC inet6 proto tcp to any port ntp

# Ipv4 Open outgoing port UDP 123 (NTP)

pass out on $EXT_NIC proto udp to any port ntp

# Ipv6 Open outgoing port UDP 123 (NTP)

pass out on $EXT_NIC inet6 proto udp to any port ntp
where $EXT_NIC is defined to be equal to the external lan NIC interface, for example:
EXT_NIC="ml0"
Afterwards to load the new pf.conf rules firewall has to be flushed and reloaded:
freebsd# /sbin/pfctl -f /etc/pf.conf -d

...

freebsd# /sbin/pfctl -f /etc/pf.conf -e

...
In conclusion openntpd should be more secure than regular ntpd and in many cases is probably a better choice.
Anyhow bear in mind on FreeBSD openntpd is not part of the freebsd world and therefore security updates will not be issued directly by the freebsd dev team, but you will have to regularly update with the latest version provided from the bsd ports to make sure openntpd is 100% secure.
For anyone looking for more precise system clock synchronization and not so focused on security ntpd might be still a better choice. The OpenNTPD's official page states it is designed to reach reasonable time accuracy, but is not after the last microseconds.
Tags: Auto, basis, better security, CentOS, connection, development model, Draft, Engine, exploits, fedora, Free, free operating system, free operating systems, freebsd, GNU, gnu linux, high security, Linux, network time protocol, ntp server, ntp servers, ntpd, Open, OpenBSD, OpenNTPD, pkg, ports, project, Protocol, quot, realm, reason, root, secure unix, security standards, simplicity, software, system, system clock, test, test of time, time, time server
Posted in FreeBSD, System Administration | No Comments »
Thursday, February 9th, 2012 Every now and then I have to work on servers running CentOS or Fedora Linux. Very typical problem that I observe on many servers which I have to inherit is the previous administrator did not know about the existence of NTP (Network Time Protocol) or forgot to install the ntpd server. As a consequence the many installed server services did not have a correct clock and at some specific cases this caused issues for web applications running on the server or any CMS installed etc.
The NTP Daemon is existing in GNU / linux since the early days of Linux and it served quite well so far. The NTP protocol has been used since the early days of the internet and for centuries is a standard protocol for BSD UNIX.
ntp is available in I believe all Linux distributions directly as a precompiled binary and can be installed on Fedora, CentOS with:
[root@centos ~]# yum install ntp
ntpd synchronizes the server clock with one of the /etc/ntp.conf defined RedHat NTP list
server 0.rhel.pool.ntp.org

server 1.rhel.pool.ntp.org

server 2.rhel.pool.ntp.org
To Synchronize manually the server system clock the ntp CentOS rpm package contains a tool called ntpdate :
Hence its a good practice to use ntpdate to synchronize the local server time with a internet server, the way I prefer to do this is via a government owned ntp server time.nist.gov, e.g.
[root@centos ~]# ntpdate time.nist.gov

8 Feb 14:21:03 ntpdate[9855]: adjust time server 192.43.244.18 offset -0.003770 sec
Alternatively if you prefer to use one of the redhat servers use:
[root@centos ~]# ntpdate 0.rhel.pool.ntp.org

8 Feb 14:20:41 ntpdate[9841]: adjust time server 72.26.198.240 offset 0.005671 sec
Now as the system time is set to a correct time via the ntp server, the ntp server is to be launched:
[root@centos ~]# /etc/init.d/ntpd start

...
To permanently enable the ntpd service to start up in boot time issue also:
[root@centos ~]# chkconfig ntpd on
Using chkconfig and /etc/init.d/ntpd cmds, makes the ntp server to run permanently via the ntpd daemon:
[root@centos ~]# ps ax |grep -i ntp

29861 ? SLs 0:00 ntpd -u ntp:ntp -p /var/run/ntpd.pid -g
If you prefer to synchronize periodically the system clock instead of running permanently a network server listening (for increased security), you should omit the above chkconfig ntpd on and /etc/init.d/ntpd start commands and instead set in root crontab the time to get synchronize lets say every 30 minutes, like so:
[root@centos ~]# echo '30 * * * * root /sbin/ntpd -q -u ntp:ntp' > /etc/cron.d/ntpd
The time synchronization via crontab can be also done using the ntpdate cmd. For example if you want to synchronize the server system clock with a network server every 5 minutes:
[root@centos ~]# crontab -u root -e
And paste inside:
*/5 * * * * /sbin/ntpdate time.nist.gov 2>1 > /dev/null
ntp package is equipped with ntpq – Standard NTP Query Program. To get very basic stats for the running ntpd daemon use:
[root@centos ~]# ntpq -p

remote refid st t when poll reach delay offset jitter

======================================================

B1-66ER.matrix. 192.43.244.18 2 u 47 64 17 149.280 41.455 11.297

*ponderosa.piney 209.51.161.238 2 u 27 64 37 126.933 32.149 8.382

www2.bitvector. 132.163.4.103 2 u 1 64 37 202.433 12.994 13.999

LOCAL(0) .LOCL. 10 l 24 64 37 0.000 0.000 0.001
The remote field shows the servers to which currently the ntpd service is connected. This IPs are the servers which ntp uses to synchronize the local system server clock. when field shows when last the system was synchronized by the remote time server and the rest is statistical info about connection quality etc.
If the ntp server is to be run in daemon mode (ntpd to be running in the background). Its a good idea to allow ntp connections from the local network and filter incoming connections to port num 123 in /etc/sysconfig/iptables :
-A INPUT -s 192.168.1.0/24 -m state --state NEW -p udp --dport 123 -j ACCEPT

-A INPUT -s 127.0.0.1 -m state --state NEW -p udp --dport 123 -j ACCEPT

-A INPUT -s 0.0.0.0 -m state --state NEW -p udp --dport 123 -j DROP
Restrictions on which IPs can be connected to the ntp server can also be implied on a ntpd level through /etc/ntp.conf. For example if you would like to add the local network IPs range 192.168.0.1/24 to access ntpd, in ntpd.conf should be added policy:
# Hosts on local network are less restricted.

restrict 192.168.0.1 mask 255.255.255.0 nomodify notrap
To deny all access to any machine to the ntpd server add in /etc/ntp.conf:
restrict default ignore
After making any changes to ntp.conf , a server restart is required to load the new config settings, e.g.:
[root@centos ~]# /sbin/service ntpd restart
In most cases I think it is better to imply restrictions on a iptables (firewall) level instead of bothering change the default ntp.conf
Once ntpd is running as daemon, the server listens for UDP connections on udp port 123, to see it use:
[root@centos ~]# netstat -tulpn|grep -i ntp

udp 0 0 10.10.10.123:123 0.0.0.0:* 29861/ntpd

udp 0 0 80.95.28.179:123 0.0.0.0:* 29861/ntpd

udp 0 0 127.0.0.1:123 0.0.0.0:* 29861/ntpd

udp 0 0 0.0.0.0:123 0.0.0.0:* 29861/ntpd
Tags: Auto, boot time, BSD, bsd unix, CentOS, configure, consequence, correct time, dport, Draft, early days of the internet, existence, feb 14, GNU, gnu linux, government, init, INPUT, internet server, level, linux distributions, list server, listserver, network time protocol, ntp daemon, ntp protocol, ntpd, ntpntpd, orgserver, package, Protocol, Redhat, root, rpm, server, server clock, server services, server system, server time, standard protocol, system, system clock, system time, time issue, time server, tool, typical problem, yum
Posted in Linux, System Administration | 1 Comment »
Thursday, November 24th, 2011 
As a System Administrator I need to check daily the log files produced on various GNU / Linux distributions or FreeBSD. This can sometimes take too much time if the old fashioned way using the normal system tools cat, less and tail etc. is used.
Reading logs one by one eats too much of my time and often as logs are reviewed in a hurry some crucial system irregularities, failed ssh or POP3 / Imap logins, filling disk spaces etc. are missed.
Therefore I decided to implement automated log parsing programs which will summary and give me an overview (helicopter view) on what were the system activities from the previous day (24h) until the moment I logged the system and issued the log analyzer program.
There are plenty of programs available out there that does “wide scale” log analysis, however there are two applications which on most GNU / Linux and BSD systems had become a de-facto standard programs to scan system log files for interesting lines.
These are:
- 1. logwatch – system log analyzer and reporter
- 2. logcheck – program to scan system log files for interesting lines
1. logwatch is by default installed on most of the Redhat based Linux systems (Fedora, RHEL, CentOS etc.). On Debian distributions and as far as I know (Ubuntu) and the other deb based distros logwatch is not installed by default. Most of the servers I manage these days are running Debian GNU / Linux so, to use logwatch I needed to install it from the available repository package, e.g.:
debian:~# apt-get install logwatch

...
logwatch is written in perl and with some big files to analyze, parsing them might take hell a lot of time. It does use a bunch of configuration scripts which defines how logwatch should read and parse the various services logwatch support by default. These conf scripts are also easily extensible, so if one has to analyze some undefined service in the conf files he can easily come up with a new conf script that will support the service/daemon of choice.Using logwatch is very easy, to get an overview about server system activity invoke the logwatch command:
debian:~# logwatch

################### Logwatch 7.3.6+cvs20080702-debian (07/02/08) ####################

Processing Initiated: Thu Nov 24 05:22:07 2011

Date Range Processed: yesterday

( 2011-Nov-23 )

Period is day.

Detail Level of Output: 0

Type of Output/Format: stdout / text

Logfiles for Host: debian

 #################################################
——————— dpkg status changes Begin ————-
Upgraded:
libfreetype6 2.3.7-2+lenny7 => 2.3.7-2+lenny8
libfreetype6-dev 2.3.7-2+lenny7 => 2.3.7-2+lenny8
———————- dpkg status changes End ————————-
——————— httpd Begin ————————
Requests with error response codes
400 Bad Request
HTTP/1.1: 2 Time(s)
admin/scripts/setup.php: 2 Time(s)
401 Unauthorized
…
…
———————- vpopmail End ————————-
——————— Disk Space Begin ————————
Filesystem Size Used Avail Use% Mounted on
/dev/md0 222G 58G 154G 28% /
———————- Disk Space End ————————-
###################### Logwatch End #########################
The execution might take up from 10 to 20 seconds up to 10 or 20 minutes depending on the log files size and the CPU / RAM hardware on the machine where /var/log/… logs will be analyzed.
logwatch output can be easily mailed to a custom mail address using a crontab if the server runs a properly configured SMTP server. Using a cron like:
00 5 * * * /usr/sbin/logwatch | mail -s "$(hostname) log files for $(date)"
Here is time to make a note that logwatch is ported also to FreeBSD and is available from BSD’s port tree, from a port with path:
/usr/ports/security/logcheck
2. logcheck is another handy program, which does very similar job to logwatch . The “interesting” information it returns is a bit less than compared to logwatch
The good thing about logcheck is that by default it is made to mail every 1 hour a brief data summary which might be of an interest to the sys admin.
Logcheck is available for install on RedHat distros via yum and has existing package for Debian as well as a port for FreeBSD under the port location /usr/ports/security/logcheck
To install on logcheck on Debian:
debian:~# apt-get install logcheck

...
After installation I found it wise to change the default mailing time from each and every hour to just once per day to prevent my email from overfilling with “useless” mails.
This is done by editting the default cron tab installed by the package located in /etc/cron.d/logcheck
The default file looks like so:
# /etc/cron.d/logcheck: crontab entries for the logcheck package

PATH=/usr/local/sbin:/usr/local/bin:/sbin:/bin:/usr/sbin:/usr/bin

MAILTO=root

@reboot logcheck if [ -x /usr/sbin/logcheck ]; then nice -n10 /usr/sbin/logcheck -R; fi

2 * * * * logcheck if [ -x /usr/sbin/logcheck ]; then nice -n10 /usr/sbin/logcheck; fi

# EOF
To change it run only once per day its content should looks something like:
# /etc/cron.d/logcheck: crontab entries for the logcheck package

PATH=/usr/local/sbin:/usr/local/bin:/sbin:/bin:/usr/sbin:/usr/bin

MAILTO=root

@reboot logcheck if [ -x /usr/sbin/logcheck ]; then nice -n10 /usr/sbin/logcheck -R; fi

2 5 * * * logcheck if [ -x /usr/sbin/logcheck ]; then nice -n10 /usr/sbin/logcheck; fi

# EOF
Altering it that way the log summary interesting info analysis will be sent on mail every day in 05:02 a.m.
Changing the default email logcheck will ship its log analyzer report emails on deb based distros is done via editting the file:
/etc/logcheck/logcheck.conf
And changing the SENDMAILTO=”” variable to point to the appropriate admin email email addr.
Tags: Begin, bsd systems, CentOS, configuration scripts, cron, Date, deb, debian distributions, debian gnu, Disk, dpkg, end, fedora, freebsd, gnu linux, helicopter view, hurry, imap, irregularities, libfreetype, linux distributions, linux systems, logcheck, logwatch, nbsp, Output, package, quot, reading, reading log files, reading logs, reporter, repository, Space, ssh, summary, system administrator, system tools, time, Ubuntu
Posted in FreeBSD, Linux, System Administration, Various | 1 Comment »
Monday, October 17th, 2011 Often when some of my companies, I’m employed with rents dedicated GNU / Linux servers co-located in data centers,
usually the local hostname is configured while the system is being installed, therefore many times when we forget to tell the Dedicated provider what kind of hostname, we’re intending to use they came up with some kind of hostname which is randomly set based on the dedicated provider’s company name or a server ID number. Cosenquently the machine hostname assigned due to company local server numbering policy.
Hence after one logs in to the newly purchased server with over SSH protocol, then we end up with a hostname like for example:
server56663:~#
This hostname naming, often doesn’t make much sense for the services running on the server and doesn’t have nothing to do to the provided internet services by the server, however its really important for me to orientate myself which server I have logged to. Therefore one of the first things I do while configuring a new server is to change the local server assigned hostname .
Besides having the hostname shown by the shell prompt, there is a quick command to print out the Fully Qualified Domain hostname, by issuing:
>server56663:~# hostname --fqdn

server56663.dedicompany.com
The Universal GNU / Linux way which works on almost all Linux distributions to change the configured hostname goes like this:
Edit /etc/hosts . A default /etc/hosts file looks something like:
server56663:~# cat /etc/hosts127.0.0.1 localhost.localdomain localhost

127.0.1.1 server56663.dedicompany.com server56663

# The following lines are desirable for IPv6 capable hosts

::1 ip6-localhost ip6-loopback

fe00::0 ip6-localnet

ff00::0 ip6-mcastprefix

ff02::1 ip6-allnodes

ff02::2 ip6-allrouters
On the second line which assigns the hostname for the loopback IP address 127.0.0.1 , you see the identifier for the local hostname:
127.0.1.1 server56663.dedicompany.com server56663
To change that to a custom local hostname of choice, the line should be modified to look like:
127.0.1.1 CustomHostName server56663.dedicompany.com server56663
On some GNU / Linux distributions the line 127.0.1.1 might be completely absent, this is the case with for example CentOS and Fedora and many other distros
On these Gnu / Linux distributions the /etc/hosts might looks like:
# Do not remove the following line, or various programs# that require network functionality will fail.127.0.0.1 localhost.localdomain localhost
Alas on Fedora, CentOS and other distros to set the localhost hostname, one more line should be added to /etc/hosts . The line to add looks like so:
123.123.123.123 CustomHostName
After modification and adding the custom hostname name there the file should look something like:
[root@centos ~]# cat /etc/hosts127.0.0.1 localhost localhost123.123.123.123 CustomHostName
After including correct records in /etc/hosts , next the hostname command is used to change the localhost name configured to show as a machine name on user ssh login:
server56663:~# hostname CustomHostName

server56663:~#
Further to check that the new hostname is set for all ssh sessions incoming to the ssh server from now on the hostname command is used without arguments:
server56663:~# hostname

CustomHostName
Even though now the hostname is changed to CustomHostName still, the hostname for the current opened ssh session is keeping the old hostname:
server56663:~# hostname

server56663
To see the hostname change in your shell prompt you will have to logout and login again to the system.
Here its good to mention the Linux kernel has a variable kernel.hostname, which can be used to set the local machine hostname. Actually the hostname command automatically set the kernel.hostname kernel variable.
If of course one want to change the kernel var directly without using the hostname command, this can be achieved with sysctl, e.g.:
server56663:~# sysctl kernel.hostname=CustomHostName
On Debian GNU / Linux the way to change the hostname there is a “debian way” approach:
Debian has a file /etc/hostname , which is there just for the sake of configuring the system hostname. During system boot process Debian reads /etc/hostname file and sets the machine hostname to the word inside. The /etc/hostname file is being red and configured by Debian’s /etc/init.d/hostname.sh shell script.
Therefore after changing the hostname in Debian by editting /etc/honstmame , the /etc/init.d/hostname.sh needs to be invoked for the new hostname to be set system wide, like so;
server56663:~# /etc/init.d/hostname.sh
Just like with other GNU / Linux distributions for the new hostname to be active on the current shell a logout and login via ssh is necessery again.
With Fedora, CentOS and other Redhat based distributions the “proper” way to change the hostname is:
a. change the /etc/hosts way described above in the aticle.
b. Edit /etc/sysconfig/network file and write inside the new custom hostname.
[root@centos ~]# grep -i hostname /etc/sysconfig/network

HOSTNAME=localhost.localdomain
After HOSTNAME value is set to the new desired hostname and file is saved, the network script should be invoke with restart argument:
[root@centos ~]# /etc/init.d/network restart
One more thing to consider always when changing a hostname is that some of the system services are using the configured local machine hostname, and hence need to be restarted also from a active shell where the new hostname is already set and active.
Since the system hostname is being configured usually, with the rest of server configurations on system boot, after setting the desired hostname it is a good idea to have a system reboot. This will guarantee that all running daemons will read the newly set hostname:
E.g.:
server56663:~# shutdown -r now
On next boot the hostname should be set to whatever you put as a custom hostname.
Tags: allnodesff, allroutersOn, CentOS, change, com, custom, doesn, domain, file, gnu linux, hostname, hosts file, init, internet services, ip6, Linux, linux distributions, linux servers, localdomain, localhost, localnet, localnetff, login, logs, loopback, mcastprefix, mcastprefixff, number, orientate, Protocol, Qualified, quot, rents, root, sense, server id, Shell, something, ssh, Universal
Posted in Linux, System Administration, Various | 1 Comment »
Friday, September 30th, 2011 Just run across across a super nice top like, program for system administrators, its called nethogs and is definitely entering my “l337” admin outfit next to tools like iftop, nettop, ettercap, darkstat htop, iotop etc.
nethogs is ultra easy to use, to get immediately in console statistics about running processes UPLOAD and DOWNLOAD bandwidth consumption just run it:
linux:~# nethogs
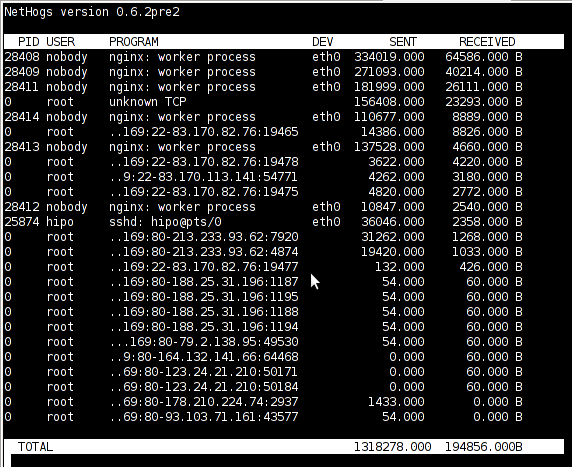
Nethogs running on Debian GNU/Linux serving static web content with Nginx
If you need to check what program is using what amount of network bandwidth, you will definitely love this tool. Having information of bandwidth consumption is also viewable partially with iftop, however iftop is unable to track the bandwidth consumption to each process using the network thus it seems nethogs is unique at what it does.
Nethogs supports IPv4 and IPv6 as well as supports network traffic over ppp. The tool is available via package repositories for Debian GNU/Lenny 5 and Debian Squeeze 6.
To install Nethogs on CentOS and Fedora distributions, you will have to install it from source. On CentOS 5.7, latest nethogs which as of time of writting this article is 0.8.0 compiles and installs fine with make && make install commands.
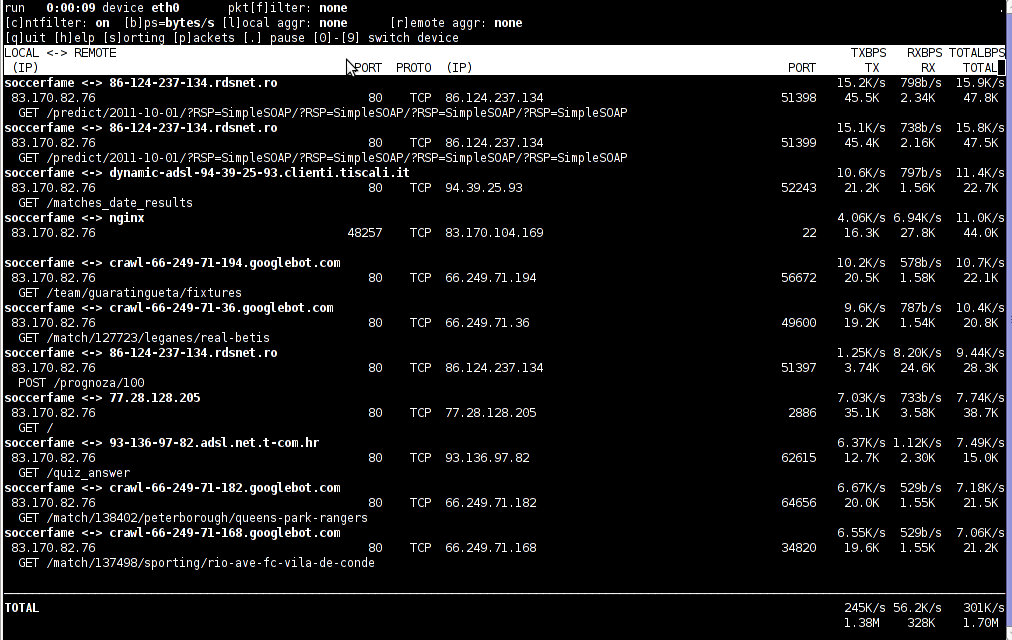
In the manner of thoughts of network bandwidth monitoring, another very handy tool to add extra understanding on what kind of traffic is crossing over a Linux server is jnettop
jnettop shows which hosts/ports is taking up the most network traffic.
It is available for install via apt in Debian 5/6).
Here is a screenshot on jnettop in action:
To install jnettop on latest Fedoras / CentOS / Slackware Linux it has to be download and compiled from source via jnettop’s official wiki page
I’ve tested jnettop install from source on CentOS release 5.7 and it seems to compile just fine using the usual compile commands:
[root@prizebg jnettop-0.13.0]# ./configure

...

[root@prizebg jnettop-0.13.0]# make

...

[root@prizebg jnettop-0.13.0]# make install
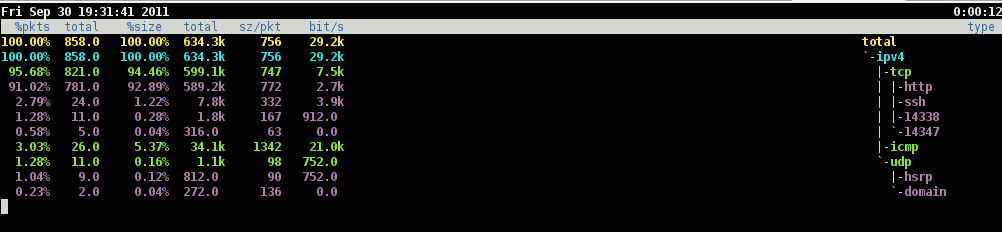
If you need to have an idea on the network traffic passing by your Linux server distringuished by tcp/udp/icmp network protocols and services like ssh / ftp / apache, then you will definitely want to take a look at nettop (if of course not familiar with it yet).
Nettop is not provided as a deb package in Debian and Ubuntu, where it is included as rpm for CentOS and presumably Fedora?
Here is a screenshot on nettop network utility in action:
FreeBSD users should be happy to find out that jnettop and nettop are part of the ports tree and the two can be installed straight, however nethogs would not work on FreeBSD, I searched for a utility capable of what Nethogs can, but couldn’t find such.
It seems the only way on FreeBSD to track bandwidth back and from originating process is using a combination of iftop and sockstat utilities. Probably there are other tools which people use to track network traffic to the processes running on a hos and do general network monitoringt, if anyone knows some good tools, please share with me.
Tags: action, amount, bandwidth consumption, CentOS, centos 5, configure, consumption, darkstat, debian gnu, distributions, ettercap, fedora, gnu linux, handy tool, information, l337, Linux, linux server, Monitoring, nbsp, Nethogs, network bandwidth, network traffic, nginx, package, page, ppp, prizebg, quot, repositories, root, running processes, screenshot, slackware linux, squeeze, static web, system administrators, time, tool, upload, web content
Posted in FreeBSD, Linux, System Administration | No Comments »
Friday, September 30th, 2011 
If you're looking for a command line utility to generate PDF file out of any webpage located online you are looking for Wkhtmltopdf
The conversion of webpages to PDF by the tool is done using Apple's Webkit open source render.
wkhtmltopdf is something very useful for web developers, as some webpages has a requirement to produce dynamically pdfs from a remote website locations.
wkhtmltopdf is shipped with Debian Squeeze 6 and latest Ubuntu Linux versions and still not entered in Fedora and CentOS repositories.
To use wkhtmltopdf on Debian / Ubuntu distros install it via apt;
linux:~# apt-get install wkhtmltodpf

...
Next to convert a webpage of choice use cmd:
linux:~$ wkhtmltopdf www.pc-freak.net www.pc-freak.net_website.pdf

Loading page (1/2)

Printing pages (2/2)

Done
If the web page to be snapshotted in long few pages a few pages PDF will be generated by wkhtmltopdf
wkhtmltopdf also supports to create the website snapshot with a specified orientation Landscape / Portrait
-O Portrait options to it, like so:
linux:~$ wkhtmltopdf -O Portrait www.pc-freak.net www.pc-freak.net_website.pdf
wkhtmltopdf has many useful options, here are some of them:
- Javascript disabling – Disable support for javascript for a website
- Grayscale pdf generation – Generates PDf in Grayscale
- Low quality pdf generation – Useful to shrink the output size of generated pdf size
- Set PDF page size – (A4, Letter etc.)
- Add zoom to the generated pdf content
- Support for password HTTP authentication
- Support to use the tool over a proxy
- Generation of Table of Content based on titles (only in static version)
- Adding of Header and Footers (only in static version)
To generate an A4 page with wkhtmltopdf:
wkhtmltopdf -s A4 www.pc-freak.net/blog/ www.pc-freak.net_blog.pdf
wkhtmltopdf looks promising but seems a bit buggy still, here is what happened when I tried to create a pdf without setting an A4 page formatting:
linux:$ wkhtmltopdf www.pc-freak.net/blog/ www.pc-freak.net_blog.pdf

Loading page (1/2)

OpenOffice path before fixup is '/usr/lib/openoffice' ] 71%

OpenOffice path is '/usr/lib/openoffice'

OpenOffice path before fixup is '/usr/lib/openoffice'

OpenOffice path is '/usr/lib/openoffice'

** (:12057): DEBUG: NP_Initialize

** (:12057): DEBUG: NP_Initialize succeeded

** (:12057): DEBUG: NP_Initialize

** (:12057): DEBUG: NP_Initialize succeeded

** (:12057): DEBUG: NP_Initialize

** (:12057): DEBUG: NP_Initialize succeeded

** (:12057): DEBUG: NP_Initialize

** (:12057): DEBUG: NP_Initialize succeeded

Printing pages (2/2)

Done

Printing pages (2/2)

Segmentation fault
Debian and Ubuntu version of wkhtmltopdf does not support TOC generation and Adding headers and footers, to support it one has to download and install the static version of wkhtmltopdf
Using the static version of the tool is also the only option for anyone on Fedora or any other RPM based Linux distro.
Tags: apple, authentication support, CentOS, choice, command, command line utility, content support, conversion, DEBUG, DoneIf, fedora, freak, generation, gnu linux, Grayscale, Initialize, Javascript, Landscape, landscape portrait, line, Linux, linux versions, loading page, low quality, nbsp, online, Open, open source, OpenOffice, orientation, page, password, PDF, pdf content, pdf size, portrait options, printing, quality pdf, repositories, requirement, Set, size a4, snapshot, something, squeeze, static version, support, table of content, tool, Ubuntu, use, Useful, web developers, web page, Webkit, webpage, www
Posted in Linux Audio & Video, System Administration, Various, Web and CMS | 2 Comments »
Wednesday, September 28th, 2011 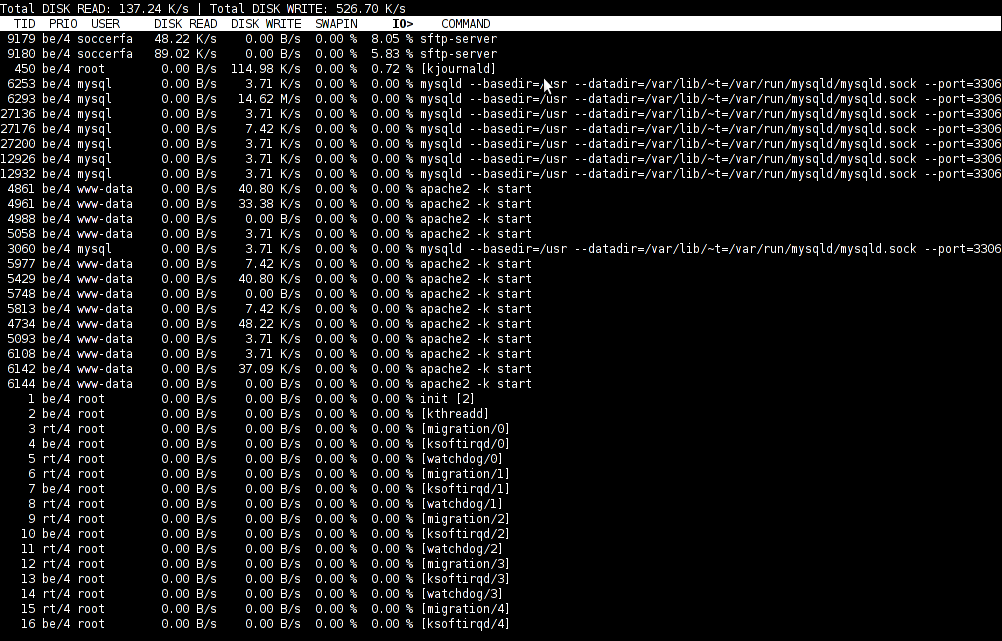
To find out which programs are causing the most read/write overhead on a Linux server one can use iotop
Here is the description of iotop – simple top-like I/O monitor, taken from its manpage.
iotop does precisely the same as the classic linux top but for hard disk IN/OUT operations.
To check the overhead caused by some daemon on the system or some random processes launching iotop without any arguments is enough;
debian:~# iotop
The main overview of iostat statistics, are the:
Total DISK READ: xx.xx MB/s | Total DISK WRITE: xx.xx K/s
If launching iotop, shows a huge numbers and the server is facing performance drop downs, its a symptom for hdd i/o overheads.
iotop is available for Debian and Ubuntu as a standard package part of the distros repositories. On RHEL based Linuxes unfortunately, its not available as RPM.
While talking about keeping an eye on hard disk utilization and disk i/o’s as bottleneck and a possible pitfall to cause a server performance down, it’s worthy to mention about another really great tool, which I use on every single server I administrate. For all those unfamiliar I’m talking about dstat
dstat is a – versatile tool for generating system resource statistics as the description on top of the manual states. dstat is great for people who want to have iostat, vmstat and ifstat in one single program.
dstat is nowdays available on most Linux distributions ready to be installed from the respective distro package manager. I’ve used it and I can confirm tt is installable via a deb/rpm package on Fedora, CentOS, Debian and Ubuntu linuces.
Here is how the tool in action looks like:

The most interesting things from all the dstat cmd output are read, writ and recv, send , they give a good general overview on hard drive performance and if tracked can reveal if the hdd disk/writes are a bottleneck to create server performance issues.
Another handy tool in tracking hdd i/o problems is iostat its a tool however more suitable for the hard core admins as the tool statistics output is not easily readable.
In case if you need to periodically grasp data about disks read/write operations you will definitely want to look at collectl i/o benchmarking tool .Unfortunately collect is not included as a packaget for most linux distributions except in Fedora. Besides its capabilities to report on servers disk usage, collect is also capable to show brief stats on cpu, network.
Collectl looks really promosing and even seems to be in active development the latest tool release is from May 2011. It even supports NVidia’s GPU monitoring 😉 In short what collectl does is very similar to sysstat which by the way also has some possibilities to track disk reads in time. collectl’s website praises the tool, much and says that in most machines the extra load the tool would add to a system to generate reports on cpu, disk and disk io is < 0.1%. I couldn’t find any data online on how much sysstat (sar) extra loads a system. It will be interesting if some of someone concluded some testing and can tell which of the two puts less load on a system.
Tags: action, bottleneck, CentOS, cmd, description, Disk, disk utilization, drive, drive performance, drop, eye, generating system, GNU, gnu linux, handy tool, interesting things, Linux, linux server, linux top, linuxes, manager, manual states, most linux distributions, overhead, package, performance drop, performance issues, pitfall, program, random processes, recv, repositories, resource statistics, server performance, sIf, system, system resource, tool, Ubuntu, versatile, versatile tool, vmstat
Posted in Linux, System Administration, Various | 5 Comments »


