Posts Tagged ‘quot’

How to take multiple screenshots with scrot and ImageMagick import commands in terminal on GNU / Linux and FreeBSD

Friday, January 13th, 2012

scrot and import are two commands, which can be used to take screenshot in terminal on Linux and FreeBSD:

To use scrot cmd to take screenshots on Ubuntu and Debian the scrot package has to be installed:

noah:~# apt-get install scrot
...

scrot should also be available on most other Linux distributions in the main repositories, I'll be glad to hear if someone has used it on Fedora, SUSE etc.

On FreeBSD, there is a port called scrot , to install on FreeBSD:

freebsd# cd /usr/ports/graphics/scrot
freebsd# make install clean
...

Scrot has plenty of nice arguments one can use to make a screenshot. Maybe the most handy one in my view is after a preliminary set delay before screenshot is taken.

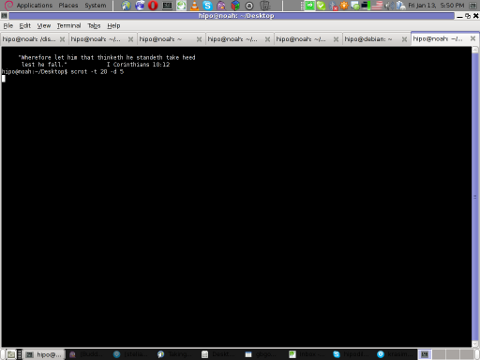
To take screenshot with it after lets say 5 seconds delay before the screenshot:

hipo@noah:~/Desktop$ scrot -t 20 -d 5

Screenshot scrot my debian Linux gnome-termina

To put an year, month and day and year followed by screen resolution with scrot :

hipo@noah:~$ scrot '%Y-%m-%d_$wx$h.png'

Another way to take a screenshot of screen with command is by using ImageMagick'simport image manipulation package.
To take screenshot of the current screen via terminal using import , type in xterm, gnome-termina or Gnome's Run Application (ALT+F2)

hipo@noah:~$ import -window root ScreenShot.png

To make import command to save the taken screenshot in a format (minute:hour:day:month:year)i :

hipo@noah:~$ import -window root $screenshot_dir/screenshot-$(date +%M_%k_%d_%m_%Y|sed -e 's/^ *//').png

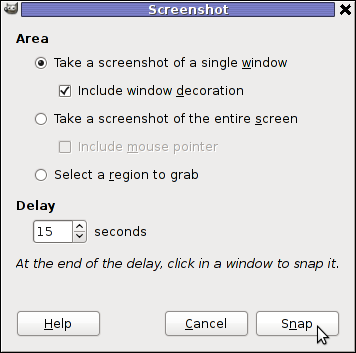
Taking a delayed screenshot is also possible via The GIMP via menus File -> Create -> Screenshot

GIMP Screenshot 15 seconds delay GIMP window screenshot

Now here is an interesting question, what if I would like to take periodic screenshots of what I do on my Desktop to take random movie scenes from a movie I watch with totem or vlc??

This task is quite easily achiavable with a little bash shell script, I wrote:

screenshot_dir='Screenshots';
seconds='60';
if [ ! -d "$screenshot_dir" ]; then
mkdir $screenshot_dir;
fi
while [ 1 ]; do
sleep $seconds;
(import -window root $screenshot_dir/screenshot-$(date +%M_%k_%d_%m_%Y|sed -e 's/^ *//').png) &
done

This script will take screenshot automatically to Screenshots/ directory every (1 min – 60 seconds)
You can also my downloads take_screenshot_every_60_secs_import.sh here

To use take_screenshot_every_60_secs_import.sh just issue the script inside xterm or gnome-terminal, after that simply use your computer as you normally would.
The script will take snapshots every minute and store all taken screenshots in Screenshots dir.

If you prefer to use scrot to take automatically the screenshots every lets say 5 minutes, you can use a script like:

screenshot_dir='Screenshots';
# 300 secs (5 mins)seconds='300';
if [ ! -d "$screenshot_dir" ]; then
mkdir $screenshot_dir;
fi
while [ 1 ]; do
sleep $seconds;
(scrot $screenshot_dir/'%Y-%m-%d_$wx$h.png') &
done

You can fetch take_screenshot_every_60_secs_scrot.sh here

The script using scrot is better in terms of efficiency, the system load scrot will put on your machine will be less.
Using some of this scripts will be handy if you need screenshots to Movies, Programs and favourite Free Software games.
Hope this is educative to someone 😉

My cousin’s Marriage – Impressian from Burgas (Bulgaria) marriage and Kamenartzi herbal healer

Sunday, March 9th, 2008

kamenar-near-burgas-herbal-healing-bai-Dimitar-natural-healear-who-was-healing-cancer
We (Me and My Family) had to stand up early in the morning around 4:30 in Saturday and we traveled to Burgas. First we had to go to a herbman to prescribe me some Herbs. The herbamn is called “bai Dimitar” where bai is a bulgarian specific title for a man on age after the middle age he is located in Kamenartzi village (a small village near Bourgas). He is a sort of strange guy and is speaking very strange things. I hope this herbs will help me. I have to boil them and drink them five times a day. After that we went to Bourgas in my aunt Galia and uncle Galen’s apartment. Everything was a sort was going smooth, Gergana my cousin which was going to merry dressed with a bride dress and waited for his future man (son-in-law). The guy appeared with a limosine and an orchestra. Some ordinary Bulgarian rituals were followed after that the ceremony continued in the council house. Where they became man and wife officially (in front of Bulgaria). After that it followed a celebration in a Bourgas Hotel called “Bulgaria”. The celebration of the marriage included again different traditional Bulgarian dances, guest also danced and ofcourse the Bulgarian familiar horos. I did eat a lot of food and drinked a lot of the meaningless of marriage and all this vanity into celebrity and a lot of empty words spokened there I also convinced myself that I would NEVER EVER allow to have a marriage celebration like this. Some 20 or 30% of the music was Chalga which ofcourse drived me mad. In somewhere 05:00 in the morning we traveled back by car with my father driving. My father is driver from some few months and I definetely can’t say he is an experiencable type of driver which may allow himself to drive with speed higher than the maximum allowed, anywayz he did and I just tried to make him aware that he is braking the driver codex rules. He instead of taking my notes which I made with the idea that I would like to be home back ALIVE, nagged him and he started yelling at me and telling me to stop to complain. That ended in again making me hate him and regret I have parents like this which was a expected to happen since I was angry at all the stupidity and the low intelectual level of most of the ppl who were invited into the Marriage ceremony (although most of them were businessman and a ppl with a high degrees, education). The thing that irritated me the most that the had a marriage ceremony in a orthodox Church and they probably did this just because this is the ordinary way most ppl in Bulgaria does. PFF.. I have slept just for a hour or two today so I probably will go to sleep soon. But first I intend to go for a Liturgy in St. George’s orthodox church. This is after 20 minutes from now. Well thats most of how I spend my saturday on “nothing”. The good thing from all that was that Niki, a.k.a. Nomen’s brother has given me his PSP for the weekend. So I had the time to examine it and generally play with it. I even used a free wifi access in the restaurant where we were and did a bit of browsing :)END—–

How to disable IPv6 on Debian / Ubuntu / CentOS and RHEL Linux

Friday, December 9th, 2011

I have few servers, which have automatically enabled IPv6 protocols (IPv6 gets automatically enabled on Debian), as well as on most latest Linux distribituions nowdays.

Disabling IPv6 network protocol on Linux if not used has 2 reasons:

1. Security (It’s well known security practice to disable anything not used on a server)
Besides that IPv6 has been known for few criticil security vulnerabilities, which has historically affected the Linux kernel.
2. Performance (Sometimes disabling IPv6 could have positive impact on IPv4 especially on heavy traffic network servers).
I’ve red people claiming disabling IPv6 improves the DNS performance, however since this is not rumors and did not check it personally I cannot positively confirm this.

Disabling IPv6 on all GNU / Linuces can be achieved by changing the kernel sysctl settings net.ipv6.conf.all.disable_ipv6 by default net.ipv6.conf.all.disable_ipv6 equals 1 which means IPv6 is enabled, hence to disable IPv6 I issued:

server:~# sysctl net.ipv6.conf.all.disable_ipv6=0

To set it permanently on system boot I put the setting also in /etc/sysctl.conf :

server:~# echo 'net.ipv6.conf.all.disable = 1 >> /etc/sysctl.conf

The aforedescribed methods should be working on most Linux kernels version > 2.6.27 in that number it should work 100% on recent versions of Fedora, CentOS, Debian and Ubuntu.

To disable IPv6 protocol on Debian Lenny its necessery to blackist the ipv6 module in /etc/modprobe.d/blacklist by issuing:

echo 'blacklist ipv6' >> /etc/modprobe.d/blacklist

On Fedora / CentOS there is a another universal “Redhat” way disable IPv6.

On them disabling IPv6 is done by editting /etc/sysconfig/network and adding:

NETWORKING_IPV6=no
IPV6INIT=no

I would be happy to hear how people achieved disabling the IPv6, since on earlier and (various by distro) Linuxes the way to disable the IPv6 is probably different.
 

Alto to stop Iptables IPV6 on CentOS / Fedora and RHEL issue:

# service ip6tables stop

# service ip6tables off

How to harden Linux Security and imprpove network efficiency on Kernel sysctl Level to Stop SYN flood

Friday, July 8th, 2011

Power up Linux and protect against DDoS with sysctl var optimization

Some long time ago I’ve written an article Optimizing Linux tcp/ip networking

In the article I’ve examined a number of Linux kernel sysctl variables, which significantly improve the way TCP/IP networking is handled by a non router Linux based servers.

As the time progresses I’ve been continuing to read materials on blogs and internet sites on various tips and anti Denial of Service rules which one could apply on newly installed hosting (Apache/MySql/Qmail/Proxy) server to improve webserver responce times and tighten the overall security level.

In my quest for sysctl 😉 I found a few more handy sysctl variables apart from the old ones I incorporate on every Linux server I adminstrate.
The sysctl variables improves the overall network handling efficiency and protects about common SYN/ACK Denial of service attacks.

Here are the extra sysctl variables I started incorporating just recently:

############ IPv4 Sysctl Settings ################
#Enable ExecShield protection (randomize virtual assigned space to protect against many exploits)
kernel.randomize_va_space = 1
#Increase the number of PIDs processes could assign this is very needed especially on more powerful servers
kernel.pid_max = 65536
# Prevent against the common 'syn flood attack'
net.ipv4.tcp_syncookies = 1
# Controls the use of TCP syncookies two is generally a better idea, though you might experiment
#net.ipv4.tcp_syncookies = 1
net.ipv4.tcp_synack_retries = 2
##################################################
#
############## IPv6 Sysctl Settings ################
# Number of Router Solicitations to send until assuming no routers are present.
net.ipv6.conf.default.router_solicitations = 0
# Accept Router Preference in RA? Again not necessery if the server is not a router
net.ipv6.conf.default.accept_ra_rtr_pref = 0
# Learn Prefix Information in Router Advertisement (Unnecessery) for non-routers
net.ipv6.conf.default.accept_ra_pinfo = 0
# disable accept of hop limit settings from other routers (could be used for DoS)
net.ipv6.conf.default.accept_ra_defrtr = 0
# disable ipv6 global unicasts server assignments
net.ipv6.conf.default.autoconf = 0
# neighbor solicitations to send out per address (better if disabled)
net.ipv6.conf.default.dad_transmits = 0
# disable assigning more than 1 address per network interface
net.ipv6.conf.default.max_addresses = 1
#####################################################


To use this settings paste the above sysctl variables in /etc/sysctl.conf and ask sysctl command to read and apply the newly added conf settings:

server:~# sysctl -p
...

Hopefully you should not get errors while applying the sysctl settings, if you get some errors, it’s possible some of the variable is differently named (depending on the Linux kernel version) or the Linux distribution on which sysctl’s are implemented.

For some convenience I’ve created unified sysctl variables /etc/sysct.conf containing the newly variables I started implementing to servers with the ones I already exlpained in my previous post Optimizing Linux TCP/IP Networking

Here is the optimized / hardened sysctl.conf file for download

I use this exact sysctl.conf these days on both Linux hosting / VPS / Mail servers etc. as well as on my personal notebook 😉

Here is also the the complete content of above’s sysctl.conf file, just in case if somebody wants to directly copy/paste it in his /etc/sysctl.conf

# Sysctl kernel variables to improve network performance and protect against common Denial of Service attacks
# It's possible that not all of the variables are working on all Linux distributions, test to make sure
# Some of the variables might need a slight modification to match server hardware, however in most cases it should be fine
# variables list compiled by hip0
### https://www.pc-freak.net
#### date 08.07.2011
############ IPv4 Sysctl Kernel Settings ################
net.ipv4.ip_forward = 0
# ( Turn off IP Forwarding )
net.ipv4.conf.default.rp_filter = 1
# ( Control Source route verification )
net.ipv4.conf.default.accept_redirects = 0
# ( Disable ICMP redirects )
net.ipv4.conf.all.accept_redirects = 0
# ( same as above )
net.ipv4.conf.default.accept_source_route = 0
# ( Disable IP source routing )
net.ipv4.conf.all.accept_source_route = 0
# ( - || - )net.ipv4.tcp_fin_timeout = 40
# ( Decrease FIN timeout ) - Useful on busy/high load server
net.ipv4.tcp_keepalive_time = 4000
# ( keepalive tcp timeout )
net.core.rmem_default = 786426
# Receive memory stack size ( a good idea to increase it if your server receives big files )
##net.ipv4.tcp_rmem = "4096 87380 4194304"
net.core.wmem_default = 8388608
#( Reserved Memory per connection )
net.core.wmem_max = 8388608
net.core.optmem_max = 40960
# ( maximum amount of option memory buffers )
# tcp reordering, increase max buckets, increase the amount of backlost
net.ipv4.tcp_max_tw_buckets = 360000
net.ipv4.tcp_reordering = 5
##net.core.hot_list_length = 256
net.core.netdev_max_backlog = 1024
#Enable ExecShield protection (randomize virtual assigned space to protect against many exploits)
kernel.randomize_va_space = 1
#Increase the number of PIDs processes could assign this is very needed especially on more powerful servers
kernel.pid_max = 65536
# Prevent against the common 'syn flood attack'net.ipv4.tcp_syncookies = 1
# Controls the use of TCP syncookies two is generally a better idea, though you might experiment
#net.ipv4.tcp_syncookies = 1
net.ipv4.tcp_synack_retries = 2
###################################################
############## IPv6 Sysctl Settings ################
# Number of Router Solicitations to send until assuming no routers are present.
net.ipv6.conf.default.router_solicitations = 0
# Accept Router Preference in RA? Again not necessery if the server is not a router
net.ipv6.conf.default.accept_ra_rtr_pref = 0
# Learn Prefix Information in Router Advertisement (Unnecessery) for non-routersnet.
ipv6.conf.default.accept_ra_pinfo = 0
# disable accept of hop limit settings from other routers (could be used for DoS)
net.ipv6.conf.default.accept_ra_defrtr = 0
# disable ipv6 global unicasts server assignmentsnet.
ipv6.conf.default.autoconf = 0
# neighbor solicitations to send out per address (better if disabled)
net.ipv6.conf.default.dad_transmits = 0
# disable assigning more than 1 address per network interfacenet.
ipv6.conf.default.max_addresses = 1
#####################################################
# Reboot if kernel panic
kernel.panic = 20

These sysctl settings will tweaken the Linux kernel default network settings performance and you will notice the improvements in website responsiveness immediately in some cases implementing this kernel level goodies will make the server perform better and the system load might decrease even 😉

This optimizations on a kernel level are not only handy for servers, their implementation on Linux Desktop should also have a positive influence on the way the network behaves and could improve significantly the responce times of opening pages in Firefox/Opera/Epiphany Torrent downloads etc.

Hope this kernel tweakenings are helpful to someone.
Cheers 😉

Text Monitoring of connection server (traffic RX / TX) business in ASCII graphs with speedometer / Easy Monitor network traffic performance

Friday, May 4th, 2012

While reading some posts online related to MS-Windows TcpViewnetwork traffic analyzing tool. I've came across very nice tool for tracking connection speed for Linux (Speedometer). If I have to compare it, speedometer is somehow similar to nethogs and iftop bandwidth network measuring utilities .

What differentiates speedometer from iftop / nethogs / iptraf is it is more suitable for visualizing a network file or data transfers.
The graphs speedometer draws are way easier to understand, than iftop graphs.

Even complete newbies can understand it with no need for extraordinary knowledge in networking. This makes Speedometer, a top tool to visually see the amount of traffic flowing through server network interface (eth0) … (eth1) etc.

What speedometer shows is similar to the Midnight Commander's (mc) file transfer status bar, except the statistics are not only for a certain file transfer but can show overall statistics over server passing network traffic amount (though according to its manual it can be used to also track individual file transfers).

The simplicity for basic use makes speedometer nice tool to track for network congestion issues on Linux. Therefore it is a  must have outfit for every server admin. Below you see a screenshot of my terminal running speedometer on a remote server.
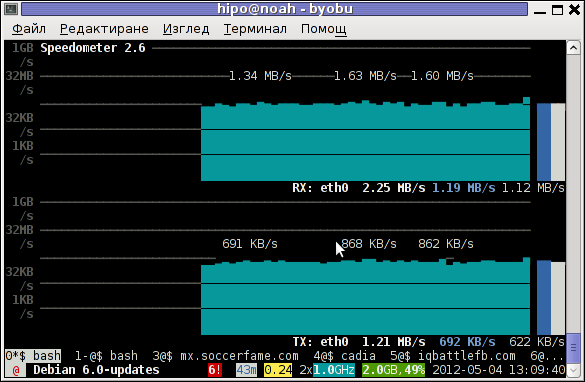
Speedometer ascii traffic track server network business screenshot in byobu screen like virtual terminal emulator

1. Installing speedometer on Debian / Ubuntu and Debian derivatives

For Debian and Ubuntu server administrators speedometer is already packaged as a deb so its installation is as simple as:

debian:~# apt-get --yes install speedometer
....

2. Installing speedometer from source for other Linux distributions CentOS, Fedora, SuSE etc.

Speedometer is written in python programming language, so in order to install and use on other OS Linux platforms, it is necessery to have installed (preferably) an up2date python programming language interpreter (python ver. 2.6 or higher)..
Besides that it is necessary to have installed the urwid -( console user interface library for Python) available for download via excess.org/urwid/


Hence to install speedometer on RedHat based Linux distributions one has to follow these steps:

a) Download & Install python urwid library

[root@centos ~]# cd /usr/local/src
[root@centos src]# wget -q http://excess.org/urwid/urwid-1.0.1.tar.gz
[root@centos src]# tar -zxvvf urwid-1.0.1.tar.gz
....
[root@centos src]# cd urwid-1.0.1
[root@centos urwid-1.0.1]# python setup.py install
running install
running build
running build_py
creating build
creating build/lib.linux-i686-2.4
creating build/lib.linux-i686-2.4/urwid
copying urwid/tests.py -> build/lib.linux-i686-2.4/urwid
copying urwid/command_map.py -> build/lib.linux-i686-2.4/urwid
copying urwid/graphics.py -> build/lib.linux-i686-2.4/urwid
copying urwid/vterm_test.py -> build/lib.linux-i686-2.4/urwid
copying urwid/curses_display.py -> build/lib.linux-i686-2.4/urwid
copying urwid/display_common.py -> build/lib.linux-i686-2.4/urwid
....

b) Download and install python-setuptools

python-setuptools is one other requirement of speedometer, happily on CentOS and Fedora the rpm package is already there and installable with yum:

[root@centos ~]# yum -y install python-setuptools
....

c) Download and install Speedometer

[root@centos urwid-1.0.1]# cd /usr/local/src/
[root@centos src]# wget -q http://excess.org/speedometer/speedometer-2.8.tar.gz
[root@centos src]# tar -zxvvf speedometer-2.8.tar.gz
.....
[root@centos src]# cd speedometer-2.8
[root@centos speedometer-2.8]# python setup.py install
Traceback (most recent call last):
File "setup.py", line 26, in ?
import speedometer
File "/usr/local/src/speedometer-2.8/speedometer.py", line 112
n = n * granularity + (granularity if r else 0)
^

While running the CentOS 5.6 installation of speedometer-2.8, I hit the
"n = n * granularity + (granularity if r else 0)
error.

After consultation with some people in #python (irc.freenode.net), I've figured out this error is caused due the outdated version of python interpreter installed by default on CentOS Linux 5.6. On CentOS 5.6 the python version is:

[root@centos ~]# python -V
Python 2.4.3

As I priorly said speedometer 2.8's minimum requirement for a python to be at v. 2.6. Happily there is quick way to update python 2.4 to python 2.6 on CentOS 5.6, as there is an RPM repository maintained by Chris Lea which contains RPM binary of python 2.6.

To update python 2.4 to python 2.6:

[root@centos speedometer-2.8]# rpm -Uvh http://yum.chrislea.com/centos/5/i386/chl-release-5-3.noarch.rpm[root@centos speedometer-2.8]# rpm --import /etc/pki/rpm-gpg/RPM-GPG-KEY-CHL[root@centos speedometer-2.8]# yum install python26

Now the newly installed python 2.6 is executable under the binary name python26, hence to install speedometer:

[root@centos speedometer-2.8]# python26 setup.py install
[root@centos speedometer-2.8]# chown root:root /usr/local/bin/speedometer
[root@centos speedometer-2.8]# chmod +x /usr/local/bin/speedometer

[root@centos speedometer-2.8]# python26 speedometer -i 1 -tx eth0

The -i will instruct speedometer to refresh the screen graphs once a second.

3. Using speedometer to keep an eye on send / received traffic network congestion

To observe, the amount of only sent traffic via a network interface eth0 with speedometer use:

debian:~# speedometer -tx eth0

To only keep an eye on received traffic through eth0 use:

debian:~# speedometer -rx eth0

To watch over both TX and RX (Transmitted and Received) network traffic:

debian:~# speedometer -tx eth0 -rx eth0

If you want to watch in separate windows TX and RX traffic while  running speedometer you can run in separate xterm windows speedometer -tx eth0 and speedometer -rx eth0, like in below screenshot:
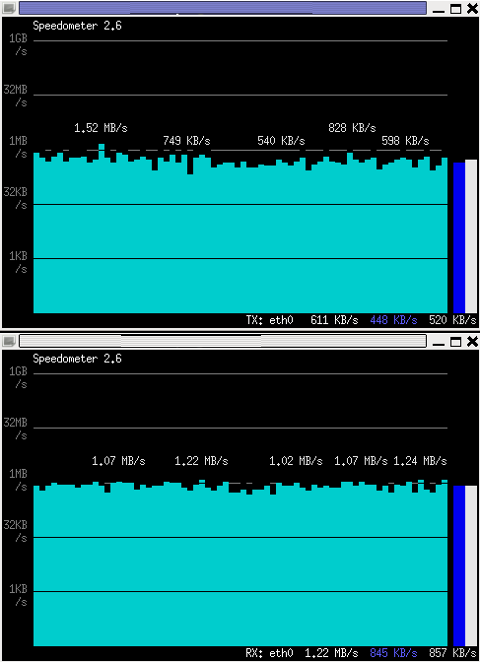
Monitor Received and Transmitted server Network traffic in two separate xterm windows with speedometer ascii graphs

4. Using speedometer to test network maximum possible transfer speed between server (host A) and server (host B)

The speedometer manual suggests few examples one of which is:

How fast is this LAN?

host-a$ cat /dev/zero | nc -l -p 12345
host-b$ nc host-a 12345 > /dev/null
host-b$ speedometer -rx eth0

When I red this example in speedometer's manual, it wasn't completely clear to me what the author really meant, but a bit after when I thought over the example I got his point.

The idea behind this example is that a constant stream of zeros taken from /dev/zero will be streamed over via a pipe (|) to nc which will bind a port number 12345, anyone connecting from another host machine, lets say a server with host host-b to port 12345 on machine host-a will start receiving the /dev/zero streamed content.

Then to finally measure the streamed traffic between host-a and host-b machines a speedometer is started to visualize the received traffic on network interface eth0, thus measuring the amount of traffic flowing from host-a to host-b

I give a try to the exmpls, using for 2 test nodes my home Desktop PC, Linux running  arcane version of Ubuntu and my Debian Linux notebook.

First on the Ubuntu PC I issued
 

hipo@hip0-desktop:~$ cat /dev/zero | nc -l -p 12345
 

Note that I have previously had installed the netcat, as nc is not installed by default on Ubuntu and Debian. If you, don't have nc installed yet, install it with:

apt-get –yes install netcat

"cat /dev/zero | nc -l -p 12345" will not produce any output, but will display just a blank line.

Then on my notebook I ran the second command example, given in the speedometer manual:
 

hipo@noah:~$ nc 192.168.0.2 12345 > /dev/null

Here the 192.168.0.2 is actually the local network IP address of my Desktop PC. My Desktop PC is connected via a normal 100Mbit switch to my routing machine and receives its internet via  NAT. The second test machine (my laptop), gets its internet through a WI-FI connection received by a Wireless Router connected via a UTP cable to the same switch to which my Desktop PC is connected.

Finally to test / get my network maximum thoroughput I had to use:

hipo@noah:~$ speedometer -rx wlan0

Here, I  monitor my wlan0 interface, as this is my (laptop) wireless card interface over which I have connectivity to my local network and via which through the the WI-FI router I get connected to the internet.

Below is a snapshot captured showing approximately what is the max network thoroughput from:

Desktop PC -> to my Thinkpad R61 laptop
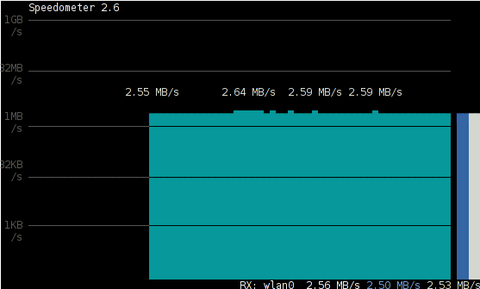
Using Speedometer to test network thorougput between two network server hosts screenshot Debian Squeeze Linux

As you can see in the shot approximately the maximum network thoroughput is in between:
2.55MB/s min and 2.59MB/S max, the speed is quite low for a 100 MBit local network, but this is normal as most laptop wireless adapters hardly transfer traffic in more than 10 to 20 MBits per sec.

If the same nework thoroughput test is conducted between two machines both connected to a same 100 M/bit switch, the traffic should be at least a 8 MB/sec.

There is something, else to take in consideration that probably makes the provided example network thoroughput measuring a bit inaccurate. The fact that the /dev/zero content is stremed over is slowing down the zeroes sent over network because of the  pipe ( | ) use slows down the stream.

5. Using speedometer to visualize maximum writting speed to a local hard drive on Linux

In the speedometer manual, I've noticed another interesting application of this nifty tool.

speedometer can be used to track and visualize the maximum writing speed a hard disk drive or hard drive partition can support on Linux OS:

A copy paster from the manual text is as follows:

How fast can I write data to my filesystem? (with at least 1GB free)
dd bs=1000000 count=1000 if=/dev/zero of=bigfile &
speedometer bigfile

However, when I tried copy/pasting the example in terminal, to test the maximum writing speed to an external USB hard drive, only dd command was started and speedometer failed to initialize and display graphs of the file creation speed.

I've found a little "hack" that makes the man example work by adding a 3 secs sleep like so:

debian:/media/Expansion Drive# dd bs=1000000 count=1000 if=/dev/zero of=bigfile & sleep 3; speedometer bigfile

Here is a screenshot of the bigfile created by dd and tracked "in real time" by speedometer:
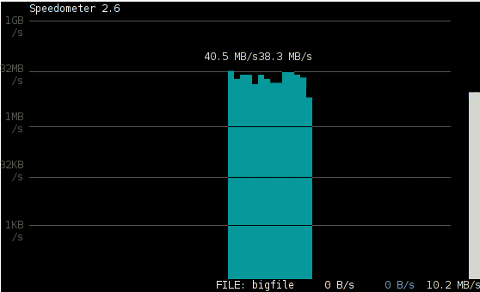
How fast is writting data to local USB expandable hard disk Debian Linux speedometer screenshot

Actually the returned results from this external USB drive are, quite high, the possible reason for that is it is connected to my laptop over an USB protocol verion 3.

6. Using Speedometer to keep an eye on file download in progress

This application of speedometer is mostly useless especially on Linux where it is used as a Desktop.

However in some occasions if files are transferred over ssh or in non interactive FTP / Samba file transfers between Linux servers it can come handy.

To visualize the download and writing speed of lets say FTP transferred .AVI movie (during the actual file transfer) on the download host issue:

# speedometer Download-Folder/What-goes-around-comes-around.avi

7. Estimating approximate time for file transfer

There is another section in the speedometer manual pointing of the program use to calculate the time remaining for a file transfer.

The (man speedometer) provided example text is:

How long it will take for my 38MB transfer to finish?
speedometer favorite_episode.rm $((38*1024*1024))

At first glimpse it hard to understand (like the other manual example). A bit of reasoning and I comprehend what the man author meant by the obscure calculation:

$((38*1024*1024))

This is a formula used in which 38 has to be substituted with the exact file size amount of the transferred file. The author manual used a 38MB file so this is why he put $((38* … in the formula.

I give it a try – (just for the sake to see how it works) with a file with a size of 2500MB, in below two screenshot pictures I show my preparation to copy the file and the actual copying / "real time" transfer tracking with speedometer's status percentage completion bar.
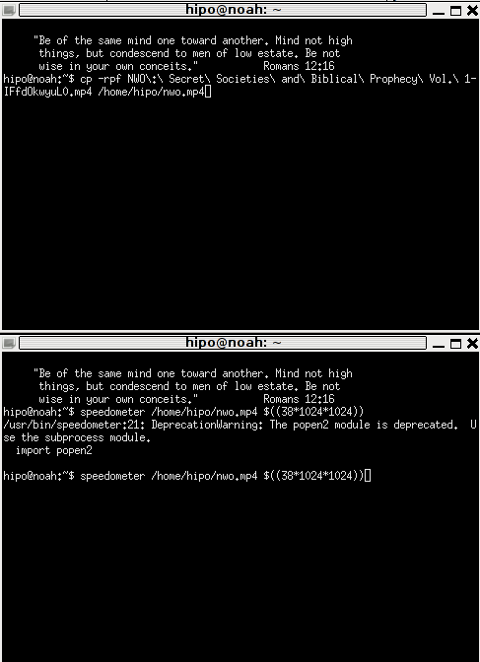
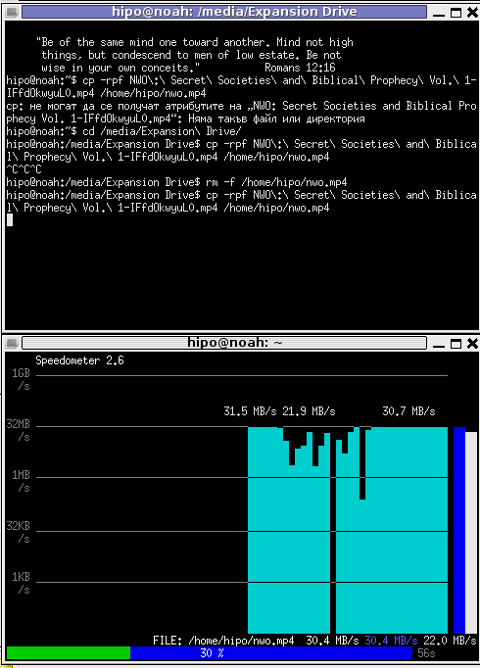
xterm terminal copy file and estimate file copying operation speed on linux with speedometer preparation

Two xterm terminals one is copying a file the other one uses speedometer to estimate the time remaining to complete the file transfer from expansion USB hard drive to my laptop harddrive


How to count how many files are in a directory with find on Linux

Tuesday, February 21st, 2012

how to count how many directories are on your linux server

Did you ever needed to count, how many files in a directory are there?
Having the concrete number of files in a directory is not a seldom task but still very useful especially for scripts or simply for the sake of learning

The quickest and maybe the easiest way to count all files in a directory in Linux is with a combination of find and wc commands:

Here is how;

linux:~# cd ascii
linux:~/ascii# find . -type f -iname '*' -print |wc -l
407

This will find and list all matched files in any directory and subdirectories, print them out and count them with wc command.
The -type f argument instructs find to look only for files.

Other helpful variance of finding and listing all files in a directory and subdirectories is to list and count all the files with a certain file extension under a directory. For example, lets list all text files (.txt) contained in a directory and all level sub-directories:

linux:~/ascii# find . -type f -iname '*.txt' -print |wc -l
401

If you need to check the number of files in a directory for multiple directories on a server and you're aiming at doing it efficienly, issung above find .. | wc code will definitely be not a good choice. If used it will generate heavy load for the system and along with that will complete the execution in ages if issued on a large number of files containing dirs.

Thanksfully if efficiency is targetted, there is a command written in C called tree which is more efficient than find.
To count the number of files in dir but using tree :

linux:~# cd ascii
linux:/ascii# tree | tail -n 1
32 directories, 407 files

By default tree prints info for both the number of found files and directories.
To print out only the files matched, awk comes handy, e.g.:

linux:/ascii# tree |tail -n 1| awk '{ print $3 }'407

To list only the number of files in a directory without its existing sub-directories ls + wc use is also possible:

linux:~/ascii# ls -l | grep ^- | wc -l68

This result the above command would produce is +1 more than the real number of files, as it counts the directory ".." as one file (in UNIX / LINUX everything is file).

A short one liner script that can calculate all files correctly by substracting 1 is and hence present correct result on number of files is like so:

linux:~/ascii# var=$(ls -l | grep ^- | wc -l); var=$(($var - 1)); echo $var

ls can be used to calculate the number of 1-st level sub-directories under certain directory for instance:

linux:~/ascii# ls -l |grep ^d|wc -l
25

You see the ascii directory has 25 subdirectories in its 1st level.

To check symlinks under a directory with ls the command would be:

linux:~/ascii# ls -l | grep ^l | wc -l
0

Note above 3 ls | grep … examples, will not work properly if the directory contains files with SUID or some special properties set.
Hence to get the same 3 results for active files, directories and symbolic links, a one liner similar to the one below can be used instead:

linux:~/ascii# for t in files links directories; do echo `find . -type ${t:0:1} | wc -l` $t; done 2> /dev/null
407 files
0 links
33 directories

This will show statistics about all files, links and directories for all directory sub-levels.
Just in case if there is need to only count files, links and directories without directory recursion enabled, use:

linux:~/ascii# for t in files links directories; do echo `find . -maxdepth 1 -type ${t:0:1} | wc -l` $t; done 2> /dev/null
68 files
0 links
26 directories

Anyways the above bash loop will be slow, for directories containing thousands of files. For better performance the equivallent of above bash loop rewritten in perl would be:

linux:~/ascii# ls -l |perl -e 'while(<>){$h{substr($_,0,1)}+=1;} END {foreach(keys %h) {print "$_ $h{$_}\n";}}'
- 68
d 25
t 1
linux:~/ascii#
In any case the most preferrable and efficient way to count files en directories is by using tree command.
In my view using always tree command instead of code "hacks" is smart idea.

In Slackware tree command is part of the base install, on Debian and CentOS Linux, tree cmd is not part of the base system and requires install via apt / yum e.g.:

debian:~# apt-get --yes install tree
...

[root@centos:~ ]# yum --yes install tree

Happy counting 😉

How to test if imap and pop mail server service is working with Telnet cmd

Monday, August 8th, 2011

test-if-imap-pop3-is-working-with-telnet-command-logo-imap
I’ve recently built new mail qmail server with vpopmail to serve pop3 connectins and courierimap and courierimaps to take care for IMAP IMAPS.

I further used telnet to test if the Linux server pop3 service on (110) and imap on (143) worked fine, straight after the completed qmail install.
Here is how to test mail server with vpopmail listening for connections on pop3 port :

debian:~# telnet mail.mymailserver.com 110
Trying 111.222.333.444...
Connected to mail.mymailserver.com.
Escape character is '^]'.
+OK <2813.1312745988@mymailserver.com>
USER hipo@mymailserver.com
+OK
PASS here_goes_my_secret_pass
+OK
LIST
1 309783
2 64053
3 2119
4 64357
5 317893
RETR 1
My first mail content retrieved with RETR commandgoes here ....
quit
+OK
Connection closed by foreign host.

You see I have 5 messages in my mailbox, as you can see I used RETR command to check the content of my mail, this is handy as I can read my mails straight with telnet (if the mail is in plain text), of course it’s a bit more complicated if I have to read encrypted or html mail, though still its easy to write a tiny parser and pipe the content produced by telnet command to lynx or some other text based browser.

Now another sys admin handy tip is the use of telnet to check my mail servers IMAP servers is correctly operating.
Here is how:

debian:~# telnet mail.mymailserver.com 143
Trying 111.222.333.444...
Connected to localhost.
Escape character is '^]'.
* OK [CAPABILITY IMAP4rev1 UIDPLUS CHILDREN NAMESPACE THREAD=ORDEREDSUBJECT THREAD=REFERENCES SORT QUOTA IDLE ACL ACL2=UNION STARTTLS] Courier-IMAP ready. Copyright 1998-2010 Double Precision, Inc. See COPYING for distribution information.
01 LOGIN hipo@mymailserver.com here_goes_my_secret_pass
A OK LOGIN Ok.
02 LIST "" *
* LIST (Unmarked HasNoChildren) "." "INBOX"
02 OK LIST completed
03 SELECT INBOX
* FLAGS (Draft Answered Flagged Deleted Seen Recent)
* OK [PERMANENTFLAGS (* Draft Answered Flagged Deleted Seen)] Limited
* 5 EXISTS
* 5 RECENT
* OK [UIDVALIDITY 1312746907] Ok
* OK [MYRIGHTS "acdilrsw"] ACL
03 OK [READ-WRITE] Ok
04 STATUS INBOX (MESSAGES)
* STATUS "INBOX" (MESSAGES 5)
04 OK STATUS Completed.
05 FETCH 1 ALL
...
06 FETCH 1 BODY
...
07 FETCH 1 ENVELOPE
...
As you can see according to standard to send commands to IMAP server from console after a telnet connection you will have to always include a command line number like 01, 02, 03 .. etc.

Using such a line numbering is not obligitory and also letters like A, B, C could be use still line numbering with numbers is generally a good idea since it’s easier for reading on the screen.

Now line 02 shows you available mailboxes, line 03 SELECT INBOX selects the imap Inbox to be further operated with, 04 STATUS INBOX cmd displays status about current mailboxes in folder.
FETCH 1 ALL instructs the imap server to get list of all IMAP message headers. Next command in line 05 FETCH 1 BODY will display the message body of the first message in list.
The 07 FETCH 1 ENVELOPE will display the mail headers for the 1 message.

Few other IMAP commands which might be helpfun on connection are:

08 FETCH 1 FULL
09 FETCH * FULL

First one would fetch complete content of a message numbered one from the imap server and the second one 09 FETCH * FULL will get all the mail content for all messages located on the remote IMAP server.

The STATUS command aforementioned earlier could take the following list of arguments:

MESSAGES, UNSEEN, RECENT UIDNEXT UIDVALIDITY

These commands are a gold mine for me as a sysadmin as it helps quickly solve problems, hope they would help to somebody out there as well 😉
This way is a way shorter than bothering each time to check, if some customer e-mail account is improperly configured by creating setting up a new account in Thunderbird.
 

The Driving Polygon – My adventures of learning to drive a car

Wednesday, June 25th, 2008

Today the day was pretty normal for which of course I have to thank to Our Awesome God :)I didn’t have much work, I stand up somewhere around 11 o’clock. I did my usual morning exercises.By the way since I started practising everyday exercise I feel physically better. After that I prayed a bit.Afterwards I red the road regulations and laws book (as I mentioned in my previous bloggings I have starteda driving license courses). Somewhere around 12:30 Gery did called and asked me if I’m willing to go outfor a coffee. I accepted and we saw each other infront of the fountain. Because all the tables outside wasoccupied we and in the coffee itself was too hot we decided to move to the Kukla coffee. We coffeed a bittalked about stuff shared how our lifes are going etc. etc. After that I had to go to the college becauseI need a copy of my school completion diploma because my driver lessons teacher requires as well as therest of the documents my ID card, a picture etcetera, etcetera. In the college I met Todor Dyankov who wasteaching me at Statistics and in Marketing II at the college and Ertan also Nina the librarian, I have tosay all of them are pretty cool :). Ertan showed me what he has made using Adobe’s flex product andexplained how convinient it’s usage is for creation of books and various other web based sort of manuals.Later at home I red more some chapters of the road regulations book. After which in 18:45 I went to the stomatology(this is the usual place where driving teachers park their cars and where we met with my instructor), he askedif it’s possible to change the driving lesson to be in Tuesday for 18:30 to be honest I haven’t had much choice since theteacher had some urgent job to do. Right after that I went to my mother and father grocery shop because previously wehad a stipulation that I my father and a close family friend (Georgi a namesake) would go somewhere out of the city becausethe 32 hours for which it suppoed that I had to be ready for the exam were far from enough for me to become a proficient driver.Eventually we went with my father’s car (Opel Astra) to a place which was before used as a Driving Polygon and is a perfectplace for a novice driver like me. The most hard thing for me in governing the car was starting the car from first speed usingthe clutch pedal simultaneously with the “gas” pedal. With some practice there I can say I got better at starting the car on 1st speedalthough still it’s pretty hard for me to move the car on 1st speed from stopped position when the car is on a small hill.After that we went out of the polygon and I drive on the road of Bogdanovo village. Right after we went back to the city.I went to see Bino because I have promised him to go out for a walk together. We had a nice walk in the city park, I came backhome I went to see my grandma just like I often do lately I stood there for 20 minutes and went home, ate and here I’m now blogging :)END—–

Tracking I/O hard disk server bottlenecks with iostat on GNU / Linux and FreeBSD

Tuesday, March 27th, 2012

Hard disk overhead tracking on Linux and FreeBSD with iostat

I've earlier wrote an article How to find which processes are causing hard disk i/o overhead on Linux there I explained very rawly few tools which can be used to benchmark hard disk read / write operations. My prior article accent was on iotop and dstat and it just mentioned of iostat. Therefore I've wrote this short article in attempt to explain a bit more thoroughfully on how iostat can be used to track problems with excessive server I/O read/writes.

Here is the command man page description;
iostatReport Central Processing Unit (CPU) statistics and input/output statistics for devices, partitions and network filesystems

I will further proceed with few words on how iostat can be installed on various Linux distros, then point at few most common scenarious of use and a short explanation on the meaning of each of the command outputs.

1. Installing iostat on Linux

iostat is a swiss army knife of finding a server hard disk bottlenecks. Though it is a must have tool in the admin outfut, most of Linux distributions will not have iostat installed by default.
To have it on your server, you will need to install sysstat package:

a) On Debian / Ubuntu and other Debian GNU / Linux derivatives to install sysstat:

debian:~# apt-get --yes install sysstat

b) On Fedora, CentOS, RHEL etc. install is with yum:

[root@centos ~]# yum -y install sysstat

c) On Slackware Linux sysstat package which contains iostat is installed by default. 

d) In FreeBSD, there is no need for installation of any external package as iostat is part of the BSD world (bundle commands).
I should mention bsd iostat and Linux's iostat commands are not the same and hence there use to track down hard disk bottlenecks differs a bit, however the general logic of use is very similar as with most tools in BSD and Linux.

2. Checking a server hard disk for i/o disk bottlenecks on G* / Linux

Once having the sysstat installed on G* / Linux systems, the iostat command will be added in /usr/bin/iostat
a) To check what is the hard disk read writes per second (in megabytes) use:

debian:~# /usr/bin/iostat -m
Linux 2.6.32-5-amd64 (debian) 03/27/2012 _x86_64_ (8 CPU)
avg-cpu: %user %nice %system %iowait %steal %idle
15.34 0.36 2.76 2.66 0.00 78.88
Device: tps MB_read/s MB_wrtn/s MB_read MB_wrtn
sda 63.89 0.48 8.20 6730223 115541235
sdb 64.12 0.44 8.23 6244683 116039483
md0 2118.70 0.22 8.19 3041643 115528074

In the above output the server, where I issue the command is using sda and sdb configured in software RAID 1 array visible in the output as (md0)

The output of iostat should already be easily to read, for anyone who didn't used the tool here is a few lines explanation of the columns:

The %user 15.34 meaning is that 15.34 out of 100% possible i/o load is generad by system level read/write operations.
%nice – >Show the percentage of CPU utilization that occurred while executing at the user level with nice priority.
%iowait – just like the top command idle it shows the idle time when the system didn't have an outstanding disk I/O requests.
%steal – show percentage in time spent in time wait of CPU or virtual CPUs to service another virtual processor (high numbers of disk is sure sign for i/o problem).
%idle – almost the same as meaning to %iowait
tps – HDD transactions per second
MB_read/s (column) – shows the actual Disk reads in Mbytes at the time of issuing iostat
MB_wrtn/s – displays the writes p/s at the time of iostat invocation
MB_read – shows the hard disk read operations in megabytes, since the server boot 'till moment of invocation of iostat
MB_wrtn – gives the number of Megabytes written on HDD since the last server boot filesystem mount

The reason why the Read / Write values for sda and sdb are similar in this example output is because my disks are configured in software RAID1 (mirror)

The above iostat output reveals in my specific case the server is experiencing mostly Disk writes (observable in the high MB_wrtn/s 8.19 md0 in the above sample output).

It also reveals, the I/O reads experienced on that server hard disk are mostly generated as a system (user level load) – see (%user 15.34 and md0 2118.70).

For all those not familiar with system also called user / level load, this is all kind of load which is generated by running programs on the server – (any kind of load not generated by the Linux kernel or loaded kernel modules).

b) To periodically keep an eye on HDD i/o operations with iostat, there are two ways:

– Use watch in conjunction with iostat;

[root@centos ~]# watch "/usr/bin/iostat -m"
Every 2.0s: iostat -m Tue Mar 27 11:00:30 2012
Linux 2.6.32-5-amd64 (centos) 03/27/2012 _x86_64_ (8 CPU)
avg-cpu: %user %nice %system %iowait %steal %idle
15.34 0.36 2.76 2.66 0.00 78.88
Device: tps MB_read/s MB_wrtn/s MB_read MB_wrtn
sda 63.89 0.48 8.20 6730255 115574152
sdb 64.12 0.44 8.23 6244718 116072400
md0 2118.94 0.22 8.20 3041710 115560990
Device: tps MB_read/s MB_wrtn/s MB_read MB_wrtn
sda 55.00 0.01 25.75 0 51
sdb 52.50 0.00 24.75 0 49
md0 34661.00 0.01 135.38 0 270

Even though watch use and -d might appear like identical, they're not watch does refresh the screen, executing instruction similar to the clear command which clears screen on every 2 seconds, so the output looks like the top command refresh, while passing the -d 2 will output the iostat command output on every 2 secs in a row so all the data is visualized on the screen. Hence -d 2 in cases, where more thorough debug is necessery is better. However for a quick routine view watch + iostat is great too.

c) Outputting extra information for HDD input/output operations;

root@debian:~# iostat -x
Linux 2.6.32-5-amd64 (debian) 03/27/2012 _x86_64_ (8 CPU)
avg-cpu: %user %nice %system %iowait %steal %idle
15.34 0.36 2.76 2.66 0.00 78.88
Device: rrqm/s wrqm/s r/s w/s rsec/s wsec/s avgrq-sz avgqu-sz await svctm %util
sda 4.22 2047.33 12.01 51.88 977.44 16785.96 278.03 0.28 4.35 3.87 24.72
sdb 3.80 2047.61 11.97 52.15 906.93 16858.32 277.05 0.03 5.25 3.87 24.84
md0 0.00 0.00 20.72 2098.28 441.75 16784.05 8.13 0.00 0.00 0.00 0.00

This command will output extended useful Hard Disk info like;
r/s – number of read requests issued per second
w/s – number of write requests issued per second
rsec/s – numbers of sector reads per second
b>wsec/s – number of sectors wrote per second
etc. etc.

Most of ppl will never need to use this, but it is good to know it exists.

3. Tracking read / write (i/o) hard disk bottlenecks on FreeBSD

BSD's iostat is a bit different in terms of output and arguments.

a) Here is most basic use:

freebsd# /usr/sbin/iostat
tty ad0 cpu
tin tout KB/t tps MB/s us ni sy in id
1 561 45.18 44 1.95 14 0 5 0 82

b) Periodic watch of hdd i/o operations;

freebsd# iostat -c 10
tty ad0 cpu
tin tout KB/t tps MB/s us ni sy in id
1 562 45.19 44 1.95 14 0 5 0 82
0 307 51.96 113 5.73 44 0 24 0 32
0 234 58.12 98 5.56 16 0 7 0 77
0 43 0.00 0 0.00 1 0 0 0 99
0 485 0.00 0 0.00 2 0 0 0 98
0 43 0.00 0 0.00 0 0 1 0 99
0 43 0.00 0 0.00 0 0 0 0 100
...

As you see in the output, there is information like in the columns tty, tin, tout which is a bit hard to comprehend.
Thanksfully the tool has an option to print out only more essential i/o information:

freebsd# iostat -d -c 10
ad0
KB/t tps MB/s
45.19 44 1.95
58.12 97 5.52
54.81 108 5.78
0.00 0 0.00
0.00 0 0.00
0.00 0 0.00
20.48 25 0.50

The output info is quite self-explanatory.

Displaying a number of iostat values for hard disk reads can be also achieved by omitting -c option with:

freebsd# iostat -d 1 10
...

Tracking a specific hard disk partiotion with iostat is done with:

freebsd# iostat -n /dev/ad0s1a
tty cpu
tin tout us ni sy in id
1 577 14 0 5 0 81
c) Getting Hard disk read/write information with gstat

gstat is a FreeBSD tool to print statistics for GEOM disks. Its default behaviour is to refresh the screen in a similar fashion like top command, so its great for people who would like to periodically check all attached system hard disk and storage devices:

freebsd# gstat
dT: 1.002s w: 1.000s
L(q) ops/s r/s kBps ms/r w/s kBps ms/w %busy Name
0 10 0 0 0.0 10 260 2.6 15.6| ad0
0 10 0 0 0.0 10 260 2.6 11.4| ad0s1
0 10 0 0 0.0 10 260 2.8 12.5| ad0s1a
0 0 0 0 0.0 0 0 0.0 20.0| ad0s1b
0 0 0 0 0.0 0 0 0.0 0.0| ad0s1c
0 0 0 0 0.0 0 0 0.0 0.0| ad0s1d
0 0 0 0 0.0 0 0 0.0 0.0| ad0s1e
0 0 0 0 0.0 0 0 0.0 0.0| acd0

It even has colors if your tty supports colors 🙂

Another useful tool in debugging the culprit of excessive hdd I/O operations is procstat command:

Here is a sample procstat run to track (httpd) one of my processes imposing i/o hdd load:

freebsd# procstat -f 50404
PID COMM FD T V FLAGS REF OFFSET PRO NAME
50404 httpd cwd v d -------- - - - /
50404 httpd root v d -------- - - - /
50404 httpd 0 v c r------- 56 0 - -
50404 httpd 1 v c -w------ 56 0 - -
50404 httpd 2 v r -wa----- 56 75581 - /var/log/httpd-error.log
50404 httpd 3 s - rw------ 105 0 TCP ::.80 ::.0
50404 httpd 4 p - rw---n-- 56 0 - -
50404 httpd 5 p - rw------ 56 0 - -
50404 httpd 6 v r -wa----- 56 25161132 - /var/log/httpd-access.log
50404 httpd 7 v r rw------ 56 0 - /tmp/apr8QUOUW
50404 httpd 8 v r -w------ 56 0 - /var/run/accept.lock.49588
50404 httpd 9 v r -w------ 1 0 - /var/run/accept.lock.49588
50404 httpd 10 v r -w------ 1 0 - /tmp/apr8QUOUW
50404 httpd 11 ? - -------- 2 0 - -

Btw fstat is sometimes helpful in identifying the number of open files and trying to estimate which ones are putting the hdd load.
Hope this info helps someone. If you know better ways to track hdd excessive loads on Linux / BSD pls share 'em pls.
 

How to disable ACPI on productive Linux servers to decrease kernel panics and increase CPU fan lifespan

Tuesday, May 15th, 2012

Linux TUX ACPI logo / Tux Hates ACPI logohttps://www.pc-freak.net/images/linux_tux_acpi_logo-tux-hates-acpi.png

Why would anyone disable ACPI support on a server machine??
Well  ACPI support kernel loaded code is just another piece of code constantly being present in the memory,  that makes the probability for a fatal memory mess up leading to  a fatal bug resulting in system crash (kernel panic) more likely.

Many computers ship with buggy or out of specifications ACPI firmware which can cause a severe oddities on a brand new bought piece of comp equipment.

One such oddity related to ACPI motherboard support problems is if you notice your machine randomly powering off or failing to boot with a brand new Linux installed on it.

Another reason to switch off ACPI code will would to be prevent the CPU FAN rotation from being kernel controlled.

If the kernel controls the CPU fan on  high CPU heat up it will instruct the fan to rotate quickly and on low system loads it will bring back the fan to loose speed.
 This frequent switch of FAN from high speed to low speed  increases the probability for a short fan damage due to frequent changes of fan speed. Such a fan damage leads often to  system outage due to fan failure to rotate properly.

Therefore in my view it is better ACPI support is switched off completely on  servers. On some servers ACPI is useful as it can be used to track CPU temperature with embedded motherboard sensors with lm_sensors or any piece of hardwre vendor specific software provided. On many machines, however lm_sensors will not properly recognize the integrated CPU temperature sensors and hence ACPI is mostly useless.

There are 3 ways to disable fully or partially ACPI support.

- One is to disable it straight for BIOS (best way IMHO)
- Disable via GRUB or LILO passing a kernel parameter
- Partial ACPI off-ing - /disabling the software that controls the CPU fan/

1. Disable ACPI in BIOS level

Press DEL, F1, F2, F10 or whatever the enter bios key combination is go through all the different menus (depending on the vios BENDOR) and make sure every occurance of ACPI is set to off / disable whatever it is called.

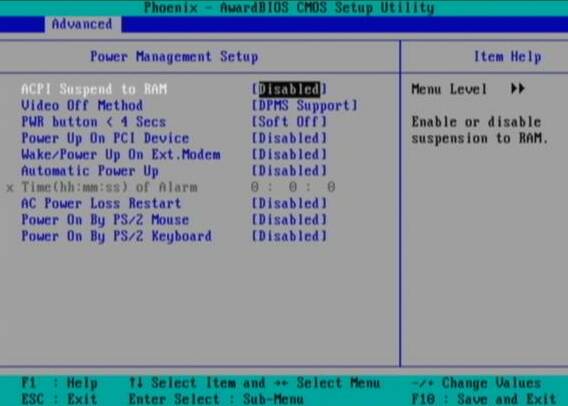
Below is a screenshot of menus with ACPI stuff on a motherboard equipped with Phoenix AwardBIOS:

BIOS ACPI Disable power Off Phoenix BIOS

This is the in my opinon best and safest way to disable ACPI power saving, Unfortunately some newer PCs lack the functionality to disable ACPI; (probably due to the crazy "green" policy the whole world is nowdays mad of).

If that's the case with you, thanksfully there is a "software way" to disable ACPI via passing kernel options via GRUB and LILO boot loaders.

2. Disabling ACPI support on kernel boot level through GRUB boot loader config

There is a tiny difference in command to pass in order to disable  ACPI depending on the Linux installed  GRUB ver. 1.x or GRUB 2.x.

a) In GRUB 0.99 (GRUB version 1)

Edit file /etc/grub/menu.lst or /etc/grub/grub.conf (location differs across Linux distribution). Therein append:

acpi=off

to the end of kernel command line.

Here is an example of a kernel command line with ACPI not disabled (example taken from CentOS server grub.conf):

[root@centos ~]# grep -i title -A 4 /etc/grub/grub.conf
title Red Hat Enterprise Linux Server (2.6.18-36.el5)
root (hd0,0)
kernel /vmlinuz-2.6.18-36.el5 ro root=/dev/VolGroup00/LogVol00 console=ttyS0,115200n8
initrd /initrd-2.6.18-36.el5.img

The edited version of the file with acpi=off included should look like so:

title Red Hat Enterprise Linux Server (2.6.18-36.el5)
root (hd0,0)
kernel /vmlinuz-2.6.18-36.el5 ro root=/dev/VolGroup00/LogVol00 console=ttyS0,115200n8 acpi=off
initrd /initrd-2.6.18-36.el5.img

The kernel option root=/dev/VolGroup00/LogVol00 means the the server is configured to use LVM (Logical Volume Manager).

b) Disabling ACPI on GRUB version 1.99 +

This version is by default installed on newer Ubuntu and Debian Linux-es.

In grub 1.99 on latest Debian Squeeze, the file to edit is located in /boot/grub/grub.cfg. The file is more messy than with its predecessor menu.lst (grub 0.99).
Thanks God there is no need to directly edit the file (though this is possible), but on newer Linuces (as of time of writting the post), there is another simplied grub config file /etc/grub/config

Hence to add the acpi=off to 1.99 open /etc/grub/config find the line reading:

GRUB_CMDLINE_LINUX_DEFAULT="quiet"

and append the "acpi=off" option, e.g. the line has to change to:

GRUB_CMDLINE_LINUX_DEFAULT="quiet acpi=off"

On some servers it might be better to also disable APIC along with ACPI:

Just in case you don't know what is the difference between ACPI and APIC, here is a short explanation:

ACPI = Advanced Configuration and Power Interface

APIC = Advanced Programmable Interrupt Controllers

ACPI is the system that controls your dynamic speed fans, the power button behavior, sleep states, etc.

APIC is the replacement for the old PIC chip that used to come imbedded on motherboards that allowed you to setup interrupts for your soundcard, ide controllers, etc.

Hence on some machines experiencing still problems with even ACPI switched off, it is helpful  to disable the APIC support too, by using:

acpi=off noapic noacpi

Anyways, while doing the changes, be very very cautious or you might end up with un-boot-able server. Don't blame me if this happens :); be sure you have a backup option if server doesn't boot.

To assure faultless kernel boot, GRUB has ability to be configured to automatically load up a second kernel if 1st one fails to boot, if you need that read the grub documentation on that.

To load up the kernel with the new setting, give it a restart:

[root@centos ~]# shutdown -r now
....

3. Disable ACPI support on kernel boot time on Slackware or other Linuxes still booting kernel with LILO

Still, some Linux distros like Slackware, decided to keep the old way and use LILO (LInux LOader) as a default boot loader.

Disabling ACPI support in LILO is done through /etc/lilo.conf

By default in /etc/lilo.conf, there is a line:

append= acpi=on

it should be changed to:

append= acpi=off

Next to load up the new acpi disabled setting, lilo has to be reloaded:

slackware:~# /sbin/lilo -c /etc/lilo.conf
....

Finally a reboot is required:

slackware:~# reboot
....

(If you don't have a physical access or someone near the server you better not 🙂 )

4. Disable ACPI fan control support on a running Linux server without restart

This is the most secure work-around, to disabling the ACPI control over the machine CPU fan, however it has a downside that still the ACPI code will be loaded in the kernel and could cause kernel issues possibly in the long run – lets say the machine has uptime of more than 2 years…

The acpi support on a user level  is controlled by acpid or haldaemon (depending on the Linux distro), hence to disable the fan control on servers this services has to be switched off:

a) disabling ACPI on Debian and deb based Linux-es

As of time of writting on Debian Linux servers acpid (Advanced Configuration and Power Interface event daemon) is there to control how power management will be handled. To disable it stop it as a service (if running):

debian:~# /etc/init.d/acpid stop

To permanently remove acpid from boot up on system boot disable it with update-rc.d:

debian:~# update-rc.d acpid disable 2 3 4 5
update-rc.d: using dependency based boot sequencing
insserv: Script iptables is broken: incomplete LSB comment.
insserv: missing `Required-Start:' entry: please add even if empty.
insserv: warning: current start runlevel(s) (empty) of script `acpid' overwrites defaults (2 3 4 5).
insserv: warning: current stop runlevel(s) (2 3 4 5) of script `acpid' overwrites defaults (empty).
insserv: missing `Required-Start:' entry: please add even if empty.

b) disabling ACPI on RHEL, Fedora and other Redhat-s (also known as RedHacks 🙂 )

I'm not sure if this is safe,as many newer rpm based server system services,  might not work properly with haldaemon disabled.

Anyways you can give it a try if when it is stopped there are issues just bring it up again.

[root@rhel ~]# /etc/init.d/haldaemon stop

If all is fine with the haldaemon switched off (hope so), you can completely disable it to load on start up with:

[root@centos ~]# /sbin/chkconfig --level 2 3 4 5 haldaemon off

Disabling ACPI could increase a bit your server bills, but same time decrease losses from downtimes, so I guess it worths its costs 🙂