Posts Tagged ‘option’

Secure Apache webserver against basic Denial of Service attacks with mod_evasive on Debian Linux

Wednesday, September 7th, 2011

Secure Apache against basic Denial of Service attacks with mod evasive, how webserver DDoS works

One good module that helps in mitigating, very basic Denial of Service attacks against Apache 1.3.x 2.0.x and 2.2.x webserver is mod_evasive

I’ve noticed however many Apache administrators out there does forget to install it on new Apache installations or even some of them haven’t heard about of it.
Therefore I wrote this small article to create some more awareness of the existence of the anti DoS module and hopefully thorugh it help some of my readers to strengthen their server security.

Here is a description on what exactly mod-evasive module does:

debian:~# apt-cache show libapache2-mod-evasive | grep -i description -A 7

Description: evasive module to minimize HTTP DoS or brute force attacks
mod_evasive is an evasive maneuvers module for Apache to provide some
protection in the event of an HTTP DoS or DDoS attack or brute force attack.
.
It is also designed to be a detection tool, and can be easily configured to
talk to ipchains, firewalls, routers, and etcetera.
.
This module only works on Apache 2.x servers

How does mod-evasive anti DoS module works?

Detection is performed by creating an internal dynamic hash table of IP Addresses and URIs, and denying any single IP address which matches the criterias:

  • Requesting the same page more than number of times per second
  • Making more than N (number) of concurrent requests on the same child per second
  • Making requests to Apache during the IP is temporarily blacklisted (in a blocking list – IP blacklist is removed after a time period))

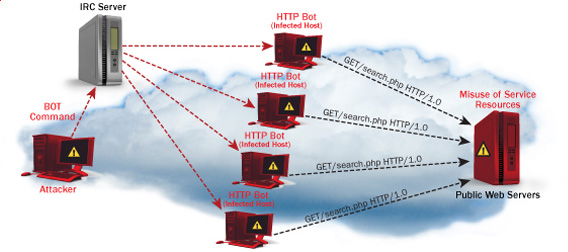
These anti DDoS and DoS attack protection decreases the possibility that Apache gets DoSed by ana amateur DoS attack, however it still opens doors for attacks who has a large bot-nets of zoombie hosts (let’s say 10000) which will simultaneously request a page from the Apache server. The result in a scenario with a infected botnet running a DoS tool in most of the cases will be a quick exhaustion of system resources available (bandwidth, server memory and processor consumption).
Thus mod-evasive just grants a DoS and DDoS security only on a basic, level where someone tries to DoS a webserver with only possessing access to few hosts.
mod-evasive however in many cases mesaure to protect against DoS and does a great job if combined with Apache mod-security module discussed in one of my previous blog posts – Tightening PHP Security on Debian with Apache 2.2 with ModSecurity2
1. Install mod-evasive

Installing mod-evasive on Debian Lenny, Squeeze and even Wheezy is done in identical way straight using apt-get:

deiban:~# apt-get install libapache2-mod-evasive
...

2. Enable mod-evasive in Apache

debian:~# ln -sf /etc/apache2/mods-available/mod-evasive.load /etc/apache2/mods-enabled/mod-evasive.load

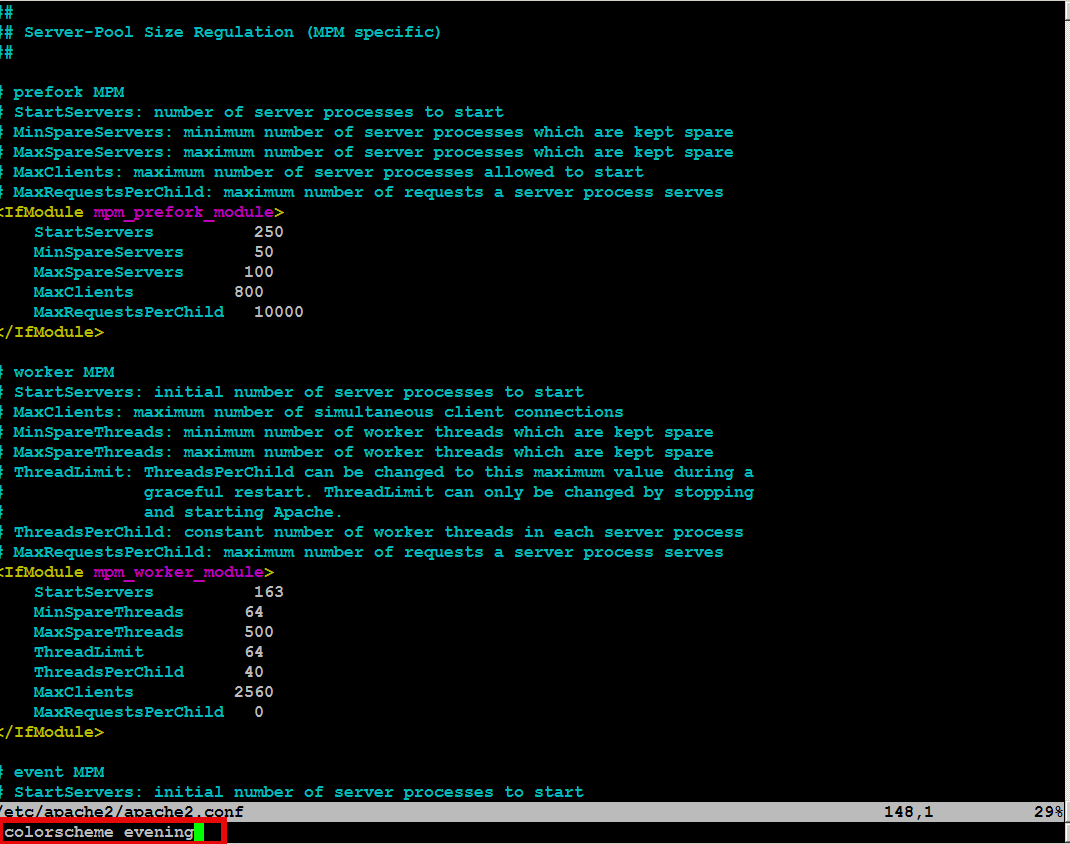
3. Configure the way mod-evasive deals with potential DoS attacks

Open /etc/apache2/apache2.conf, go down to the end of the file and paste inside, below three mod-evasive configuration directives:

<IfModule mod_evasive20.c>
DOSHashTableSize 3097DOS
PageCount 30
DOSSiteCount 40
DOSPageInterval 2
DOSSiteInterval 1
DOSBlockingPeriod 120
#DOSEmailNotify hipo@mymailserver.com
</IfModule>

In case of the above configuration criterias are matched, mod-evasive instructs Apache to return a 403 (Forbidden by default) error page which will conserve bandwidth and system resources in case of DoS attack attempt, especially if the DoS attack targets multiple requests to let’s say a large downloadable file or a PHP,Perl,Python script which does a lot of computation and thus consumes large portion of server CPU time.

The meaning of the above three mod-evasive config vars are as follows:

DOSHashTableSize 3097 – Increasing the DoSHashTableSize will increase performance of mod-evasive but will consume more server memory, on a busy webserver this value however should be increased
DOSPageCount 30 – Add IP in evasive temporary blacklist if a request for any IP that hits the same page 30 consequential times.
DOSSiteCount 40 – Add IP to be be blacklisted if 40 requests are made to a one and the same URL location in 1 second time
DOSBlockingPeriod 120 – Instructs the time in seconds for which an IP will get blacklisted (e.g. will get returned the 403 foribden page), this settings instructs mod-evasive to block every intruder which matches DOSPageCount 30 or DOSSiteCount 40 for 2 minutes time.
DOSPageInterval 2 – Interval of 2 seconds for which DOSPageCount can be reached.
DOSSiteInterval 1 – Interval of 1 second in which if DOSSiteCount of 40 is matched the matched IP will be blacklisted for configured period of time.

mod-evasive also supports IP whitelisting with its option DOSWhitelist , handy in cases if for example, you should allow access to a single webpage from office env consisting of hundred computers behind a NAT.
Another handy configuration option is the module capability to notify, if a DoS is originating from a number of IP addresses using the option DOSEmailNotify
Using the DOSSystemCommand in relation with iptables, could be configured to filter out any IP addresses which are found to be matching the configured mod-evasive rules.
The module also supports custom logging, if you want to keep track on IPs which are found to be trying a DoS attack against the server place in above shown configuration DOSLogDir “/var/log/apache2/evasive” and create the /var/log/apache2/evasive directory, with:
debian:~# mkdir /var/log/apache2/evasive

I decided not to log mod-evasive DoS IP matches as this will just add some extra load on the server, however in debugging some mistakenly blacklisted IPs logging is sure a must.

4. Restart Apache to load up mod-evasive debian:~# /etc/init.d/apache2 restart
...

Finally a very good reading which sheds more light on how exactly mod-evasive works and some extra module configuration options are located in the documentation bundled with the deb package to read it, issue:

debian:~# zless /usr/share/doc/libapache2-mod-evasive/README.gz

Monitoring MySQL server queries and debunning performance (slow query) issues with native MySQL commands and with mtop, mytop

Thursday, May 10th, 2012

If you're a Linux server administrator running MySQL server, you need to troubleshoot performance and bottleneck issues with the SQL database every now and then. In this article, I will pinpoint few methods to debug basic issues with MySQL database servers.

1. Troubleshooting MySQL database queries with native SQL commands

a)One way to debug errors and get general statistics is by logging in with mysql cli and check the mysql server status:

# mysql -u root -p
mysql> SHOW STATUS;
+-----------------------------------+------------+
| Variable_name | Value |
+-----------------------------------+------------+
| Aborted_clients | 1132 |
| Aborted_connects | 58 |
| Binlog_cache_disk_use | 185 |
| Binlog_cache_use | 2542 |
| Bytes_received | 115 |
.....
.....
| Com_xa_start | 0 |
| Compression | OFF |
| Connections | 150000 |
| Created_tmp_disk_tables | 0 |
| Created_tmp_files | 221 |
| Created_tmp_tables | 1 |
| Delayed_errors | 0 |
| Delayed_insert_threads | 0 |
| Delayed_writes | 0 |
| Flush_commands | 1 |
.....
.....
| Handler_write | 132 |
| Innodb_page_size | 16384 |
| Innodb_pages_created | 6204 |
| Innodb_pages_read | 8859 |
| Innodb_pages_written | 21931 |
.....
.....
| Slave_running | OFF |
| Slow_launch_threads | 0 |
| Slow_queries | 0 |
| Sort_merge_passes | 0 |
| Sort_range | 0 |
| Sort_rows | 0 |
| Sort_scan | 0 |
| Table_locks_immediate | 4065218 |
| Table_locks_waited | 196 |
| Tc_log_max_pages_used | 0 |
| Tc_log_page_size | 0 |
| Tc_log_page_waits | 0 |
| Threads_cached | 51 |
| Threads_connected | 1 |
| Threads_created | 52 |
| Threads_running | 1 |
| Uptime | 334856 |
+-----------------------------------+------------+
225 rows in set (0.00 sec)

SHOW STATUS; command gives plenty of useful info, however it is not showing the exact list of queries currently processed by the SQL server. Therefore sometimes it is exactly a stucked (slow queries) execution, you need to debug in order to fix a lagging SQL. One way to track this slow queries is via enabling mysql slow-query.log. Anyways enabling the slow-query requires a MySQL server restart and some critical productive database servers are not so easy to restart and the SQL slow queries have to be tracked "on the fly" so to say.
Therefore, to check the exact (slow) queries processed by the SQL server (without restarting it), do
 

mysql> SHOW processlist;
+——+——+—————+——+———+——+————–+——————————————————————————————————+
| Id | User | Host | db | Command | Time | State | Info |
+——+——+—————+——+———+——+————–+——————————————————————————————————+
| 609 | root | localhost | blog | Sleep | 5 | | NULL |
| 1258 | root | localhost | NULL | Sleep | 85 | | NULL |
| 1308 | root | localhost | NULL | Query | 0 | NULL | show processlist |
| 1310 | blog | pcfreak:64033 | blog | Query | 0 | Sending data | SELECT comment_author, comment_author_url, comment_content, comment_post_ID, comment_ID, comment_aut |
+——+——+—————+——+———+——+————–+——————————————————————————————————+
4 rows in set (0.00 sec)
mysql>

SHOW processlist gives a good view on what is happening inside the SQL.

To get more complete information on SQL query threads use the full extra option:

mysql> SHOW full processlist;

This gives pretty full info on running threads, but unfortunately it is annoying to re-run the command again and again – constantly to press UP Arrow + Enter keys.

Hence it is useful to get the same command output, refresh periodically every few seconds. This is possible by running it through the watch command:

debian:~# watch "'show processlist' | mysql -u root -p'secret_password'"

watch will run SHOW processlist every 2 secs (this is default watch refresh time, for other timing use watch -n 1, watch -n 10 etc. etc.

The produced output will be similar to:

Every 2.0s: echo 'show processlist' | mysql -u root -p'secret_password' Thu May 10 17:24:19 2012

Id User Host db Command Time State Info
609 root localhost blog Sleep 3 NULL1258 root localhost NULL Sleep 649 NULL1542 blog pcfreak:64981 blog Query 0 Copying to tmp table \
SELECT p.ID, p.post_title, p.post_content,p.post_excerpt, p.pos
t_date, p.comment_count, count(t_r.o
1543 root localhost NULL Query 0 NULL show processlist

Though this "hack" is one of the possible ways to get some interactivity on what is happening inside SQL server databases and tables table. for administering hundred or thousand SQL servers running dozens of queries per second – monitor their behaviour few times aday using mytop or mtop is times easier.

Though, the names of the two tools are quite similar and I used to think both tools are one and the same, actually they're not but both are suitable for monitoring sql database execution in real time.

As a sys admin, I've used mytop and mtop, on almost each Linux server with MySQL server installed.
Both tools has helped me many times in debugging oddities with sql servers. Therefore my personal view is mytop and mtop should be along with the Linux sysadmin most useful command tools outfit, still I'm sure many administrators still haven't heard about this nice goodies.

1. Installing mytop on Debian, Ubuntu and other deb based GNU / Linux-es

mytop is available for easy install on Debian and across all debian / ubuntu and deb derivative distributions via apt.

Here is info obtained with apt-cache show

debian:~# apt-cache show mytop|grep -i description -A 3
Description: top like query monitor for MySQL
Mytop is a console-based tool for monitoring queries and the performance
of MySQL. It supports version 3.22.x, 3.23.x, 4.x and 5.x servers.
It's written in Perl and support connections using TCP/IP and UNIX sockets.

Installing the tool is done with the trivial:

debian:~# apt-get --yes install mytop
....

mtop used to be available for apt-get-ting in Debian Lenny and prior Debian releases but in Squeeze onwards, only mytop is included (probably due to some licensing incompitabilities with mtop??).

For those curious on how mtop / mytop works – both are perl scripts written to periodically connects to the SQL server and run commands similar to SHOW FULL PROCESSLIST;. Then, the output is parsed and displayed to the user.

Here how mytop running, looks like:

MyTOP showing queries running on Ubuntu 8.04 Linux - Debugging interactively top like MySQL

2. Installing mytop on RHEL and CentOS

By default in RHEL and CentOS and probably other RedHat based Linux-es, there is neither mtop nor mytop available in package repositories. Hence installing the tools on those is only available from 3rd parties. As of time of writting an rpm builds for RHEL and CentOS, as well as (universal rpm distros) src.rpm package is available on http://pkgs.repoforge.org/mytop/. For the sake of preservation – if in future those RPMs disappear, I made a mirror of mytop rpm's here

Mytop rpm builds depend on a package perl(Term::ReadKey), my attempt to install it on CentOS 5.6, returned following err:

[root@cenots ~]# rpm -ivh mytop-1.4-2.el5.rf.noarch.rpm
warning: mytop-1.4-2.el5.rf.noarch.rpm: Header V3 DSA signature: NOKEY, key ID 6b8d79e6
error: Failed dependencies:
perl(Term::ReadKey) is needed by mytop-1.4-2.el5.rf.noarch

The perl(Term::ReadKey package is not available in CentOS 5.6 and (probably other centos releases default repositories so I had to google perl(Term::ReadKey) I found it on http://rpm.pbone.net/ package repository, the exact url to the rpm dependency as of time of writting this post is:

ftp://ftp.pbone.net/mirror/yum.trixbox.org/centos/5/old/perl-Term-ReadKey-2.30-2.rf.i386.rpm

Quickest, way to install it is:

[root@centos ~]# rpm -ivh ftp://ftp.pbone.net/mirror/yum.trixbox.org/centos/5/old/perl-Term-ReadKey-2.30-2.rf.i386.rpmRetrieving ftp://ftp.pbone.net/mirror/yum.trixbox.org/centos/5/old/perl-Term-ReadKey-2.30-2.rf.i386.rpmPreparing... ########################################### [100%]
1:perl-Term-ReadKey ########################################### [100%]

This time mytop, install went fine:

[root@centos ~]# rpm -ivh mytop-1.4-2.el5.rf.noarch.rpm
warning: mytop-1.4-2.el5.rf.noarch.rpm: Header V3 DSA signature: NOKEY, key ID 6b8d79e6
Preparing... ########################################### [100%]
1:mytop ########################################### [100%]

To use it further, it is the usual syntax:

mytop -u username -p 'secret_password' -d database

CentOS Linux MyTOP MySQL query benchmark screenshot - vpopmail query

3. Installing mytop and mtop on FreeBSD and other BSDs

To debug the running SQL queries in a MySQL server running on FreeBSD, one could use both mytop and mtop – both are installable via ports:

a) To install mtop exec:

freebsd# cd /usr/ports/sysutils/mtop
freebsd# make install clean
....

b) To install mytop exec:

freebsd# cd /usr/ports/databases/mytop
freebsd# make install clean
....

I personally prefer to use mtop on FreeBSD, because once run it runs prompts the user to interactively type in the user/pass

freebsd# mtop

Then mtop prompts the user with "interactive" dialog screen to type in user and pass:

Mtop interactive type in username and password screenshot on FreeBSD 7.2

It is pretty annoying, same mtop like syntax don't show user/pass prompt:

freebsd# mytop
Cannot connect to MySQL server. Please check the:

* database you specified "test" (default is "test")
* username you specified "root" (default is "root")
* password you specified "" (default is "")
* hostname you specified "localhost" (default is "localhost")
* port you specified "3306" (default is 3306)
* socket you specified "" (default is "")
The options my be specified on the command-line or in a ~/.mytop
config file. See the manual (perldoc mytop) for details.
Here's the exact error from DBI. It might help you debug:
Unknown database 'test'

The correct syntax to run mytop instead is:

freebsd# mytop -u root -p 'secret_password' -d 'blog'

Or the longer more descriptive:

freebsd# mytop --user root --pass 'secret_password' --database 'blog'

By the way if you take a look at mytop's manual you will notice a tiny error in documentation, where the three options –user, –pass and –database are wrongly said to be used as -user, -pass, -database:

freebsd# mytop -user root -pass 'secret_password' -database 'blog'
Cannot connect to MySQL server. Please check the:

* database you specified "atabase" (default is "test")
* username you specified "ser" (default is "root")
* password you specified "ass" (default is "")
* hostname you specified "localhost" (default is "localhost")
* port you specified "3306" (default is 3306)
* socket you specified "" (default is "")a
...
Access denied for user 'ser'@'localhost' (using password: YES)

Actually it is interesting mytop, precededed historically mtop.
mtop was later written (probably based on mytop), to run on FreeBSD OS by a famous MySQL (IT) spec — Jeremy Zawodny .
Anyone who has to do frequent MySQL administration tasks, should already heard Zawodny's name.
For those who haven't, Jeremy used to be a head database administrators and developer in Yahoo! Inc. some few years ago.
His website contains plenty of interesting thoughts and writtings on MySQL server and database management
 

Useful VIM editor tip colorscheme evening – make your configurations look brighter in VI

Monday, February 24th, 2014

I just learned about cool VIM option from a collegue:

:colorscheme evening

What it does it makes configurations in vim edit look brighter like you seen in below screenshots.

– Before :colorscheme evening vim command

colorscheme_vim-linux-editor-options-screenshot

– After :colorscheme evening

colorscheme2_vim-linux-editor-options-screenshot

The option is really useful as often editing a config in vim on a random server is too dark and in order to read the config you have to strain your eyes in long term leading to eye damage.

Any other useful vim options, you use daily?

My struggles to find good substitute for old QWERTY Nokia 9300 Communicator and The Death of QWERTY Smart phones

Monday, January 27th, 2014

Nowadays having a a touch screen mobile phone has become like a standard. I'm not such a big fan of Touch screen technology, thus I've been fighting with the idea to own a touch screen phone for a year or so. Just till recently I happily lived with my old Nokia 9300i with a physical QWERTY keyboard for already 4 years.

Unfortunately lately while talking with my Nokia I started getting frequent voice interruptions missing words in my phone call conversations and need to ask person I'm talking to, to repeat his words / sentence in order to understand what is communicated .. I'm economic person and therefore don't like bying anything new if it is not absolutely necessary so I opened the phone and clean it hoping that this will solve the conversation issues but with no luck. With this half-usable mobile my only option left was to buy a new mobile phone.

I'm not very rigorious on what a mobile phone should be and I'm very much minimalist by heart so I was thinking of bying new cheapest available Nokia phone on the market and solve my "issue" quick and efficient,  only problem was  I'm quite used already of using my handy QWERTY phone as a note taking device thus I preferred to not buy a keypad mobile phone but get again a smartphone with physical QWERTY.

I have consulted with some friends who are more knowledgable on what's latest on mobile phone market with a question what will be a good substitute for my Nokia Communicator 9300i and heard comments like:
'IPhone is the most functional and superior in interface', while some friends and colleagues adviced me:
'Choose an Android based phone as Android is Linux based and gives more freedom to the user as well as has more free applications to install'

I appreaciated my friends help but I didn't like the idea to buy a Smartphone with a touchscreen display – virtual keyboard is not so confortable as having a physical one and besides this is a very slow interface compared to physical keys. Thus initially strongly rejected the idea of bying a phone without a physical keyboard. After some weeks of pondering and checking in the market – in 3 Major mobile operators shops in Bulgaria MTel, Globul and VIVACOM and HANDY store. I've find out currently on the market there is no good price / quality and functionality ratio (qwerty keyboard mobile) available. My options were limited to either by a Nokia Asha 210 or some variance or a Blackberry mobile.

nokia_asha_210_mobile_phone

In first glimpse I liked the Nokia ASHA 210 – QWERTY powered mobile  but after noticing the blue Facebook "F" button got quickly jolted.
The sales lady offered me a couple of other Nokias with Qwerty keyboard as well as a Blackberry 9320 Curve.

blackberry_curve_smart_mobile_phone
After a quick test of all QWERTY mobiles, found the intertface on both is so inferior to IPhone's IOS and Android based phones.
I asked my HP workmates for advice of a good QWERTY bundled mobile phone with Android and was referred to Motorolla Droid 3 – which seems to among the only options on the market for mobile Phone which have both Android Operating System and a Physical QWERTY keyboardMotorolla Droid 3 seemed to be exactly the mobile I was looking for but unfortunately it is not available in Mobile phones stores in Bulgaria and only in bulgaria is only offered for sale as a second hand and I had to buy it over the Internet (I prefer not to buy on the Internet). Even if I bought it as second hand  DROID 3's price is too high for my budget – 250 EUR!

Motorola-Droid-3-mobile-nokia-9300i-substitute

I wanted to buy economic phone and same time to have a good balance between price and phone modernity, same time don't tie myself with mobile operator yearly tax plan thus decided to pay my whole mobile price in cache (no credits, no binding 2 / 3 year conversation plans).

After evaluating the options on Market I stopped on two mobiles identical by price 150 EUR I could choose between Samsung Galaxy Trend Lite or ZTE Blade 3. The sales lady adviced me its better to get the ZTE Blade 3 than Samsung Galaxy Trend Lite (S7350) because ZTE has better Camera (5 Mpixels), a better Display and has much less hardware issues than Samsung Galaxy Lite.

Samsung-Galaxy-Trend-Lite-S7390-smart-mobile-phone


Finally I bought the ZTE Blade 3 and nowdays I'm trying to get used to it and to be honest even with a week passed I still can't get used to the Virtual Keyboard

Android interface is quite shiny but a little bit chaotic if compared to design use interface I've tested on IPhones. Android OS seems to behave very weird at times but in general is quite easy to use. Managing / installing / Removing applications from Google AppStore is done by only 2 clicks. My major concern on Android is its highly addictive. I've catch myself, since last week I spend much more time using my mobile than before with my Nokia Communicator …
ZTE-Blade-III-Black-smart-phone

To conclude it I would say living with a smartphone has its advantagous (you can easily check weather prognosis / news) and do a number of things with it, but it is addictive .. obviously its easy to  become an Android addict and spend your free time on useless stuff like installing / testing new apps and playing with phone. Having a smartphone just like I priorly suspected is a big time eater and it seems my hypothesis  that its better to live without a smart phone is true. But who knows, perhaps its just a moment addictiveness just like with any new thing posession – time will show. In meantime I believe my ZTE Blade III – purchase was a good deal as it gives me opportunity to explore Android OS. I'll stop here with my ranting and excuse myself if the article was too boring …Please drop me a comment with mobile types and names who had QWERTY keyboard and a modern OS. Very sadly it seems the QWERTY hardware keyboard mobiles will soon be dead and gone …

Tracking I/O hard disk server bottlenecks with iostat on GNU / Linux and FreeBSD

Tuesday, March 27th, 2012

Hard disk overhead tracking on Linux and FreeBSD with iostat

I've earlier wrote an article How to find which processes are causing hard disk i/o overhead on Linux there I explained very rawly few tools which can be used to benchmark hard disk read / write operations. My prior article accent was on iotop and dstat and it just mentioned of iostat. Therefore I've wrote this short article in attempt to explain a bit more thoroughfully on how iostat can be used to track problems with excessive server I/O read/writes.

Here is the command man page description;
iostatReport Central Processing Unit (CPU) statistics and input/output statistics for devices, partitions and network filesystems

I will further proceed with few words on how iostat can be installed on various Linux distros, then point at few most common scenarious of use and a short explanation on the meaning of each of the command outputs.

1. Installing iostat on Linux

iostat is a swiss army knife of finding a server hard disk bottlenecks. Though it is a must have tool in the admin outfut, most of Linux distributions will not have iostat installed by default.
To have it on your server, you will need to install sysstat package:

a) On Debian / Ubuntu and other Debian GNU / Linux derivatives to install sysstat:

debian:~# apt-get --yes install sysstat

b) On Fedora, CentOS, RHEL etc. install is with yum:

[root@centos ~]# yum -y install sysstat

c) On Slackware Linux sysstat package which contains iostat is installed by default. 

d) In FreeBSD, there is no need for installation of any external package as iostat is part of the BSD world (bundle commands).
I should mention bsd iostat and Linux's iostat commands are not the same and hence there use to track down hard disk bottlenecks differs a bit, however the general logic of use is very similar as with most tools in BSD and Linux.

2. Checking a server hard disk for i/o disk bottlenecks on G* / Linux

Once having the sysstat installed on G* / Linux systems, the iostat command will be added in /usr/bin/iostat
a) To check what is the hard disk read writes per second (in megabytes) use:

debian:~# /usr/bin/iostat -m
Linux 2.6.32-5-amd64 (debian) 03/27/2012 _x86_64_ (8 CPU)
avg-cpu: %user %nice %system %iowait %steal %idle
15.34 0.36 2.76 2.66 0.00 78.88
Device: tps MB_read/s MB_wrtn/s MB_read MB_wrtn
sda 63.89 0.48 8.20 6730223 115541235
sdb 64.12 0.44 8.23 6244683 116039483
md0 2118.70 0.22 8.19 3041643 115528074

In the above output the server, where I issue the command is using sda and sdb configured in software RAID 1 array visible in the output as (md0)

The output of iostat should already be easily to read, for anyone who didn't used the tool here is a few lines explanation of the columns:

The %user 15.34 meaning is that 15.34 out of 100% possible i/o load is generad by system level read/write operations.
%nice – >Show the percentage of CPU utilization that occurred while executing at the user level with nice priority.
%iowait – just like the top command idle it shows the idle time when the system didn't have an outstanding disk I/O requests.
%steal – show percentage in time spent in time wait of CPU or virtual CPUs to service another virtual processor (high numbers of disk is sure sign for i/o problem).
%idle – almost the same as meaning to %iowait
tps – HDD transactions per second
MB_read/s (column) – shows the actual Disk reads in Mbytes at the time of issuing iostat
MB_wrtn/s – displays the writes p/s at the time of iostat invocation
MB_read – shows the hard disk read operations in megabytes, since the server boot 'till moment of invocation of iostat
MB_wrtn – gives the number of Megabytes written on HDD since the last server boot filesystem mount

The reason why the Read / Write values for sda and sdb are similar in this example output is because my disks are configured in software RAID1 (mirror)

The above iostat output reveals in my specific case the server is experiencing mostly Disk writes (observable in the high MB_wrtn/s 8.19 md0 in the above sample output).

It also reveals, the I/O reads experienced on that server hard disk are mostly generated as a system (user level load) – see (%user 15.34 and md0 2118.70).

For all those not familiar with system also called user / level load, this is all kind of load which is generated by running programs on the server – (any kind of load not generated by the Linux kernel or loaded kernel modules).

b) To periodically keep an eye on HDD i/o operations with iostat, there are two ways:

– Use watch in conjunction with iostat;

[root@centos ~]# watch "/usr/bin/iostat -m"
Every 2.0s: iostat -m Tue Mar 27 11:00:30 2012
Linux 2.6.32-5-amd64 (centos) 03/27/2012 _x86_64_ (8 CPU)
avg-cpu: %user %nice %system %iowait %steal %idle
15.34 0.36 2.76 2.66 0.00 78.88
Device: tps MB_read/s MB_wrtn/s MB_read MB_wrtn
sda 63.89 0.48 8.20 6730255 115574152
sdb 64.12 0.44 8.23 6244718 116072400
md0 2118.94 0.22 8.20 3041710 115560990
Device: tps MB_read/s MB_wrtn/s MB_read MB_wrtn
sda 55.00 0.01 25.75 0 51
sdb 52.50 0.00 24.75 0 49
md0 34661.00 0.01 135.38 0 270

Even though watch use and -d might appear like identical, they're not watch does refresh the screen, executing instruction similar to the clear command which clears screen on every 2 seconds, so the output looks like the top command refresh, while passing the -d 2 will output the iostat command output on every 2 secs in a row so all the data is visualized on the screen. Hence -d 2 in cases, where more thorough debug is necessery is better. However for a quick routine view watch + iostat is great too.

c) Outputting extra information for HDD input/output operations;

root@debian:~# iostat -x
Linux 2.6.32-5-amd64 (debian) 03/27/2012 _x86_64_ (8 CPU)
avg-cpu: %user %nice %system %iowait %steal %idle
15.34 0.36 2.76 2.66 0.00 78.88
Device: rrqm/s wrqm/s r/s w/s rsec/s wsec/s avgrq-sz avgqu-sz await svctm %util
sda 4.22 2047.33 12.01 51.88 977.44 16785.96 278.03 0.28 4.35 3.87 24.72
sdb 3.80 2047.61 11.97 52.15 906.93 16858.32 277.05 0.03 5.25 3.87 24.84
md0 0.00 0.00 20.72 2098.28 441.75 16784.05 8.13 0.00 0.00 0.00 0.00

This command will output extended useful Hard Disk info like;
r/s – number of read requests issued per second
w/s – number of write requests issued per second
rsec/s – numbers of sector reads per second
b>wsec/s – number of sectors wrote per second
etc. etc.

Most of ppl will never need to use this, but it is good to know it exists.

3. Tracking read / write (i/o) hard disk bottlenecks on FreeBSD

BSD's iostat is a bit different in terms of output and arguments.

a) Here is most basic use:

freebsd# /usr/sbin/iostat
tty ad0 cpu
tin tout KB/t tps MB/s us ni sy in id
1 561 45.18 44 1.95 14 0 5 0 82

b) Periodic watch of hdd i/o operations;

freebsd# iostat -c 10
tty ad0 cpu
tin tout KB/t tps MB/s us ni sy in id
1 562 45.19 44 1.95 14 0 5 0 82
0 307 51.96 113 5.73 44 0 24 0 32
0 234 58.12 98 5.56 16 0 7 0 77
0 43 0.00 0 0.00 1 0 0 0 99
0 485 0.00 0 0.00 2 0 0 0 98
0 43 0.00 0 0.00 0 0 1 0 99
0 43 0.00 0 0.00 0 0 0 0 100
...

As you see in the output, there is information like in the columns tty, tin, tout which is a bit hard to comprehend.
Thanksfully the tool has an option to print out only more essential i/o information:

freebsd# iostat -d -c 10
ad0
KB/t tps MB/s
45.19 44 1.95
58.12 97 5.52
54.81 108 5.78
0.00 0 0.00
0.00 0 0.00
0.00 0 0.00
20.48 25 0.50

The output info is quite self-explanatory.

Displaying a number of iostat values for hard disk reads can be also achieved by omitting -c option with:

freebsd# iostat -d 1 10
...

Tracking a specific hard disk partiotion with iostat is done with:

freebsd# iostat -n /dev/ad0s1a
tty cpu
tin tout us ni sy in id
1 577 14 0 5 0 81
c) Getting Hard disk read/write information with gstat

gstat is a FreeBSD tool to print statistics for GEOM disks. Its default behaviour is to refresh the screen in a similar fashion like top command, so its great for people who would like to periodically check all attached system hard disk and storage devices:

freebsd# gstat
dT: 1.002s w: 1.000s
L(q) ops/s r/s kBps ms/r w/s kBps ms/w %busy Name
0 10 0 0 0.0 10 260 2.6 15.6| ad0
0 10 0 0 0.0 10 260 2.6 11.4| ad0s1
0 10 0 0 0.0 10 260 2.8 12.5| ad0s1a
0 0 0 0 0.0 0 0 0.0 20.0| ad0s1b
0 0 0 0 0.0 0 0 0.0 0.0| ad0s1c
0 0 0 0 0.0 0 0 0.0 0.0| ad0s1d
0 0 0 0 0.0 0 0 0.0 0.0| ad0s1e
0 0 0 0 0.0 0 0 0.0 0.0| acd0

It even has colors if your tty supports colors 🙂

Another useful tool in debugging the culprit of excessive hdd I/O operations is procstat command:

Here is a sample procstat run to track (httpd) one of my processes imposing i/o hdd load:

freebsd# procstat -f 50404
PID COMM FD T V FLAGS REF OFFSET PRO NAME
50404 httpd cwd v d -------- - - - /
50404 httpd root v d -------- - - - /
50404 httpd 0 v c r------- 56 0 - -
50404 httpd 1 v c -w------ 56 0 - -
50404 httpd 2 v r -wa----- 56 75581 - /var/log/httpd-error.log
50404 httpd 3 s - rw------ 105 0 TCP ::.80 ::.0
50404 httpd 4 p - rw---n-- 56 0 - -
50404 httpd 5 p - rw------ 56 0 - -
50404 httpd 6 v r -wa----- 56 25161132 - /var/log/httpd-access.log
50404 httpd 7 v r rw------ 56 0 - /tmp/apr8QUOUW
50404 httpd 8 v r -w------ 56 0 - /var/run/accept.lock.49588
50404 httpd 9 v r -w------ 1 0 - /var/run/accept.lock.49588
50404 httpd 10 v r -w------ 1 0 - /tmp/apr8QUOUW
50404 httpd 11 ? - -------- 2 0 - -

Btw fstat is sometimes helpful in identifying the number of open files and trying to estimate which ones are putting the hdd load.
Hope this info helps someone. If you know better ways to track hdd excessive loads on Linux / BSD pls share 'em pls.
 

How to configure Exim to relay mail to remote SMTP server on Debian and Ubuntu

Wednesday, August 24th, 2011

I’m required to do some mail relaying on a Debian Linux host which should use a remote mail server to relay its mails.
Until so far I’ve had not much experience with exim as I prefer using qmail, whever a mail server is needed. However since now only a relaying was necessery and exim is the default installed MTA on Debian, I’ve decided to use exim to take care of the SMTP mail relaying.
After a bit of reading it happened configuring exim to relay via remote SMTP server is more than easy!

All I had to do is run the command:

debian-relay:~# dpkg-reconfigure exim4-config

Next in the Ncruses interface to appear:

Debian Exim relay smtp config screenshot

I had to choose the option:

mail sent by smarthost; no local mail

Next a dialog appears asking for:
System mail name:
Therein it’s necessery to type in the hostname of the remote SMTP to be used for mail relay.
Next dialog asks for:
IP-addresses to listen on for incoming SMTP connections:
and I left it with 127.0.0.1 however if exim is supposed to be visible from external network one might decide to put in real IP address there.

Pressing OK leads to the next dialog:
 Other destinations for which mail is accepted: 
I decided to leave this blank as I don’t want to accept mail for any destinations.
Next pane reads:
Visible domain name for local users:
I’ve typed inside my smtp relay server e.g.:
smtp.myrelaymail.com

Further comes:
IP address or host name of the outgoing smarthost:
There once again I typed my mail relay host smtp.relaymail.com

The next config screen is:
Keep number of DNS-queries minimal (Dial-on-Demand)?
On any modern Linux host the default answer of No is fine.
Following prompt asked if I want to:
Split configuration into small files?
I’ve decided not to tamper with it and choosed No
Afterwards mail relaying works like a charm thx God 😉

How to disable ACPI on productive Linux servers to decrease kernel panics and increase CPU fan lifespan

Tuesday, May 15th, 2012

Linux TUX ACPI logo / Tux Hates ACPI logohttps://www.pc-freak.net/images/linux_tux_acpi_logo-tux-hates-acpi.png

Why would anyone disable ACPI support on a server machine??
Well  ACPI support kernel loaded code is just another piece of code constantly being present in the memory,  that makes the probability for a fatal memory mess up leading to  a fatal bug resulting in system crash (kernel panic) more likely.

Many computers ship with buggy or out of specifications ACPI firmware which can cause a severe oddities on a brand new bought piece of comp equipment.

One such oddity related to ACPI motherboard support problems is if you notice your machine randomly powering off or failing to boot with a brand new Linux installed on it.

Another reason to switch off ACPI code will would to be prevent the CPU FAN rotation from being kernel controlled.

If the kernel controls the CPU fan on  high CPU heat up it will instruct the fan to rotate quickly and on low system loads it will bring back the fan to loose speed.
 This frequent switch of FAN from high speed to low speed  increases the probability for a short fan damage due to frequent changes of fan speed. Such a fan damage leads often to  system outage due to fan failure to rotate properly.

Therefore in my view it is better ACPI support is switched off completely on  servers. On some servers ACPI is useful as it can be used to track CPU temperature with embedded motherboard sensors with lm_sensors or any piece of hardwre vendor specific software provided. On many machines, however lm_sensors will not properly recognize the integrated CPU temperature sensors and hence ACPI is mostly useless.

There are 3 ways to disable fully or partially ACPI support.

- One is to disable it straight for BIOS (best way IMHO)
- Disable via GRUB or LILO passing a kernel parameter
- Partial ACPI off-ing - /disabling the software that controls the CPU fan/

1. Disable ACPI in BIOS level

Press DEL, F1, F2, F10 or whatever the enter bios key combination is go through all the different menus (depending on the vios BENDOR) and make sure every occurance of ACPI is set to off / disable whatever it is called.

Below is a screenshot of menus with ACPI stuff on a motherboard equipped with Phoenix AwardBIOS:

BIOS ACPI Disable power Off Phoenix BIOS

This is the in my opinon best and safest way to disable ACPI power saving, Unfortunately some newer PCs lack the functionality to disable ACPI; (probably due to the crazy "green" policy the whole world is nowdays mad of).

If that's the case with you, thanksfully there is a "software way" to disable ACPI via passing kernel options via GRUB and LILO boot loaders.

2. Disabling ACPI support on kernel boot level through GRUB boot loader config

There is a tiny difference in command to pass in order to disable  ACPI depending on the Linux installed  GRUB ver. 1.x or GRUB 2.x.

a) In GRUB 0.99 (GRUB version 1)

Edit file /etc/grub/menu.lst or /etc/grub/grub.conf (location differs across Linux distribution). Therein append:

acpi=off

to the end of kernel command line.

Here is an example of a kernel command line with ACPI not disabled (example taken from CentOS server grub.conf):

[root@centos ~]# grep -i title -A 4 /etc/grub/grub.conf
title Red Hat Enterprise Linux Server (2.6.18-36.el5)
root (hd0,0)
kernel /vmlinuz-2.6.18-36.el5 ro root=/dev/VolGroup00/LogVol00 console=ttyS0,115200n8
initrd /initrd-2.6.18-36.el5.img

The edited version of the file with acpi=off included should look like so:

title Red Hat Enterprise Linux Server (2.6.18-36.el5)
root (hd0,0)
kernel /vmlinuz-2.6.18-36.el5 ro root=/dev/VolGroup00/LogVol00 console=ttyS0,115200n8 acpi=off
initrd /initrd-2.6.18-36.el5.img

The kernel option root=/dev/VolGroup00/LogVol00 means the the server is configured to use LVM (Logical Volume Manager).

b) Disabling ACPI on GRUB version 1.99 +

This version is by default installed on newer Ubuntu and Debian Linux-es.

In grub 1.99 on latest Debian Squeeze, the file to edit is located in /boot/grub/grub.cfg. The file is more messy than with its predecessor menu.lst (grub 0.99).
Thanks God there is no need to directly edit the file (though this is possible), but on newer Linuces (as of time of writting the post), there is another simplied grub config file /etc/grub/config

Hence to add the acpi=off to 1.99 open /etc/grub/config find the line reading:

GRUB_CMDLINE_LINUX_DEFAULT="quiet"

and append the "acpi=off" option, e.g. the line has to change to:

GRUB_CMDLINE_LINUX_DEFAULT="quiet acpi=off"

On some servers it might be better to also disable APIC along with ACPI:

Just in case you don't know what is the difference between ACPI and APIC, here is a short explanation:

ACPI = Advanced Configuration and Power Interface

APIC = Advanced Programmable Interrupt Controllers

ACPI is the system that controls your dynamic speed fans, the power button behavior, sleep states, etc.

APIC is the replacement for the old PIC chip that used to come imbedded on motherboards that allowed you to setup interrupts for your soundcard, ide controllers, etc.

Hence on some machines experiencing still problems with even ACPI switched off, it is helpful  to disable the APIC support too, by using:

acpi=off noapic noacpi

Anyways, while doing the changes, be very very cautious or you might end up with un-boot-able server. Don't blame me if this happens :); be sure you have a backup option if server doesn't boot.

To assure faultless kernel boot, GRUB has ability to be configured to automatically load up a second kernel if 1st one fails to boot, if you need that read the grub documentation on that.

To load up the kernel with the new setting, give it a restart:

[root@centos ~]# shutdown -r now
....

3. Disable ACPI support on kernel boot time on Slackware or other Linuxes still booting kernel with LILO

Still, some Linux distros like Slackware, decided to keep the old way and use LILO (LInux LOader) as a default boot loader.

Disabling ACPI support in LILO is done through /etc/lilo.conf

By default in /etc/lilo.conf, there is a line:

append= acpi=on

it should be changed to:

append= acpi=off

Next to load up the new acpi disabled setting, lilo has to be reloaded:

slackware:~# /sbin/lilo -c /etc/lilo.conf
....

Finally a reboot is required:

slackware:~# reboot
....

(If you don't have a physical access or someone near the server you better not 🙂 )

4. Disable ACPI fan control support on a running Linux server without restart

This is the most secure work-around, to disabling the ACPI control over the machine CPU fan, however it has a downside that still the ACPI code will be loaded in the kernel and could cause kernel issues possibly in the long run – lets say the machine has uptime of more than 2 years…

The acpi support on a user level  is controlled by acpid or haldaemon (depending on the Linux distro), hence to disable the fan control on servers this services has to be switched off:

a) disabling ACPI on Debian and deb based Linux-es

As of time of writting on Debian Linux servers acpid (Advanced Configuration and Power Interface event daemon) is there to control how power management will be handled. To disable it stop it as a service (if running):

debian:~# /etc/init.d/acpid stop

To permanently remove acpid from boot up on system boot disable it with update-rc.d:

debian:~# update-rc.d acpid disable 2 3 4 5
update-rc.d: using dependency based boot sequencing
insserv: Script iptables is broken: incomplete LSB comment.
insserv: missing `Required-Start:' entry: please add even if empty.
insserv: warning: current start runlevel(s) (empty) of script `acpid' overwrites defaults (2 3 4 5).
insserv: warning: current stop runlevel(s) (2 3 4 5) of script `acpid' overwrites defaults (empty).
insserv: missing `Required-Start:' entry: please add even if empty.

b) disabling ACPI on RHEL, Fedora and other Redhat-s (also known as RedHacks 🙂 )

I'm not sure if this is safe,as many newer rpm based server system services,  might not work properly with haldaemon disabled.

Anyways you can give it a try if when it is stopped there are issues just bring it up again.

[root@rhel ~]# /etc/init.d/haldaemon stop

If all is fine with the haldaemon switched off (hope so), you can completely disable it to load on start up with:

[root@centos ~]# /sbin/chkconfig --level 2 3 4 5 haldaemon off

Disabling ACPI could increase a bit your server bills, but same time decrease losses from downtimes, so I guess it worths its costs 🙂


WordPress blog MySQL data maintainance valuable plugin WP-OPTIMIZE

Tuesday, April 12th, 2011

The more my blog is growing the slower it becomes, this is a tendency I’ve noticed since a couple of weeks.

Very fortunately while reading some random articles online I’ve came across a super valuable wordpress plugin called WP-OPTIMIZE

I think it’s best if I present instead of taking the time to explain what the WP-optimize does for a wordpress powered blog:

WP-Optimize is a WordPress 2.9++ database cleanup and optimization tool. It doesn’t require PhpMyAdmin to optimize your database tables. It allows you to remove post revisions, comments in the spam queue, un-approved comments within few clicks.

Additionally you can rename any username to another username too.

For example: If you want to rename default ‘admin’ username to ‘someothername’; just put ‘admin’ (without quotes) to the Old username field and the new username to the New username field, then click “PROCESS”)

Now in short to rephrase above text, during MySQL database requests a lot of database starts needing the so called MySQL optimization , this operation becomes necessery especially for databases which are very actively used and is related to the basic design of the mysql server.

Very often many tables starts having a lot of garbage (repetitive) data and therefore read and writes from the SQL server gets slower and slower day by day.

Thus the MySQL server has it’s famous OPTIMIZE TABLE command which does wipe out all the garbage unnecessery data stored in a tables/s and hence seriously impacts the later read/write table operations.

Now to go back to wordpress the same optimization issues, very often are a cause for a performance bottleneck and some smart guy has came with the great idea to create a specific wordpress plugin to fix such an optimize table issues

The WP-Optimize plugin has 5 major options which somehow could have a positive impact on blog’s performance, these are:
 

  • Remove all Post revisions
  • Remove all auto draft posts
  • Clean marked Spam comments
  • lean Unapproved comments
  • Optimize database tables

Apart from the nice performance boost applicaiton the wp-optimize plugin has one super valuable function, it could change the default wordpress blog administrator user admin to some other desired username, for example rename the default blog administrator username “admin” user to “john”.

From a security perspective this is another must have feature in every wordpress blog as it can kill many of the possible brute force attacks with some web brute force softwares like Hydra

Installing and using wp-optimize is a real piece of cake, here is a very quick few command lines to install it:

host:~# cd /var/www/blog/wp-content/plugins/
host:/var/www/blog/wp-content/plugins:# wget https://www.pc-freak.net/files/wp-optimize.0.9.2.zip
host:/var/www/blog/wp-content/plugins:# unzip wp-optimize.0.9.2.zip
...

To launch WP-OPTIMIZE and fix many speed bottlenecks caused by unoptimized tables, or just hanging around in database old spam comments, go and login with your adminsitrator to wordpress.

In the left pane menu starting up with Dashboard somewhere near the end of the vertical menu you will notice a button reading WP-Optimize .
Click over the Wp-Optimize button and a screen like the one in below’s screenshot will appear in your browser screen:

wp optimize plugin database optimization options screen

I have personally decided to use just 2 of all the 5 available primary plugin options, I decided to select only:
 

  • Clean marked Spam comments
  • Optimize database tables

Scrolling below the PROCEED button I could also notice a number of tables which were missing optimization and hence required an optimize table to be executed on each one of them.
Further on I pressed the PROCESS button and after a couple of minutes (2, 3 minutes) of waiting the wp-optimize plugin was done it’s selected tasks:

In the screenshot below, you see all my blog tables which were optimized by the plugin:
WP-Optimize optimized blog tables screenshot

It’s interesting to say few words about the Remove All Posts revisions plugin option, as many might be wondering what this plugin option really means.

When writting posts, wordpress has an option to restore to a certain point of the write out and makes a sort of different versions in time of each of it’s written posts.

Therefore later restoration if something gots deleted by mistake is facilitated, this is actually the all meaning of Remove All Posts revisions

With time and the increase wp posts the amount of Posts Revisions is growing on and on and just taking space and possibly making the access to the database entries slower, thus it might be a good idea to also remove them as, it’s absolutely rare to use the wp post restoration function.
However I’ve personally decided to not wipe out the old posts revisions as someday i might need it and I’m a bit scared that it might cause me some database issues.

I’ll be glad if somebody has tried the Posts Revisions wp-Optimize funciton and is happy with the results.

How to convert OGG Vorbis .ogg to MP3 on GNU / Linux and FreeBSD

Friday, July 27th, 2012

I’ve used K3B just recently to RIP an Audio CD with music to MP3. K3b has done a great job ripping the tracks, the only problem was By default k3b RIPs songs in OGG Vorbis (.ogg) and not mp3. I personally prefer OGG Vorbis as it is a free freedom respecting audio format, however the problem was the .ogg-s cannot be read on many of the audio players and it could be a problem reading the RIPped oggs on Windows. I’ve done the RIP not for myself but for a Belarusian gfriend of mine and she is completely computer illiterate and if I pass her the songs in .OGG, there is no chance she succed in listening the oggs. I’ve seen later k3b has an option to choose to convert directly to MP3 Using linux mp3 lame library this however is time consuming and I have to wait another 10 minutes or so for the songs to be ripped to shorten the time I decided to directly convert the existing .ogg files to .mp3 on my (Debian Linux). There are probably many ways to convert .ogg to mp3 on linux and likely many GUI frontends (like SoundConverter) to use in graphic env.

SoundConverter Debian GNU Linux graphic GUI environment program for convertion of ogg to mp3 and mp3 to ogg, convert multiple sound formats on GNU / Linux.

I however am a console freak so I preferred doing it from terminal. I’ve done quick research on the net and figured out the good old ffmpeg is capable of converting .oggs to .mp3s. To convert all mp3s just ripped in the separate directory I had to run ffmpeg in a tiny bash loop.

A short bash shell script 1 liner combined with ffmpeg does it, e.g.;

for f in *.ogg; do ffmpeg -i "$f" "`basename "$f" .ogg`.mp3"; done.....

The loop example is in bash so in order to make the code work on FreeBSD it is necessery it is run in a bash shell and not in BSDs so common csh or tcsh.

Well, that’s all oggs are in mp3; Hip-hip Hooray 😉