Posts Tagged ‘package’

How to deb upgrade PHP 5.3.3-7 / MySQL Server 5.1 to PHP 5.4.37 MySQL 5.5 Server on Debian 6.0 / 7.0 Squeeze / Wheezy GNU / Linux

Thursday, February 12th, 2015

how-to-deb-upgrade-mysql-server-5.1-to-mysql-5.5-php-5.3-to-php-5.4-5.5-upgrade-howto-on-old-stable-debian-squeeze-wheezy

I've been still running Debian Squeeze 6.0 GNU / Linux on few of the Linux / Apache / MySQL servers I'm administrating and those servers are running few Wordperss / Joomla websites which lately face severe MySQL performance issues. I tried to optimize using various mysql performance optimization scripts such as mysql-tuner.pl, Tuning-primer.sh and Percona Toolkit – a collection of advanced command-line tools for system administrators and tech / support staff to perform a variety of MySQL and system tasks that are too difficult or complex to perform manually. Though with above tools and some my.cnf tunizations I managed to achieve positive performance improvement results with above optimizations, still I didn't like how MyQSL served queries and since the SQL server is already about 5 years old (running version 5.1) and the PHP on sever is still at 5.3 branch, I was advised by my dear colleague Anatoliy to try version update as a mean to improve SQLserver performance. I took seriously the suggestion to try upgrade as a mean to resolve performance issues in this article I will explain in short what I had to do to make MySQL upgrade a success

Of course to try keep deb installed software versions as fresh as possible possible deb packagse, I'm already using Debian Back Ports (for those who hear it a first time Debian Backports is a special repository for Stable versioned Debian Desktop and Servers  – supporting stable releases of Debian Linux) which allows you to keep install packages versions less outdated (than default installable software which usually are way behind latest stable package versions with 2-5 years).

If you happen to administer Stable Debian servers and you never used BackPorts I warmly recommend it as it often includes security patches of packages part of Debian stable releases that reached End Of Support (EOS) and already too old even for security updates to be issued by respective Debian Long Term Suport (LTS) repositories.

If you're like me and still in situation to manage remotely Debian 6.0 Squeeze and its the first time you hear about BackPorts and Debian LTShttps://wiki.debian.org/LTS/ to start using those two add to your /etc/apt/sources.list below 3 lines

Open with vim editor and press shift+G to go to last line of file and then press I to enter INSERT mode, once you're done to save, press (ESC) then press : and type x! in short key combination for exit and save setting in vim is 
 

Esc + :x! 


debian-server:~# vim /etc/apt/sources.list
deb http://http.debian.net/debian squeeze-lts main contrib non-free
deb-src http://http.debian.net/debian squeeze-lts main contrib non-free
deb http://http.debian.net/debian-backports squeeze-backports main

If you haven't been added a security updates line in /etc/apt/sources.list make sure you add also:


deb http://security.debian.org/ squeeze/updates main contrib non-free
deb-src http://security.debian.org/ squeeze/updates main contrib non-free


Then to apply latest security updates and packages from LTS / Backports repository run the usual:


debian-server:~# apt-get update && apt-get –yes upgrade
….

If you need to search a package or install something from just added backports repository use:


debian-server:~# apt-cache -t squeeze-backports search "mysql-server"
auth2db – Powerful and eye-candy IDS logger, log viewer and alert generator
torrentflux – web based, feature-rich BitTorrent download manager
cacti – Frontend to rrdtool for monitoring systems and services
mysql-server-5.1 – MySQL database server binaries and system database setup
mysql-server-core-5.1 – MySQL database server binaries
mysql-server – MySQL database server (metapackage depending on the latest version)


To install specific packages only with all their dependencies from Backports while keeping rest of packages from Debian Stable:


debian-server:~# apt-get install -t squeeze-backports "package_name"

In same way you can also search or install specific packages from LTS repo:


debian-server:~# apt-get search -t squeeze-lts "package_name"

debian-server:~# apt-get install -t squeeze-lts "package_name"

Latest mysql available from Debian BackPorts and LTS is still quite old 5.1.73-1+deb6u1 therefore I made an extensive research online on how can I easily update MySQL 5.1 to MySQL 5.5 / 5.6 on Debian Stable Linux.
 

Luckily there were already DotDeb deb repositories for Debian LAMP (Linux / Apache  / MySQL / PHP / Nginx ) running servers prepared in order to keep the essential Webserver services up2date even long after distro official support is over. I learned about existence of this repo thanks to a Ryan Tate's post who updates his LAMP stack on TurnKey Linux which by the way is based on slightly modified official stable Debian Linux releases packages

To start using DotDeb repos add in /etc/apt/sources.list (depending whereh you're on Squeeze or Wheeze Debian):


deb http://packages.dotdeb.org squeeze all
deb-src http://packages.dotdeb.org squeeze all

or for Debian Wheezy add repos:


deb http://packages.dotdeb.org wheezy all
deb-src http://packages.dotdeb.org wheezy all


I was updating my DebianLatest MySQL / PHP / Apache release to Latest ones on (6.0.4) Squeeze so added above squeeze repos:

Before refreshing list of package repositories, to authenticate repos issue:


debian-server:~# wget -q http://www.dotdeb.org/dotdeb.gpg
debian-server:~# apt-key add dotdeb.gpg

Once again to update my packages from newly added DodDeb repository


debian-server:~# apt-get update

Before running the SQL upgrade to insure myself, I dumped all databases with:


debian-server:~# mysqldump -u root -p -A > /root/dump.sql

Finally I was brave enough to run apt-get dist-upgrade to update with latest LAMP packages


debian-server:~# apt-get dist-upgrade
Reading package lists… Done
Building dependency tree
Reading state information… Done
Calculating upgrade… Done
The following packages will be REMOVED:
  mysql-client-5.1 mysql-server mysql-server-5.1
The following NEW packages will be installed:
  libaio1 libmysqlclient18 mysql-client-5.5 mysql-client-core-5.5 python-chardet python-debian
The following packages will be upgraded:
  curl krb5-multidev libapache2-mod-php5 libc-bin libc-dev-bin libc6 libc6-dev libc6-i386 libcurl3 libcurl3-gnutls libcurl4-openssl-dev libevent-1.4-2
  libgssapi-krb5-2 libgssrpc4 libjasper1 libk5crypto3 libkadm5clnt-mit7 libkadm5srv-mit7 libkdb5-4 libkrb5-3 libkrb5-dev libkrb53 libkrb5support0 libmysqlclient-dev
  libxml2 libxml2-dev locales mysql-client mysql-common ntp ntpdate php-pear php5 php5-cgi php5-cli php5-common php5-curl php5-dev php5-gd php5-imagick php5-mcrypt
  php5-mysql php5-odbc php5-recode php5-sybase php5-xmlrpc php5-xsl python-reportbug reportbug unzip

50 upgraded, 6 newly installed, 3 to remove and 0 not upgraded.
Need to get 51.7 MB of archives.
After this operation, 1,926 kB of additional disk space will be used.
Do you want to continue [Y/n]? Y

As you see from above output above command updates Apache webservers / PHP and PHP related modules, however it doesn't update MySQL installed version, to update also MySQL server 5.1 to MySQL server 5.5


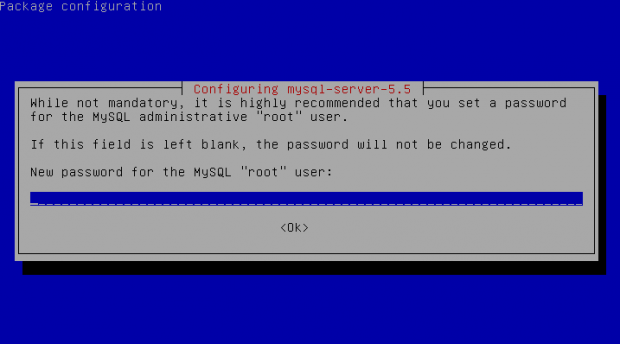
debian-server:~#  apt-get install –yes mysql-server mysql-server-5.5

You will be prompted with the usual Debian ncurses text blue interface to set a root password to mysql server, just set it the same as it used to be on old upgraded MySQL 5.1 server.

Well now see whether mysql has properly restarted with ps auxwwf


debian-server:~#  ps axuwwf|grep -i sql
root     22971  0.0  0.0 112360   884 pts/11   S+   15:50   0:00  |                   \_ grep -i sql
root     19436  0.0  0.0 115464  1556 pts/1    S    12:53   0:00 /bin/sh /usr/bin/mysqld_safe
mysql    19837  4.0  2.3 728192 194552 pts/1   Sl   12:53   7:12  \_ /usr/sbin/mysqld –basedir=/usr –datadir=/var/lib/mysql –plugin-dir=/usr/lib/mysql/plugin –user=mysql –pid-file=/var/run/mysqld/mysqld.pid –socket=/var/run/mysqld/mysqld.sock –port=3306
root     19838  0.0  0.0 110112   700 pts/1    S    12:53   0:00  \_ logger -t mysqld -p daemon.error

In my case it was running, however if it fails to run try to debug what is going wrong on initialization by manually executing init script /etc/init.d/mysql stop; /etc/init.d/mysql start and look for errors. You can also manually try to run mysqld_safe from console if it is not running run:


debian-server:~# /usr/bin/mysqld_safe &

This should give you a good hint on why it is failing to run
 

One more thing left is to check whether php modules load correctly to do so issue:


debian-server:~# php -v
Failed loading /usr/lib/php5/20090626/xcache.so:  /usr/lib/php5/20090626/xcache.so: cannot open shared object file: No such file or directory

Failed loading /usr/lib/php5/20090626/xdebug.so:  /usr/lib/php5/20090626/xdebug.so: cannot open shared object file: No such file or directory


You will likely get an exception (error) like above.
To solve the error, reinstall xcache and xcache-debug debs


debian-server:~# apt-get purge php5-xcache php5-xdebug

Now PHP + MySQL + Apache environment should be running much smootly.

debian-squeeze-wheeze-update-install-mysql-sevver5.55-620x344-howto

Upgrading the MySQL server / PHP library to MySQL server 5.6 / PHP 5.5 on Wheeze Linux is done in very much analogous ways all you have to do is change the repositories with above wheeze 7.0 ones and to follow the process as described in this article. I haven't tested update on Wheezy yet, so if you happen to try my article with wheezy reports and got a positive upgrade result please drop a comment.

luckyBackup Linux GUI back-up and synchronization tool

Wednesday, May 14th, 2014

luckybackup_best-linux-graphical-tool-for-backup_linux_gui-defacto-standard-tool
If you're a using GNU / Linux  for Desktop and you're already tired of creating backups by your own hacks using terminal and you want to make your life a little bit more easier and easily automate your important files back up through GUI program take a look at luckyBackup.

Luckibackup is a GUI frontend to the infamous rsync command line backup  tool. Luckibackup is available as a package in almost all modern Linux distributions its very easy to setup and can save you a lot of time especially if you have to manage a number of your Workplace Desktop Office Linux based computers.
Luckibackup is an absolute must have program for Linux Desktop start-up users. If you're migrating from Microsoft Windows realm and you're used to BackupPC, Luckibackup is probably the defacto Linux BackupPC substitute.

The sad news for Linux GNOME Desktop users is luckibackup is written in QT and it using it will load up a bit your notebook.
It is not installed by default so once a new Linux Desktop is installed you will have to install it manually on Debian and Ubuntu based Linux-es to install Luckibackup apt-get it.

debian:~# apt-get install --yes luckibackup
...

On Fedora and CentOS Linux install LuckiBackup via yum rpm package manager

[root@centos :~]# yum -y install luckibackup
.

Luckibackup is also ported for OpenSuSE Slackware, Gentoo, Mandriva and ArchLinux. In 2009 Luckibackup won the prize of Sourceforge Community Choice Awards for "best new project".

luckyBackup copies over only the changes you've made to the source directory and nothing more.
You will be surprised when your huge source is backed up in seconds (after the first backup).

Whatever changes you make to the source including adding, moving, deleting, modifying files / directories etc, will have the same effect to the destination.
Owner, group, time stamps, links and permissions of files are preserved (unless stated otherwise).

Luckibackup creates different multiple backup "snapshots".Each snapshot is an image of the source data that refers to a specific date-time.
Easy rollback to any of the snapshots is possible. Besides that luckibackup support Sync (just like rsync) od any directories keeping the files that were most recently modified on both of them.

Useful if you modify files on more than one PCs (using a flash-drive and don't want to bother remembering what did you use last. Luckibackup is capable of excluding certain files or directories from backupsExclude any file, folder or pattern from backup transfer.

After each operation a logfile is created in your home folder. You can have a look at it any time you want.

luckyBackup can run in command line if you wish not to use the gui, but you have to first create the profile that is going to be executed.
Type "luckybackup –help" at a terminal to see usage and supported options.
There is also TrayNotification – Visual feedback at the tray area informs you about what is going on.


Monitoring Disk use, CPU Load, Memory use and Network in one console ncurses interface – Glance

Thursday, August 14th, 2014

monitoring-disk-use-memory-cpu-load-and-network-in-one-common-interfaces-with-glances-Linux-BSD-UNIX
If you're Linux / UNIX / BSD system administrator you already have experience with basic admin's system monitoring:

  •     CPU load
  •     OS Name/Kernel version
  •     System load avarage and Uptime
  •     Disk and Network Input/Output I/O operations by interface
  •     Process statistics / Top loading processes etc.
  •     Memory / SWAP usage and free memory
  •     Mounted partitions


Such info is provided by command line tools such as:

top, df, free, sensors, ifconfig, iotop, hddtemp, mount, nfsstat, nfsiostat, dstat, uptime, nethogs iptraf

etc.

There are plenty of others advanced tools also Web based server monitoring visualization  tools, such as Monit, Icanga, PHPSysInfo, Cacti which provide you statistics on computer hardware and network utilization

So far so good, if you already are used to convenience of web *NIX based monitoring but you don't want to put load on the servers with such and you're lazy to write custom scripts that show most important monitoring information – necessery for daily system administration monitoring and prevention from downtimes and tracking bottlenecks you will be glad to hear about Glances
 

Glances is a free (LGPL) cross-platform curses-based monitoring tool which aims to present a maximum of information in a minimum of space, ideally to fit in a classical 80×24 terminal or higher to have additionnal information. Glances can adapt dynamically the displayed information depending on the terminal size. It can also work in a client/server mode for remote monitoring.


1. Installing Glances curses-based monitoring tool on Debian 7 / Ubuntu 13+ / Mint  Linux

We have to install python-pip (python package installer tool) to later install Glances

apt-get install –yes 'python-dev' 'python-jinja2' 'python-psutil'
                        'python-setuptools' 'hddtemp' 'python-pip' 'lm-sensors'


Before proceeding to install Glances to make Thermal sensors working (if supported by hardware) run:


 sensors-detect

Glances is written in Python and uses psutil library to obtain monitoring statistic values, thus it is necessery to install few more Python libraries:

pip install 'batinfo' 'pysensors'

If you're about to use pip – Python package installer tool, behind a proxy server use instead:
 

pip install –proxy=http://your-proxy-host.com:8080 'batinfo' 'pysensors'

Then install Glances script itself again using pip
 

pip install 'Glances'

Downloading/unpacking Glances
  Downloading Glances-2.0.1.tar.gz (3.3Mb): 3.3Mb downloaded
  Running setup.py egg_info for package Glances
    
Downloading/unpacking psutil>=2.0.0 (from Glances)
  Downloading psutil-2.1.1.tar.gz (216Kb): 216Kb downloaded
  Running setup.py egg_info for package psutil

Successfully installed Glances psutil


Then run glances from terminal
 

glances -t 3

-t 3 option tells glances to refresh collected statistics every 3 seconds

glances-console-monitoring-tool-every-systemad-ministrator-should-know-and-use-show-memory-disk-cpu-mount-point-statistics-in-common-shared-screen-linux-freebsd-unix


2. Installing Glances monitoring console tool on CentOS / RHEL / Fedora / Scientific Linux

Installing glances on CentOS 7 / Fedora and rest of RPM based distributions can be done by adding external RPM repositories, cause glances is not available in default yum repositories.

To enable Extra-packages repositories:
 

rpm -ivh http://dl.fedoraproject.org/pub/epel/6/x86_64/epel-release-6-8.noarch.rpm


Then update yum to include new repository's packages into package list and install python-pip and python-devel rpms
 

yum update
yum install python-pip python-devel


Glances-console-server-stateScreenhot-on-CentOS-Linux-monitoring-in-ncurses-Linux-BSD

There is also FreeBSD port to install Glances on FreeBSD:
 

cd /usr/sysutils/py-glances
make install


Enjoy 🙂 !


How to stop / start services in boot time and install / remove / update SuSE SLES (Suse Enterprise Linux Server)?

Friday, February 6th, 2015

Suse-Logo-stop-start-services-on-linux-boot-time-howto-chkconfig
If you're long time Linux sysadmin but you haven't need to adminster SuSE Linux still and your company buys other business / company which already owns some SuSE servers and you need to deal with them, even though you're just starting up with SuSE Linux but you had already plenty of experience with other Linux distributions Fedora / RHEL / CentOS, don't worry set up / stop / start a service (daemon) to boot on Linux boot time is just the same as any other Redhat (RPM) Linux based distributions. it is done by multiple shell scripts located in /etc/init.d directory which can be manually stopped start by issuing the script with an argument e.g
 

suse:/etc/init.d# cd /etc/init.d/
suse:/etc/init.d# ./snmpd 
Usage: ./snmpd {start|stop|try-restart|restart|force-reload|reload|status}


To configure how each of the /etc/init.d/ existent service boots you can the use good old /sbin/chkconfig (a script written in perl) – which you already know from Fedora / CentOS and other RPM distros.

1. Get a list of all enabled on boot SuSE Linux services

To get a list of all set up to run on boot SuSE server services with chkconfig:


suse:/etc/init.d# /sbin/chkfong –list 

Makefile                  0:off  1:off  2:off  3:off  4:off  5:off  6:off
OVCtrl                    0:off  1:off  2:off  3:on   4:on   5:on   6:off
SuSEfirewall2_init        0:off  1:off  2:off  3:off  4:off  5:off  6:off
SuSEfirewall2_setup       0:off  1:off  2:off  3:off  4:off  5:off  6:off
Tivoli_lcfd1              0:off  1:off  2:on   3:on   4:off  5:on   6:off
Tivoli_lcfd1.bkp          0:off  1:off  2:off  3:off  4:off  5:off  6:off
aaeventd                  0:off  1:off  2:off  3:off  4:off  5:off  6:off
acpid                     0:off  1:off  2:on   3:on   4:off  5:on   6:off
alsasound                 0:off  1:off  2:on   3:on   4:off  5:on   6:off
apache2-eis               0:off  1:off  2:off  3:off  4:off  5:off  6:off
atd                       0:off  1:off  2:off  3:off  4:off  5:off  6:off
auditd                    0:off  1:off  2:off  3:on   4:off  5:on   6:off
autofs                    0:off  1:off  2:off  3:off  4:off  5:off  6:off
autoyast                  0:off  1:off  2:off  3:off  4:off  5:off  6:off
boot.apparmor             0:off  1:off  2:on   3:on   4:off  5:on   6:off  B:on
cron                      0:off  1:off  2:on   3:on   4:off  5:on   6:off
dbus                      0:off  1:off  2:off  3:on   4:off  5:on   6:off
earlykbd                  0:off  1:off  2:off  3:off  4:off  5:on   6:off
earlysyslog               0:off  1:off  2:off  3:off  4:off  5:on   6:off
esound                    0:off  1:off  2:off  3:off  4:off  5:off  6:off
evms                      0:off  1:off  2:off  3:off  4:off  5:off  6:off
fbset                     0:off  1:on   2:on   3:on   4:off  5:on   6:off
firstboot                 0:off  1:off  2:off  3:off  4:off  5:off  6:off
fixperms                  0:off  1:off  2:off  3:off  4:off  5:off  6:off
gpm                       0:off  1:off  2:off  3:off  4:off  5:off  6:off
gssd                      0:off  1:off  2:off  3:off  4:off  5:off  6:off
gwproxy                   0:off  1:off  2:on   3:on   4:off  5:on   6:off
haldaemon                 0:off  1:off  2:off  3:on   4:off  5:on   6:off
hp-health                 0:off  1:off  2:on   3:on   4:on   5:on   6:off
hp-ilo                    0:off  1:off  2:off  3:on   4:off  5:on   6:off
hp-snmp-agents            0:off  1:off  2:on   3:on   4:on   5:on   6:off
hpsmhd                    0:off  1:off  2:off  3:on   4:on   5:on   6:off
idmapd                    0:off  1:off  2:off  3:off  4:off  5:off  6:off
ipmi                      0:off  1:off  2:off  3:off  4:off  5:off  6:off
ipmi.hp                   0:off  1:off  2:off  3:off  4:off  5:off  6:off
irq_balancer              0:off  1:on   2:on   3:on   4:off  5:on   6:off
itcaIBMTivoliCommonAgent0  0:off  1:off  2:on   3:on   4:off  5:on   6:off
jboss                     0:off  1:off  2:off  3:off  4:off  5:off  6:off
joystick                  0:off  1:off  2:off  3:off  4:off  5:off  6:off
kadmind                   0:off  1:off  2:off  3:off  4:off  5:off  6:off
kbd                       0:off  1:on   2:on   3:on   4:off  5:on   6:off  S:on
kdump                     0:off  1:off  2:off  3:off  4:off  5:off  6:off
kpropd                    0:off  1:off  2:off  3:off  4:off  5:off  6:off
krb524d                   0:off  1:off  2:off  3:off  4:off  5:off  6:off
krb5kdc                   0:off  1:off  2:off  3:off  4:off  5:off  6:off
ldap                      0:off  1:off  2:off  3:on   4:off  5:on   6:off
lm_sensors                0:off  1:off  2:off  3:off  4:off  5:off  6:off
lw_agt                    0:off  1:off  2:off  3:off  4:off  5:off  6:off
mdadmd                    0:off  1:off  2:off  3:off  4:off  5:off  6:off
microcode                 0:off  1:on   2:on   3:on   4:off  5:on   6:off  S:on
multipathd                0:off  1:off  2:off  3:off  4:off  5:off  6:off
mysql                     0:off  1:off  2:off  3:off  4:off  5:off  6:off
network                   0:off  1:off  2:on   3:on   4:off  5:on   6:off
nfs                       0:off  1:off  2:off  3:on   4:off  5:on   6:off
nfsboot                   0:off  1:off  2:off  3:on   4:off  5:on   6:off
nfsserver                 0:off  1:off  2:off  3:off  4:off  5:off  6:off
nohup.out                 0:off  1:off  2:off  3:off  4:off  5:off  6:off
novell-zmd                0:off  1:off  2:off  3:off  4:off  5:off  6:off
nscd                      0:off  1:off  2:off  3:on   4:off  5:on   6:off
ntp                       0:off  1:off  2:on   3:on   4:off  5:on   6:off
openct                    0:off  1:off  2:off  3:off  4:off  5:off  6:off
opsware-agent             0:off  1:off  2:off  3:on   4:on   5:on   6:off
osddownt                  0:off  1:off  2:off  3:on   4:on   5:on   6:off
ovpa                      0:on   1:off  2:on   3:on   4:off  5:on   6:off
pcscd                     0:off  1:off  2:off  3:off  4:off  5:off  6:off
pctl                      0:off  1:off  2:on   3:on   4:off  5:on   6:off
portmap                   0:off  1:off  2:off  3:on   4:off  5:on   6:off
postfix                   0:off  1:off  2:off  3:on   4:off  5:on   6:off
powerd                    0:off  1:off  2:off  3:off  4:off  5:off  6:off
powersaved                0:off  1:off  2:off  3:off  4:off  5:off  6:off
random                    0:off  1:off  2:on   3:on   4:off  5:on   6:off
raw                       0:off  1:off  2:off  3:off  4:off  5:off  6:off
resmgr                    0:off  1:off  2:on   3:on   4:off  5:on   6:off
rpasswdd                  0:off  1:off  2:off  3:off  4:off  5:off  6:off
rpmconfigcheck            0:off  1:off  2:off  3:off  4:off  5:off  6:off
rrdtools                  0:off  1:off  2:off  3:on   4:off  5:on   6:off
rsyncd                    0:off  1:off  2:off  3:off  4:off  5:off  6:off
saslauthd                 0:off  1:off  2:off  3:off  4:off  5:off  6:off
skeleton.compat           0:off  1:off  2:off  3:off  4:off  5:off  6:off
slurpd                    0:off  1:off  2:off  3:off  4:off  5:off  6:off
smartd                    0:off  1:off  2:off  3:off  4:off  5:off  6:off
smpppd                    0:off  1:off  2:off  3:off  4:off  5:off  6:off
snmpd                     0:off  1:off  2:on   3:on   4:off  5:on   6:off
splash                    0:off  1:on   2:on   3:on   4:off  5:on   6:off  S:on
splash_early              0:off  1:off  2:on   3:on   4:off  5:on   6:off
sshd                      0:off  1:off  2:off  3:on   4:off  5:on   6:off
suseRegister              0:off  1:off  2:off  3:off  4:off  5:off  6:off
svcgssd                   0:off  1:off  2:off  3:off  4:off  5:off  6:off
syslog                    0:off  1:off  2:on   3:on   4:off  5:on   6:off
sysstat                   0:off  1:off  2:off  3:off  4:off  5:off  6:off
tecad_logfile             0:off  1:off  2:off  3:on   4:off  5:on   6:off
tomcat55                  0:off  1:off  2:off  3:off  4:off  5:off  6:off
tomcat_eis                0:off  1:off  2:off  3:off  4:off  5:off  6:off
tpmgwproxy.sh             0:off  1:off  2:on   3:on   4:off  5:on   6:off
uc4_smgrp                 0:off  1:off  2:off  3:on   4:off  5:on   6:off
uc4_smgrq1                0:off  1:off  2:off  3:on   4:off  5:on   6:off
xbis-ldap-tool            0:off  1:off  2:off  3:off  4:off  5:off  6:off
xdm                       0:off  1:off  2:off  3:off  4:off  5:on   6:off
xfs                       0:off  1:off  2:off  3:off  4:off  5:off  6:off
xinetd                    0:off  1:off  2:off  3:off  4:off  5:off  6:off
ypbind                    0:off  1:off  2:off  3:off  4:off  5:off  6:off
xinetd based services:
        chargen:            off
        chargen-udp:        off
        daytime:            off
        daytime-udp:        off
        echo:               off
        echo-udp:           off
        netstat:            off
        rsync:              off
        servers:            off
        services:           off
        systat:             off
        time:               off
        time-udp:           off


2. Stop / Disable a service in all Linux boot runlevels or in a concrete one

As you should know already in Linux there are multiple runlevels in which server can boot, under normal circumstances SuSE servers (as of time of writting) this article boots into runlevel 3, if you'r'e  unsure about the runlevel you can check it with runlevel command:
 

 suse:/etc/init.d# /sbin/runlevel
N 3

To stop a service on all possible boot runlevels – 1,2,3,4,5
 

suse:/etc/init.d# /sbin/chkconfig xinetd off


If you want to stop xinetd or any other service just for certain runlevels (lets say run-level 3,4,5):
 

suse:/etc/init.d# chkconfig –level 345 xinetd off


3. Start / Enable a service for a runlevel or all boot levels 1,2,3,4,5

To disable boot.apparmor on all boot runlevels –  kernel enhancement that enabled to set a limited set of resources for services (good for tightened security, but often creating issues with some external server configured services).
 

suse:/etc/init.d# chkconfig boot.apparmor off


Or for single boot modes again with –level option:
 

suse:/etc/init.d# chkconfig –level 345 boot.apparmor off


suse:/etc/init.d# chkconfig xfs off 


4. SuSE Linux Package management zypper console tool

If you need / wonder how to install /remove / update a service on a SuSE Linux server, take a look at zypper tool.
zypper is  a  command-line  interface to ZYPP system management library.

To install a package / service with zypper the syntax is very much like yum, for example:
 

suse: ~# zypper install vim -emacs


will remove emacs editor and install Vi Improved

The equivalent of yum -y  Fedora command in SuSE Enterprise Linux is –non-interactive option


suse:~# zypper –non-interactive install


In SuSE it is pretty annoying when you're asked for accepting licensing on some proprietary (external vendor) non-free software packages to get around this:
 

suse:~# zypper patch –auto-agree-with-licenses


To keep the SuSE server up2date – i.e. SLES equivalent of CentOS's yum update && yum upgrade


suse:~# zypper list-patches
Loading repository data…
Reading installed packages…
 
Repository                          | Name      | Version | Category | Status
————————————+———–+———+———-+——-
Updates for openSUSE 11.3 11.3-1.82 | lxsession | 2776    | security | needed


suse:~# zypper patch-check
Loading repository data…
Reading installed packages…
5 patches needed (1 security patch)


To look for a certain package with Zypper (equivalent of yum search packagename)

suse: ~# zypper search apache


To verify whether an RPM installed package dependecies are OK:
 

suse:~# zypper verify


The equivalent of Fedora yum update command in SuSE (SLES) are:

suse:~# zypper refresh


To force a complete refresh and rebuild of the database, including a forced download of raw metadata.
 

suse:~# zypper refresh -fdb


For people that are used to ncurses (midnight commander) like text interface you can also use yoast2 (text GUI) package manager:
 

suse:~# yoast2


update-linux-suse-server-with-yoast2-ncurses-package-text-gui-management-tool

If a package is messed you can always go back and use good old RPM (Redhat Package Manager) to solve it.


Text Monitoring of connection server (traffic RX / TX) business in ASCII graphs with speedometer / Easy Monitor network traffic performance

Friday, May 4th, 2012

While reading some posts online related to MS-Windows TcpViewnetwork traffic analyzing tool. I've came across very nice tool for tracking connection speed for Linux (Speedometer). If I have to compare it, speedometer is somehow similar to nethogs and iftop bandwidth network measuring utilities .

What differentiates speedometer from iftop / nethogs / iptraf is it is more suitable for visualizing a network file or data transfers.
The graphs speedometer draws are way easier to understand, than iftop graphs.

Even complete newbies can understand it with no need for extraordinary knowledge in networking. This makes Speedometer, a top tool to visually see the amount of traffic flowing through server network interface (eth0) … (eth1) etc.

What speedometer shows is similar to the Midnight Commander's (mc) file transfer status bar, except the statistics are not only for a certain file transfer but can show overall statistics over server passing network traffic amount (though according to its manual it can be used to also track individual file transfers).

The simplicity for basic use makes speedometer nice tool to track for network congestion issues on Linux. Therefore it is a  must have outfit for every server admin. Below you see a screenshot of my terminal running speedometer on a remote server.

Speedometer ascii traffic track server network business screenshot in byobu screen like virtual terminal emulator

1. Installing speedometer on Debian / Ubuntu and Debian derivatives

For Debian and Ubuntu server administrators speedometer is already packaged as a deb so its installation is as simple as:

debian:~# apt-get --yes install speedometer
....

2. Installing speedometer from source for other Linux distributions CentOS, Fedora, SuSE etc.

Speedometer is written in python programming language, so in order to install and use on other OS Linux platforms, it is necessery to have installed (preferably) an up2date python programming language interpreter (python ver. 2.6 or higher)..
Besides that it is necessary to have installed the urwid -( console user interface library for Python) available for download via excess.org/urwid/


Hence to install speedometer on RedHat based Linux distributions one has to follow these steps:

a) Download & Install python urwid library

[root@centos ~]# cd /usr/local/src
[root@centos src]# wget -q http://excess.org/urwid/urwid-1.0.1.tar.gz
[root@centos src]# tar -zxvvf urwid-1.0.1.tar.gz
....
[root@centos src]# cd urwid-1.0.1
[root@centos urwid-1.0.1]# python setup.py install
running install
running build
running build_py
creating build
creating build/lib.linux-i686-2.4
creating build/lib.linux-i686-2.4/urwid
copying urwid/tests.py -> build/lib.linux-i686-2.4/urwid
copying urwid/command_map.py -> build/lib.linux-i686-2.4/urwid
copying urwid/graphics.py -> build/lib.linux-i686-2.4/urwid
copying urwid/vterm_test.py -> build/lib.linux-i686-2.4/urwid
copying urwid/curses_display.py -> build/lib.linux-i686-2.4/urwid
copying urwid/display_common.py -> build/lib.linux-i686-2.4/urwid
....

b) Download and install python-setuptools

python-setuptools is one other requirement of speedometer, happily on CentOS and Fedora the rpm package is already there and installable with yum:

[root@centos ~]# yum -y install python-setuptools
....

c) Download and install Speedometer

[root@centos urwid-1.0.1]# cd /usr/local/src/
[root@centos src]# wget -q http://excess.org/speedometer/speedometer-2.8.tar.gz
[root@centos src]# tar -zxvvf speedometer-2.8.tar.gz
.....
[root@centos src]# cd speedometer-2.8
[root@centos speedometer-2.8]# python setup.py install
Traceback (most recent call last):
File "setup.py", line 26, in ?
import speedometer
File "/usr/local/src/speedometer-2.8/speedometer.py", line 112
n = n * granularity + (granularity if r else 0)
^

While running the CentOS 5.6 installation of speedometer-2.8, I hit the
"n = n * granularity + (granularity if r else 0)
error.

After consultation with some people in #python (irc.freenode.net), I've figured out this error is caused due the outdated version of python interpreter installed by default on CentOS Linux 5.6. On CentOS 5.6 the python version is:

[root@centos ~]# python -V
Python 2.4.3

As I priorly said speedometer 2.8's minimum requirement for a python to be at v. 2.6. Happily there is quick way to update python 2.4 to python 2.6 on CentOS 5.6, as there is an RPM repository maintained by Chris Lea which contains RPM binary of python 2.6.

To update python 2.4 to python 2.6:

[root@centos speedometer-2.8]# rpm -Uvh http://yum.chrislea.com/centos/5/i386/chl-release-5-3.noarch.rpm[root@centos speedometer-2.8]# rpm --import /etc/pki/rpm-gpg/RPM-GPG-KEY-CHL[root@centos speedometer-2.8]# yum install python26

Now the newly installed python 2.6 is executable under the binary name python26, hence to install speedometer:

[root@centos speedometer-2.8]# python26 setup.py install
[root@centos speedometer-2.8]# chown root:root /usr/local/bin/speedometer
[root@centos speedometer-2.8]# chmod +x /usr/local/bin/speedometer

[root@centos speedometer-2.8]# python26 speedometer -i 1 -tx eth0

The -i will instruct speedometer to refresh the screen graphs once a second.

3. Using speedometer to keep an eye on send / received traffic network congestion

To observe, the amount of only sent traffic via a network interface eth0 with speedometer use:

debian:~# speedometer -tx eth0

To only keep an eye on received traffic through eth0 use:

debian:~# speedometer -rx eth0

To watch over both TX and RX (Transmitted and Received) network traffic:

debian:~# speedometer -tx eth0 -rx eth0

If you want to watch in separate windows TX and RX traffic while  running speedometer you can run in separate xterm windows speedometer -tx eth0 and speedometer -rx eth0, like in below screenshot:

Monitor Received and Transmitted server Network traffic in two separate xterm windows with speedometer ascii graphs

4. Using speedometer to test network maximum possible transfer speed between server (host A) and server (host B)

The speedometer manual suggests few examples one of which is:

How fast is this LAN?

host-a$ cat /dev/zero | nc -l -p 12345
host-b$ nc host-a 12345 > /dev/null
host-b$ speedometer -rx eth0

When I red this example in speedometer's manual, it wasn't completely clear to me what the author really meant, but a bit after when I thought over the example I got his point.

The idea behind this example is that a constant stream of zeros taken from /dev/zero will be streamed over via a pipe (|) to nc which will bind a port number 12345, anyone connecting from another host machine, lets say a server with host host-b to port 12345 on machine host-a will start receiving the /dev/zero streamed content.

Then to finally measure the streamed traffic between host-a and host-b machines a speedometer is started to visualize the received traffic on network interface eth0, thus measuring the amount of traffic flowing from host-a to host-b

I give a try to the exmpls, using for 2 test nodes my home Desktop PC, Linux running  arcane version of Ubuntu and my Debian Linux notebook.

First on the Ubuntu PC I issued
 

hipo@hip0-desktop:~$ cat /dev/zero | nc -l -p 12345
 

Note that I have previously had installed the netcat, as nc is not installed by default on Ubuntu and Debian. If you, don't have nc installed yet, install it with:

apt-get –yes install netcat

"cat /dev/zero | nc -l -p 12345" will not produce any output, but will display just a blank line.

Then on my notebook I ran the second command example, given in the speedometer manual:
 

hipo@noah:~$ nc 192.168.0.2 12345 > /dev/null

Here the 192.168.0.2 is actually the local network IP address of my Desktop PC. My Desktop PC is connected via a normal 100Mbit switch to my routing machine and receives its internet via  NAT. The second test machine (my laptop), gets its internet through a WI-FI connection received by a Wireless Router connected via a UTP cable to the same switch to which my Desktop PC is connected.

Finally to test / get my network maximum thoroughput I had to use:

hipo@noah:~$ speedometer -rx wlan0

Here, I  monitor my wlan0 interface, as this is my (laptop) wireless card interface over which I have connectivity to my local network and via which through the the WI-FI router I get connected to the internet.

Below is a snapshot captured showing approximately what is the max network thoroughput from:

Desktop PC -> to my Thinkpad R61 laptop

Using Speedometer to test network thorougput between two network server hosts screenshot Debian Squeeze Linux

As you can see in the shot approximately the maximum network thoroughput is in between:
2.55MB/s min and 2.59MB/S max, the speed is quite low for a 100 MBit local network, but this is normal as most laptop wireless adapters hardly transfer traffic in more than 10 to 20 MBits per sec.

If the same nework thoroughput test is conducted between two machines both connected to a same 100 M/bit switch, the traffic should be at least a 8 MB/sec.

There is something, else to take in consideration that probably makes the provided example network thoroughput measuring a bit inaccurate. The fact that the /dev/zero content is stremed over is slowing down the zeroes sent over network because of the  pipe ( | ) use slows down the stream.

5. Using speedometer to visualize maximum writting speed to a local hard drive on Linux

In the speedometer manual, I've noticed another interesting application of this nifty tool.

speedometer can be used to track and visualize the maximum writing speed a hard disk drive or hard drive partition can support on Linux OS:

A copy paster from the manual text is as follows:

How fast can I write data to my filesystem? (with at least 1GB free)
dd bs=1000000 count=1000 if=/dev/zero of=bigfile &
speedometer bigfile

However, when I tried copy/pasting the example in terminal, to test the maximum writing speed to an external USB hard drive, only dd command was started and speedometer failed to initialize and display graphs of the file creation speed.

I've found a little "hack" that makes the man example work by adding a 3 secs sleep like so:

debian:/media/Expansion Drive# dd bs=1000000 count=1000 if=/dev/zero of=bigfile & sleep 3; speedometer bigfile

Here is a screenshot of the bigfile created by dd and tracked "in real time" by speedometer:

How fast is writting data to local USB expandable hard disk Debian Linux speedometer screenshot

Actually the returned results from this external USB drive are, quite high, the possible reason for that is it is connected to my laptop over an USB protocol verion 3.

6. Using Speedometer to keep an eye on file download in progress

This application of speedometer is mostly useless especially on Linux where it is used as a Desktop.

However in some occasions if files are transferred over ssh or in non interactive FTP / Samba file transfers between Linux servers it can come handy.

To visualize the download and writing speed of lets say FTP transferred .AVI movie (during the actual file transfer) on the download host issue:

# speedometer Download-Folder/What-goes-around-comes-around.avi

7. Estimating approximate time for file transfer

There is another section in the speedometer manual pointing of the program use to calculate the time remaining for a file transfer.

The (man speedometer) provided example text is:

How long it will take for my 38MB transfer to finish?
speedometer favorite_episode.rm $((38*1024*1024))

At first glimpse it hard to understand (like the other manual example). A bit of reasoning and I comprehend what the man author meant by the obscure calculation:

$((38*1024*1024))

This is a formula used in which 38 has to be substituted with the exact file size amount of the transferred file. The author manual used a 38MB file so this is why he put $((38* … in the formula.

I give it a try – (just for the sake to see how it works) with a file with a size of 2500MB, in below two screenshot pictures I show my preparation to copy the file and the actual copying / "real time" transfer tracking with speedometer's status percentage completion bar.

xterm terminal copy file and estimate file copying operation speed on linux with speedometer preparation

Two xterm terminals one is copying a file the other one uses speedometer to estimate the time remaining to complete the file transfer from expansion USB hard drive to my laptop harddrive


Monitoring MySQL server queries and debunning performance (slow query) issues with native MySQL commands and with mtop, mytop

Thursday, May 10th, 2012

If you're a Linux server administrator running MySQL server, you need to troubleshoot performance and bottleneck issues with the SQL database every now and then. In this article, I will pinpoint few methods to debug basic issues with MySQL database servers.

1. Troubleshooting MySQL database queries with native SQL commands

a)One way to debug errors and get general statistics is by logging in with mysql cli and check the mysql server status:

# mysql -u root -p
mysql> SHOW STATUS;
+-----------------------------------+------------+
| Variable_name | Value |
+-----------------------------------+------------+
| Aborted_clients | 1132 |
| Aborted_connects | 58 |
| Binlog_cache_disk_use | 185 |
| Binlog_cache_use | 2542 |
| Bytes_received | 115 |
.....
.....
| Com_xa_start | 0 |
| Compression | OFF |
| Connections | 150000 |
| Created_tmp_disk_tables | 0 |
| Created_tmp_files | 221 |
| Created_tmp_tables | 1 |
| Delayed_errors | 0 |
| Delayed_insert_threads | 0 |
| Delayed_writes | 0 |
| Flush_commands | 1 |
.....
.....
| Handler_write | 132 |
| Innodb_page_size | 16384 |
| Innodb_pages_created | 6204 |
| Innodb_pages_read | 8859 |
| Innodb_pages_written | 21931 |
.....
.....
| Slave_running | OFF |
| Slow_launch_threads | 0 |
| Slow_queries | 0 |
| Sort_merge_passes | 0 |
| Sort_range | 0 |
| Sort_rows | 0 |
| Sort_scan | 0 |
| Table_locks_immediate | 4065218 |
| Table_locks_waited | 196 |
| Tc_log_max_pages_used | 0 |
| Tc_log_page_size | 0 |
| Tc_log_page_waits | 0 |
| Threads_cached | 51 |
| Threads_connected | 1 |
| Threads_created | 52 |
| Threads_running | 1 |
| Uptime | 334856 |
+-----------------------------------+------------+
225 rows in set (0.00 sec)

SHOW STATUS; command gives plenty of useful info, however it is not showing the exact list of queries currently processed by the SQL server. Therefore sometimes it is exactly a stucked (slow queries) execution, you need to debug in order to fix a lagging SQL. One way to track this slow queries is via enabling mysql slow-query.log. Anyways enabling the slow-query requires a MySQL server restart and some critical productive database servers are not so easy to restart and the SQL slow queries have to be tracked "on the fly" so to say.
Therefore, to check the exact (slow) queries processed by the SQL server (without restarting it), do
 

mysql> SHOW processlist;
+——+——+—————+——+———+——+————–+——————————————————————————————————+
| Id | User | Host | db | Command | Time | State | Info |
+——+——+—————+——+———+——+————–+——————————————————————————————————+
| 609 | root | localhost | blog | Sleep | 5 | | NULL |
| 1258 | root | localhost | NULL | Sleep | 85 | | NULL |
| 1308 | root | localhost | NULL | Query | 0 | NULL | show processlist |
| 1310 | blog | pcfreak:64033 | blog | Query | 0 | Sending data | SELECT comment_author, comment_author_url, comment_content, comment_post_ID, comment_ID, comment_aut |
+——+——+—————+——+———+——+————–+——————————————————————————————————+
4 rows in set (0.00 sec)
mysql>

SHOW processlist gives a good view on what is happening inside the SQL.

To get more complete information on SQL query threads use the full extra option:

mysql> SHOW full processlist;

This gives pretty full info on running threads, but unfortunately it is annoying to re-run the command again and again – constantly to press UP Arrow + Enter keys.

Hence it is useful to get the same command output, refresh periodically every few seconds. This is possible by running it through the watch command:

debian:~# watch "'show processlist' | mysql -u root -p'secret_password'"

watch will run SHOW processlist every 2 secs (this is default watch refresh time, for other timing use watch -n 1, watch -n 10 etc. etc.

The produced output will be similar to:

Every 2.0s: echo 'show processlist' | mysql -u root -p'secret_password' Thu May 10 17:24:19 2012

Id User Host db Command Time State Info
609 root localhost blog Sleep 3 NULL1258 root localhost NULL Sleep 649 NULL1542 blog pcfreak:64981 blog Query 0 Copying to tmp table \
SELECT p.ID, p.post_title, p.post_content,p.post_excerpt, p.pos
t_date, p.comment_count, count(t_r.o
1543 root localhost NULL Query 0 NULL show processlist

Though this "hack" is one of the possible ways to get some interactivity on what is happening inside SQL server databases and tables table. for administering hundred or thousand SQL servers running dozens of queries per second – monitor their behaviour few times aday using mytop or mtop is times easier.

Though, the names of the two tools are quite similar and I used to think both tools are one and the same, actually they're not but both are suitable for monitoring sql database execution in real time.

As a sys admin, I've used mytop and mtop, on almost each Linux server with MySQL server installed.
Both tools has helped me many times in debugging oddities with sql servers. Therefore my personal view is mytop and mtop should be along with the Linux sysadmin most useful command tools outfit, still I'm sure many administrators still haven't heard about this nice goodies.

1. Installing mytop on Debian, Ubuntu and other deb based GNU / Linux-es

mytop is available for easy install on Debian and across all debian / ubuntu and deb derivative distributions via apt.

Here is info obtained with apt-cache show

debian:~# apt-cache show mytop|grep -i description -A 3
Description: top like query monitor for MySQL
Mytop is a console-based tool for monitoring queries and the performance
of MySQL. It supports version 3.22.x, 3.23.x, 4.x and 5.x servers.
It's written in Perl and support connections using TCP/IP and UNIX sockets.

Installing the tool is done with the trivial:

debian:~# apt-get --yes install mytop
....

mtop used to be available for apt-get-ting in Debian Lenny and prior Debian releases but in Squeeze onwards, only mytop is included (probably due to some licensing incompitabilities with mtop??).

For those curious on how mtop / mytop works – both are perl scripts written to periodically connects to the SQL server and run commands similar to SHOW FULL PROCESSLIST;. Then, the output is parsed and displayed to the user.

Here how mytop running, looks like:

MyTOP showing queries running on Ubuntu 8.04 Linux - Debugging interactively top like MySQL

2. Installing mytop on RHEL and CentOS

By default in RHEL and CentOS and probably other RedHat based Linux-es, there is neither mtop nor mytop available in package repositories. Hence installing the tools on those is only available from 3rd parties. As of time of writting an rpm builds for RHEL and CentOS, as well as (universal rpm distros) src.rpm package is available on http://pkgs.repoforge.org/mytop/. For the sake of preservation – if in future those RPMs disappear, I made a mirror of mytop rpm's here

Mytop rpm builds depend on a package perl(Term::ReadKey), my attempt to install it on CentOS 5.6, returned following err:

[root@cenots ~]# rpm -ivh mytop-1.4-2.el5.rf.noarch.rpm
warning: mytop-1.4-2.el5.rf.noarch.rpm: Header V3 DSA signature: NOKEY, key ID 6b8d79e6
error: Failed dependencies:
perl(Term::ReadKey) is needed by mytop-1.4-2.el5.rf.noarch

The perl(Term::ReadKey package is not available in CentOS 5.6 and (probably other centos releases default repositories so I had to google perl(Term::ReadKey) I found it on http://rpm.pbone.net/ package repository, the exact url to the rpm dependency as of time of writting this post is:

ftp://ftp.pbone.net/mirror/yum.trixbox.org/centos/5/old/perl-Term-ReadKey-2.30-2.rf.i386.rpm

Quickest, way to install it is:

[root@centos ~]# rpm -ivh ftp://ftp.pbone.net/mirror/yum.trixbox.org/centos/5/old/perl-Term-ReadKey-2.30-2.rf.i386.rpmRetrieving ftp://ftp.pbone.net/mirror/yum.trixbox.org/centos/5/old/perl-Term-ReadKey-2.30-2.rf.i386.rpmPreparing... ########################################### [100%]
1:perl-Term-ReadKey ########################################### [100%]

This time mytop, install went fine:

[root@centos ~]# rpm -ivh mytop-1.4-2.el5.rf.noarch.rpm
warning: mytop-1.4-2.el5.rf.noarch.rpm: Header V3 DSA signature: NOKEY, key ID 6b8d79e6
Preparing... ########################################### [100%]
1:mytop ########################################### [100%]

To use it further, it is the usual syntax:

mytop -u username -p 'secret_password' -d database

CentOS Linux MyTOP MySQL query benchmark screenshot - vpopmail query

3. Installing mytop and mtop on FreeBSD and other BSDs

To debug the running SQL queries in a MySQL server running on FreeBSD, one could use both mytop and mtop – both are installable via ports:

a) To install mtop exec:

freebsd# cd /usr/ports/sysutils/mtop
freebsd# make install clean
....

b) To install mytop exec:

freebsd# cd /usr/ports/databases/mytop
freebsd# make install clean
....

I personally prefer to use mtop on FreeBSD, because once run it runs prompts the user to interactively type in the user/pass

freebsd# mtop

Then mtop prompts the user with "interactive" dialog screen to type in user and pass:

Mtop interactive type in username and password screenshot on FreeBSD 7.2

It is pretty annoying, same mtop like syntax don't show user/pass prompt:

freebsd# mytop
Cannot connect to MySQL server. Please check the:

* database you specified "test" (default is "test")
* username you specified "root" (default is "root")
* password you specified "" (default is "")
* hostname you specified "localhost" (default is "localhost")
* port you specified "3306" (default is 3306)
* socket you specified "" (default is "")
The options my be specified on the command-line or in a ~/.mytop
config file. See the manual (perldoc mytop) for details.
Here's the exact error from DBI. It might help you debug:
Unknown database 'test'

The correct syntax to run mytop instead is:

freebsd# mytop -u root -p 'secret_password' -d 'blog'

Or the longer more descriptive:

freebsd# mytop --user root --pass 'secret_password' --database 'blog'

By the way if you take a look at mytop's manual you will notice a tiny error in documentation, where the three options –user, –pass and –database are wrongly said to be used as -user, -pass, -database:

freebsd# mytop -user root -pass 'secret_password' -database 'blog'
Cannot connect to MySQL server. Please check the:

* database you specified "atabase" (default is "test")
* username you specified "ser" (default is "root")
* password you specified "ass" (default is "")
* hostname you specified "localhost" (default is "localhost")
* port you specified "3306" (default is 3306)
* socket you specified "" (default is "")a
...
Access denied for user 'ser'@'localhost' (using password: YES)

Actually it is interesting mytop, precededed historically mtop.
mtop was later written (probably based on mytop), to run on FreeBSD OS by a famous MySQL (IT) spec — Jeremy Zawodny .
Anyone who has to do frequent MySQL administration tasks, should already heard Zawodny's name.
For those who haven't, Jeremy used to be a head database administrators and developer in Yahoo! Inc. some few years ago.
His website contains plenty of interesting thoughts and writtings on MySQL server and database management
 

FreeBSD 10.0 RELEASE is out pkg_add FreeBSD default package manager to be substituted with pkg

Thursday, January 23rd, 2014

freebsd 10 is out logo pkg add to be removed - freebsd big news pkg_add to be substituted by another package manager

New latest version of FreeBSD 10.0-RELEASE is out this. FBSD 10  is the latest stable release of 10 branch. The biggest change in FBSD 10 is removal of long time used pkg_add and its substitute with the newer and more advanced pkg. For BSD users who don't know pkg  stiill check out handbook on pkgng

Key highlights of FreeBSD 10 as taken from FreeBSD-10.0-RELEASE announcement;
 

  • GCC is no longer installed by default on architectures where clang(1) is the default compiler.

  • Unbound has been imported to the base system as the local caching DNS resolver.

  • BIND has been removed from the base system.

  • make(1) has been replaced with bmake(1), obtained from the NetBSD Project.

  • pkg(7) is now the default package management utility.

  • pkg_add(1), pkg_delete(1), and related tools have been removed.

  • Major enhancements in virtualization, including the addition of bhyve(8), virtio(4), and native paravirtualized drivers providing support for FreeBSD as a guest operating system on Microsoft Hyper-V.

  • TRIM support for Solid State Drives has been added to ZFS.

  • Support for the high-performance LZ4 compression algorithm has been added to ZFS.

    There is a big news for Raspberry Pi lovers as from FreeBSD 10 there is an official support for Raspberry Pi
    Happy new release. Cheers to testers 🙂

Tracking I/O hard disk server bottlenecks with iostat on GNU / Linux and FreeBSD

Tuesday, March 27th, 2012

Hard disk overhead tracking on Linux and FreeBSD with iostat

I've earlier wrote an article How to find which processes are causing hard disk i/o overhead on Linux there I explained very rawly few tools which can be used to benchmark hard disk read / write operations. My prior article accent was on iotop and dstat and it just mentioned of iostat. Therefore I've wrote this short article in attempt to explain a bit more thoroughfully on how iostat can be used to track problems with excessive server I/O read/writes.

Here is the command man page description;
iostatReport Central Processing Unit (CPU) statistics and input/output statistics for devices, partitions and network filesystems

I will further proceed with few words on how iostat can be installed on various Linux distros, then point at few most common scenarious of use and a short explanation on the meaning of each of the command outputs.

1. Installing iostat on Linux

iostat is a swiss army knife of finding a server hard disk bottlenecks. Though it is a must have tool in the admin outfut, most of Linux distributions will not have iostat installed by default.
To have it on your server, you will need to install sysstat package:

a) On Debian / Ubuntu and other Debian GNU / Linux derivatives to install sysstat:

debian:~# apt-get --yes install sysstat

b) On Fedora, CentOS, RHEL etc. install is with yum:

[root@centos ~]# yum -y install sysstat

c) On Slackware Linux sysstat package which contains iostat is installed by default. 

d) In FreeBSD, there is no need for installation of any external package as iostat is part of the BSD world (bundle commands).
I should mention bsd iostat and Linux's iostat commands are not the same and hence there use to track down hard disk bottlenecks differs a bit, however the general logic of use is very similar as with most tools in BSD and Linux.

2. Checking a server hard disk for i/o disk bottlenecks on G* / Linux

Once having the sysstat installed on G* / Linux systems, the iostat command will be added in /usr/bin/iostat
a) To check what is the hard disk read writes per second (in megabytes) use:

debian:~# /usr/bin/iostat -m
Linux 2.6.32-5-amd64 (debian) 03/27/2012 _x86_64_ (8 CPU)
avg-cpu: %user %nice %system %iowait %steal %idle
15.34 0.36 2.76 2.66 0.00 78.88
Device: tps MB_read/s MB_wrtn/s MB_read MB_wrtn
sda 63.89 0.48 8.20 6730223 115541235
sdb 64.12 0.44 8.23 6244683 116039483
md0 2118.70 0.22 8.19 3041643 115528074

In the above output the server, where I issue the command is using sda and sdb configured in software RAID 1 array visible in the output as (md0)

The output of iostat should already be easily to read, for anyone who didn't used the tool here is a few lines explanation of the columns:

The %user 15.34 meaning is that 15.34 out of 100% possible i/o load is generad by system level read/write operations.
%nice – >Show the percentage of CPU utilization that occurred while executing at the user level with nice priority.
%iowait – just like the top command idle it shows the idle time when the system didn't have an outstanding disk I/O requests.
%steal – show percentage in time spent in time wait of CPU or virtual CPUs to service another virtual processor (high numbers of disk is sure sign for i/o problem).
%idle – almost the same as meaning to %iowait
tps – HDD transactions per second
MB_read/s (column) – shows the actual Disk reads in Mbytes at the time of issuing iostat
MB_wrtn/s – displays the writes p/s at the time of iostat invocation
MB_read – shows the hard disk read operations in megabytes, since the server boot 'till moment of invocation of iostat
MB_wrtn – gives the number of Megabytes written on HDD since the last server boot filesystem mount

The reason why the Read / Write values for sda and sdb are similar in this example output is because my disks are configured in software RAID1 (mirror)

The above iostat output reveals in my specific case the server is experiencing mostly Disk writes (observable in the high MB_wrtn/s 8.19 md0 in the above sample output).

It also reveals, the I/O reads experienced on that server hard disk are mostly generated as a system (user level load) – see (%user 15.34 and md0 2118.70).

For all those not familiar with system also called user / level load, this is all kind of load which is generated by running programs on the server – (any kind of load not generated by the Linux kernel or loaded kernel modules).

b) To periodically keep an eye on HDD i/o operations with iostat, there are two ways:

– Use watch in conjunction with iostat;

[root@centos ~]# watch "/usr/bin/iostat -m"
Every 2.0s: iostat -m Tue Mar 27 11:00:30 2012
Linux 2.6.32-5-amd64 (centos) 03/27/2012 _x86_64_ (8 CPU)
avg-cpu: %user %nice %system %iowait %steal %idle
15.34 0.36 2.76 2.66 0.00 78.88
Device: tps MB_read/s MB_wrtn/s MB_read MB_wrtn
sda 63.89 0.48 8.20 6730255 115574152
sdb 64.12 0.44 8.23 6244718 116072400
md0 2118.94 0.22 8.20 3041710 115560990
Device: tps MB_read/s MB_wrtn/s MB_read MB_wrtn
sda 55.00 0.01 25.75 0 51
sdb 52.50 0.00 24.75 0 49
md0 34661.00 0.01 135.38 0 270

Even though watch use and -d might appear like identical, they're not watch does refresh the screen, executing instruction similar to the clear command which clears screen on every 2 seconds, so the output looks like the top command refresh, while passing the -d 2 will output the iostat command output on every 2 secs in a row so all the data is visualized on the screen. Hence -d 2 in cases, where more thorough debug is necessery is better. However for a quick routine view watch + iostat is great too.

c) Outputting extra information for HDD input/output operations;

root@debian:~# iostat -x
Linux 2.6.32-5-amd64 (debian) 03/27/2012 _x86_64_ (8 CPU)
avg-cpu: %user %nice %system %iowait %steal %idle
15.34 0.36 2.76 2.66 0.00 78.88
Device: rrqm/s wrqm/s r/s w/s rsec/s wsec/s avgrq-sz avgqu-sz await svctm %util
sda 4.22 2047.33 12.01 51.88 977.44 16785.96 278.03 0.28 4.35 3.87 24.72
sdb 3.80 2047.61 11.97 52.15 906.93 16858.32 277.05 0.03 5.25 3.87 24.84
md0 0.00 0.00 20.72 2098.28 441.75 16784.05 8.13 0.00 0.00 0.00 0.00

This command will output extended useful Hard Disk info like;
r/s – number of read requests issued per second
w/s – number of write requests issued per second
rsec/s – numbers of sector reads per second
b>wsec/s – number of sectors wrote per second
etc. etc.

Most of ppl will never need to use this, but it is good to know it exists.

3. Tracking read / write (i/o) hard disk bottlenecks on FreeBSD

BSD's iostat is a bit different in terms of output and arguments.

a) Here is most basic use:

freebsd# /usr/sbin/iostat
tty ad0 cpu
tin tout KB/t tps MB/s us ni sy in id
1 561 45.18 44 1.95 14 0 5 0 82

b) Periodic watch of hdd i/o operations;

freebsd# iostat -c 10
tty ad0 cpu
tin tout KB/t tps MB/s us ni sy in id
1 562 45.19 44 1.95 14 0 5 0 82
0 307 51.96 113 5.73 44 0 24 0 32
0 234 58.12 98 5.56 16 0 7 0 77
0 43 0.00 0 0.00 1 0 0 0 99
0 485 0.00 0 0.00 2 0 0 0 98
0 43 0.00 0 0.00 0 0 1 0 99
0 43 0.00 0 0.00 0 0 0 0 100
...

As you see in the output, there is information like in the columns tty, tin, tout which is a bit hard to comprehend.
Thanksfully the tool has an option to print out only more essential i/o information:

freebsd# iostat -d -c 10
ad0
KB/t tps MB/s
45.19 44 1.95
58.12 97 5.52
54.81 108 5.78
0.00 0 0.00
0.00 0 0.00
0.00 0 0.00
20.48 25 0.50

The output info is quite self-explanatory.

Displaying a number of iostat values for hard disk reads can be also achieved by omitting -c option with:

freebsd# iostat -d 1 10
...

Tracking a specific hard disk partiotion with iostat is done with:

freebsd# iostat -n /dev/ad0s1a
tty cpu
tin tout us ni sy in id
1 577 14 0 5 0 81
c) Getting Hard disk read/write information with gstat

gstat is a FreeBSD tool to print statistics for GEOM disks. Its default behaviour is to refresh the screen in a similar fashion like top command, so its great for people who would like to periodically check all attached system hard disk and storage devices:

freebsd# gstat
dT: 1.002s w: 1.000s
L(q) ops/s r/s kBps ms/r w/s kBps ms/w %busy Name
0 10 0 0 0.0 10 260 2.6 15.6| ad0
0 10 0 0 0.0 10 260 2.6 11.4| ad0s1
0 10 0 0 0.0 10 260 2.8 12.5| ad0s1a
0 0 0 0 0.0 0 0 0.0 20.0| ad0s1b
0 0 0 0 0.0 0 0 0.0 0.0| ad0s1c
0 0 0 0 0.0 0 0 0.0 0.0| ad0s1d
0 0 0 0 0.0 0 0 0.0 0.0| ad0s1e
0 0 0 0 0.0 0 0 0.0 0.0| acd0

It even has colors if your tty supports colors 🙂

Another useful tool in debugging the culprit of excessive hdd I/O operations is procstat command:

Here is a sample procstat run to track (httpd) one of my processes imposing i/o hdd load:

freebsd# procstat -f 50404
PID COMM FD T V FLAGS REF OFFSET PRO NAME
50404 httpd cwd v d -------- - - - /
50404 httpd root v d -------- - - - /
50404 httpd 0 v c r------- 56 0 - -
50404 httpd 1 v c -w------ 56 0 - -
50404 httpd 2 v r -wa----- 56 75581 - /var/log/httpd-error.log
50404 httpd 3 s - rw------ 105 0 TCP ::.80 ::.0
50404 httpd 4 p - rw---n-- 56 0 - -
50404 httpd 5 p - rw------ 56 0 - -
50404 httpd 6 v r -wa----- 56 25161132 - /var/log/httpd-access.log
50404 httpd 7 v r rw------ 56 0 - /tmp/apr8QUOUW
50404 httpd 8 v r -w------ 56 0 - /var/run/accept.lock.49588
50404 httpd 9 v r -w------ 1 0 - /var/run/accept.lock.49588
50404 httpd 10 v r -w------ 1 0 - /tmp/apr8QUOUW
50404 httpd 11 ? - -------- 2 0 - -

Btw fstat is sometimes helpful in identifying the number of open files and trying to estimate which ones are putting the hdd load.
Hope this info helps someone. If you know better ways to track hdd excessive loads on Linux / BSD pls share 'em pls.
 

Finding nearest package software repository in Debian GNU / Linux

Thursday, September 6th, 2012

finding debian Ubuntu package repository icon

I’m about to chage the good old computeres until this very moment this blog and few other website were running on. Right now, I’m installing the brand new machine Lenovo ThinkCentre Edge great and hopefully powerful enough machine to take care for the periodic occuring high traffic loads which break up webserver or SQL server. Well anyways, I just installed latest Debian GNU / Linux on this brand new piece of iron. During install I couldn’t connect the PC to network so Debian install was unable to determine, the nearest Debian package repository, hence after completing install and anually configuring Debian network . Because during install the system had no connection with the Internet, no proper package repository definitions were present in /etc/apt/sources.list, hence I had to find the nearest package software repository. Normally one can check in Debian official WorldWide Mirror sites full address list and determine by some rationalization with ping or / and a manual package download which repo is quickest. There is thanksfully a better automated way one can determine the closest deb Debian / Ubuntu located repository with netselect-apt.

Here is apt-cache description:

debian:~# apt-cache search netselect-apt
netselect-apt - speed tester for choosing a fast Debian mirror

Using the tool is trivial, just install, run it and it does all 4 u 🙂

1. Install netselect-apt

debian:~# apt-get install --yes netselect-apt

2. Run it

debian:~# netselect-apt
....
130/debian/); keeping only under first name.
netselect: 2 (2 active) nameserver request(s)...

Duplicate address 200.236.31.3 (http://debian.c3sl.ufpr.br/debian/, http://ftp.br.debian.org/debian/); keeping only under first name.
netselect: 1 (1 active) nameserver request(s)...
Running netselect to choose 1 out of 383 addresses.
.............................................
The fastest server seems to be:
http://debian.telecoms.bg/debian/

Writing sources.list.
sources.list exists, moving to sources.list.1346964774
Done.

As you can see from output, the tool finds the quickest download deb repository and generate /etc/apt/sources.list file in current directory, where it is run in, in this exact case it creates it in root user home dir – e.g. in /root/ directory. Once the repo address is found you can copy paste it with some text editor to /etc/apt/sources.list or move it over /etc/apt/sources.list;

debian:~# cp -rpf /etc/apt/sources.list /etc/apt/sources.list.$(date +%d_%m_%Y|sed -e 's/^ *//')
debian:~# mv /root/sources.list /etc/apt/sources.list

Just in case as I always make first copy of original sources.list, this is not necessery but IMHO a generally good sysadmin habit 🙂

Besides netselect-apt, which automatically choose between all available list of software repo servers, there is also netselect tool. netselect does basically the same the only difference is one has to manually pass by as arguments deb package repositories and the tool then does tests and returns which is the overall quickest deb download source.

netselect is definitely useful if you have started few own mirror of repositories and want to determine which is the best among them.

Here is how netselect is used:

# netselect -vv ftp.fceia.unr.edu.ar ftp.kulnet.kuleuven.ac.be \
ftp.cdrom.com ftp.debian.org ftp.de.debian.org
ftp.fceia.unr.edu.ar 2792 ms 23 hops 100% ok ( 1/ 1) [ 9213]
ftp.kulnet.kuleuven.ac.be 9999 ms 30 hops 0% ok
ftp.cdrom.com 94 ms 8 hops 100% ok (10/10) [ 169]
ftp.debian.org 46 ms 15 hops 100% ok (10/10) [ 115]
ftp.de.debian.org 9999 ms 30 hops 0% ok

According to above output, the “best reachable” (quickest) repository is the one to which are the least miliseconds – ftp.debian.org

Thanks to- https://www.wzdftpd.net/blog/index.php? -for the nice Debian package box picture – all copyrights belong to respective authors and licensing.
Cheers ! 🙂